
There has been a vigorous discussion of weather station calibration adjustments in the media over the past few weeks. While these adjustments don't have a big effect on the global temperature record, they are needed to obtain consistent local records from equipment which has changed over time. Despite this, the Telegraph has produced two highly misleading stories about the station adjustments, the second including the demonstrably false claim that they are responsible for the recent rapid warming of the Arctic.
In the following video I show why this claim is wrong. But more importantly, I demonstrate three tools to allow you to test claims like this for yourself.
The central error in the Telegraph story is the attribution of Arctic warming (and somehow sea ice loss) to weather station adjustments. This conclusion is based on a survey of two dozen weather stations. But you can of course demonstrate anything you want by cherry picking your data, in this case in the selection of stations. The solution to cherry picking is to look at all of the relevant data - in this case all of the station records in the Arctic and surrounding region. I downloaded both the raw and adjusted temperature records from NOAA, and took the difference to determine the adjustments which had been applied. Then I calculated the trend in the adjustment averaged over the stations in each grid cell on the globe, to determine whether the adjustments were increasing or decreasing the temperature trend. The results are shown for the last 50 and 100 years in the following two figures:
Trend in weather station adjustments over the period 1965-2014, averaged by grid cell. Warm colours show upwards adjustments over time, cold colour downwards. For cells with less than 50 years of data, the trend is over the available period.
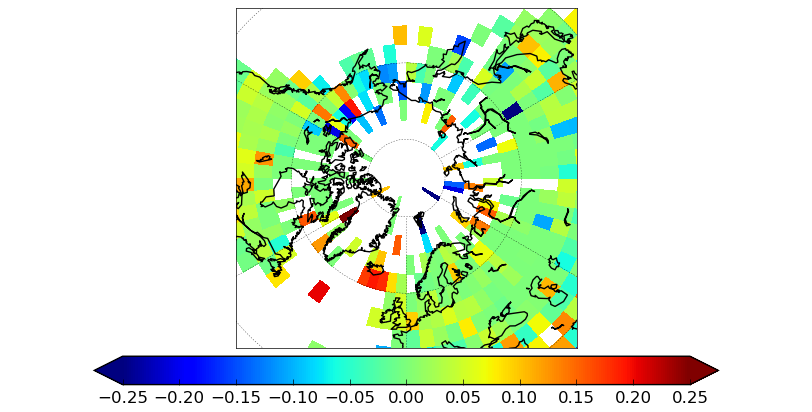
Trend in weather station adjustments over the period 1915-2014, averaged by grid cell. Warm colours show upwards adjustments over time, cold colour downwards. For cells with less than 100 years of data, the trend is over the available period.
The majority of cells show no significant adjustment. The largest adjustments are in the high Arctic, but are downwards, i.e. they reduce the warming trend. This is the opposite of what is claimed in the Telegraph story. You can check these stations using the GHCN station browser.
The upward adjustments to the Iceland stations, referred to in the Telegraph, predate the late 20th century warming. They occur mostly in the 1960's, so they only appear in the centennial map. Berkeley Earth show a rather different pattern of adjustments for these stations.
Iceland is a particularly difficult case, with a small network of stations on an island isolated from the larger continental networks. The location of Iceland with respect to the North Atlantic Drift, which carries warm water from the tropics towards the poles, may also contribute to the temperature series being mismatched with records from Greenland or Scotland. However given that the Iceland contribution is weighted according to land area in the global records, the impact of this uncertainty is minimal. Global warming is evaluated on the basis of the land-ocean temperature record; the impact of adjustments on recent warming is minimal, and on the whole record it is small compared to the total amount of warming. As Zeke Hausfather has noted, the land temperature adjustments in the early record are smaller than and in the opposite direction to the sea surface temperature adjustments.
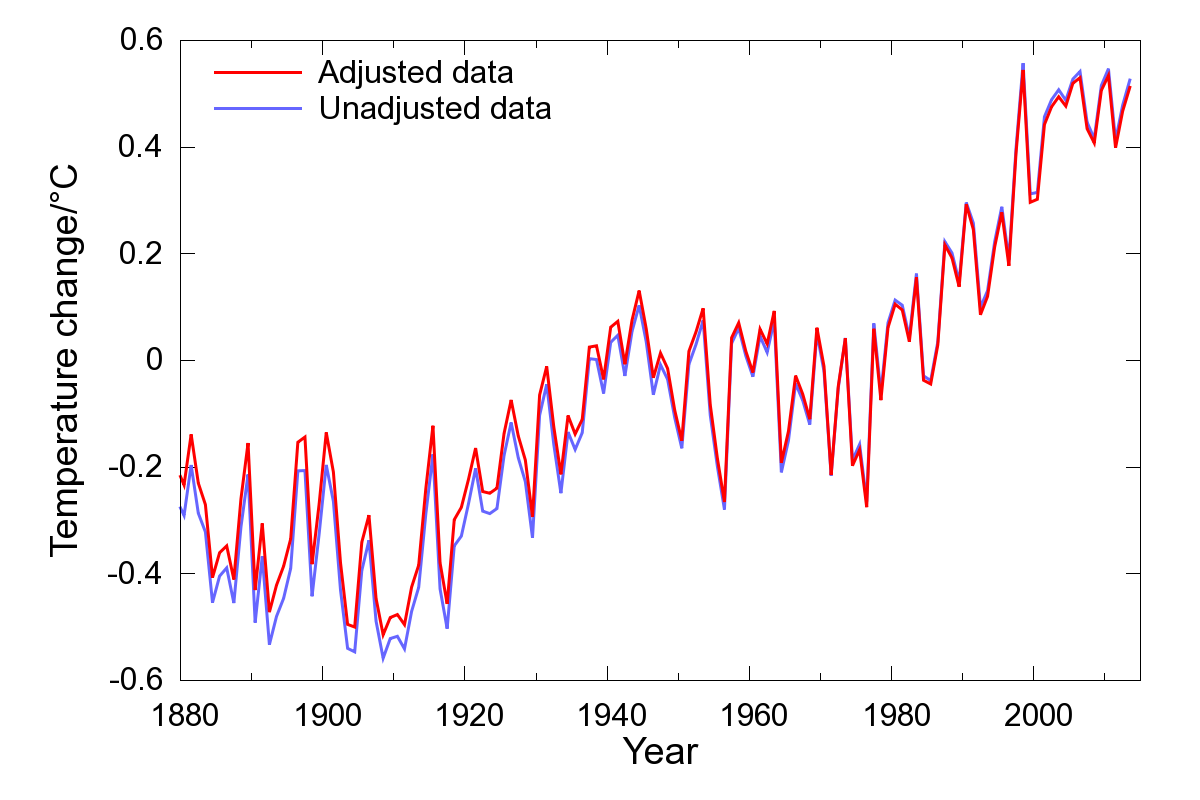
Impact of the weather stations adjustments on the global land-ocean temperature record, calculated using the Skeptical Science temperature record calculator in 'CRU' mode.
Manual recalibration of the Iceland records may make an interesting citizen science project. Most of the stations show good agreement since 1970, however they diverge in the earlier record. The challenge is to work out the minimum number of adjustments required to bring them into agreement over the whole period. But the answer may not be unique, and noise and geographical differences may also cause problems. To facilitate this challenge, I've made annualized data available for the eight stations as a spreadsheet file.
In the video I demonstrate three tools which are useful in understanding and evaluating temperature adjustments:
A GHCN (global historical climatology network) station report browser. GHCN provide graphical reports on the adjustments made to each station record, but you need to know the station ID to find them. I have created an interactive map to make this easier.
The Berkeley Earth station browser. The Berkeley Earth station reports provide additional information to help you understand why particular adjustments have been made.
The Skeptical Science temperature record calculator. This allows you to construct your own version of the temperature record, using either adjusted or unadjusted data for both the land and sea surface temperatures.
Data for the temperature calculator may be obtained from the following sources:
The GHCN station data. For daily average temperature data, look for the 'tavg' files. The 'qca' files are adjusted temperatures, and the 'qcu' files are unadjusted temperatures. The files are stored in '.tar.gz' archives, and may be extracted using most freely available unzip software.
The Hadley sea surface temperature data. Look for the files HadSST.3.1.1.0.median.zip, or HadSST.3.1.1.0.unadjusted.zip for the unadjusted data.
Finally, here are some interesting papers discussing why adjustments are required.
Menne et al (2009) The U.S. historical climatology network monthly temperature data, version 2.
Bohm et al (2010) The early instrumental warm-bias: a solution for long central European temperature series 1760–2007.
Brunet et al (2010) The minimization of the screen bias from ancient Western Mediterranean air temperature records: an exploratory statistical analysis.
Ellis (1890) On the difference produced in the mean temperature derived from daily maximum and minimum readings, as depending on the time at which the thermometers are read
Posted by Kevin C on Tuesday, 24 February, 2015
 |
The Skeptical Science website by Skeptical Science is licensed under a Creative Commons Attribution 3.0 Unported License. |