New measurements from Alaska and Oklahoma have confirmed that recent increases in carbon dioxide (CO2) in the air, caused mostly by burning coal, oil and gas, are indeed heating up Earth's surface by making the greenhouse effect stronger (Feldman et al. 2015).
This was already beyond all reasonable doubt: satellites (Harries et al., 2001), computer simulations tested with measurements from planes (Tjemkes et al., 2004) and other ground experiments (Evans & Puckrin, 2006, Philipona et al., 2004) confirmed that more CO2 is making us hotter. This new study is still important though. Unlike satellites, these measurements were taken from Earth's surface. And unlike the previous surface measurements, this experiment combines a decade-long experiment with the right instruments to be able to untangle the causes of heating.
Rather like a tuning fork humming to the right note, greenhouse gases like CO2 respond to specific frequencies of light. The Earth glows constantly in the infrared (a bunch of colours we can't see) and greenhouse gases respond. They absorb very specific fractions of some frequencies and then recycle the energy they absorbed, sending some of it back down to Earth to warm us up.
In this study, instruments called spectrometers were pointed at the sky to watch this recycled infrared. They split light into its different frequencies (or colours, if you prefer) like a rainbow or a prism does. The brightness of each frequency is measured, the whole spectrum is put back together and patterns in the spectrum tell us what's going on.
The scientists used their measurements to test a computer model of the physics of how light moves in the atmosphere (LBLRTM, available here). It needs to know things like temperature, humidity and the presence of other gases in the air, and these were provided by a combination of weather balloons and some other sources. Measurements and simulations were only done when the sky was clear of clouds to make comparison easier. For the frequencies where CO2 is most active, the computer model predicted the spectrum to within a few tenths of a percent in most cases, so it's reliable.
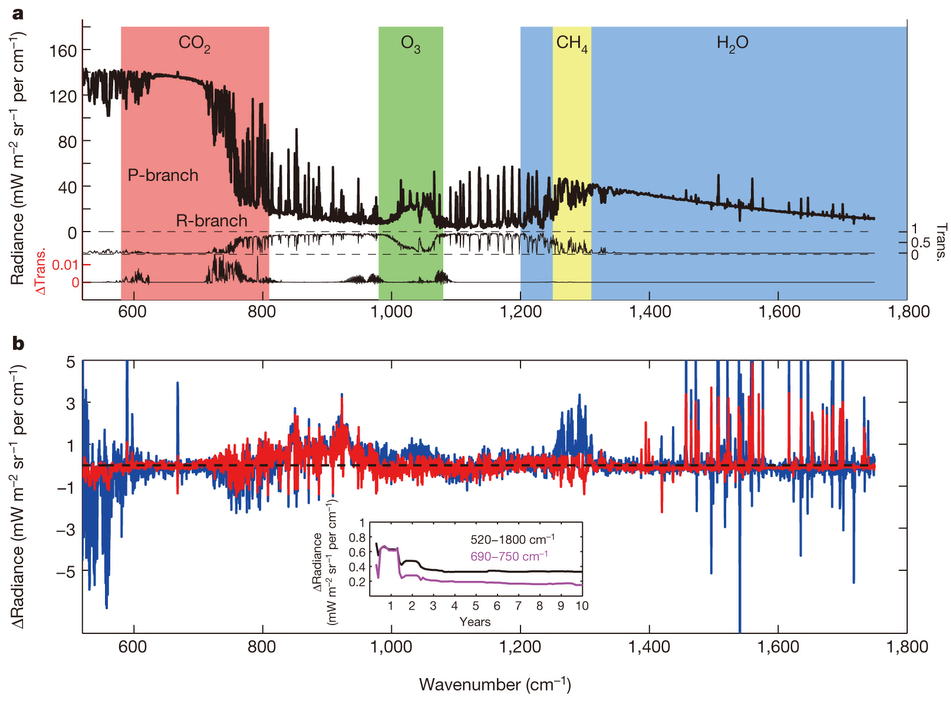
Figure 1 The top is what a spectrum looks like, with the radiance (think "brightness") at each different frequency (reported here as wavenumber). The left shaded red bit is mostly from CO2, and can be separated from the effect of other things like water vapour. The bottom shows, in red, the difference between the computer simulation and the measurements over March 2001. Differences in the CO2 region are mostly less than 0.5 units, out of total measurements of up to 140 units.
Some older studies that managed to measure over a longer period of time used instruments that weren't able to split up the atmosphere's spectrum: they could tell that more heat was coming down, but they couldn't directly measure the cause. Big, quick changes can happen because of changes in the air's temperature or the amount of water vapour, for example. These new measurements can tell the difference.
In the next step, the team calculated the amount of CO2-caused heating. They ran the impressively-accurate computer model LBLRTM with the observed changes in atmospheric temperature and everything else except for CO2. It was fixed at the starting level. Outside of the CO2 bands, the model matched the observations, but inside the CO2 bands the observations were different. This difference is due to the extra heat being sent down by CO2, and the team used this to calculate the growth in heating from CO2.
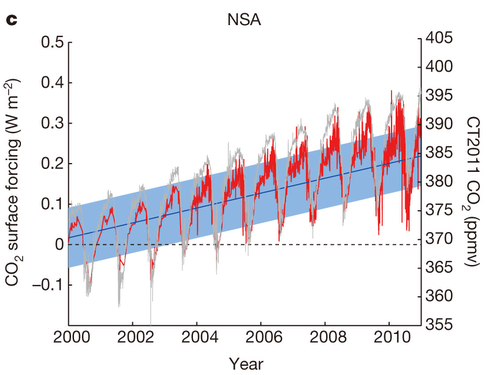
Figure 2 As measured at the North Slope Alaska (NSA) measurement site, the growth in CO2 heating effect is shown in red, and in grey the concentration of CO2 estimated to be in the bottom 2 km of the atmosphere is shown. The CO2 heating effect is in Watts per square metre, and the amount of CO2 in parts per million.
From 2000–2010, the CO2 we added to the atmosphere (22 parts per million) added another 0.2 Watts per square metre (W m-2) of heating to the surface. It was even possible to see the yearly cycle of plant growth: spring growth sucks up CO2 and reduces its heating effect, before the plants lose leaves for winter and the CO2 and its heating effect returns.
The extra heating reported here is not directly comparable with the effect known as radiative forcing, which is used to help project climate change. However, it confirms the calculations that have been used to work out these values.
We already knew that the greenhouse effect was real and that we're making it stronger. This new study uses some truly impressive measurements, and reports that they match the predictions of physics excellently. The computer models that apply these physics have been rigorously tested in the past and they are an amazing achievement.
I would interpret this study as being worth a sigh of relief: physics works great at calculating CO2's heating effect so we can move on to other problems. It's unlikely to change the opinions of those who deny the greenhouse effect though. Measurements showing that it exists and is getting stronger have been around for years, and evidence has failed to convince them so far, so there's no reason to think this will be any different.
Posted by MarkR on Monday, 23 March, 2015
 |
The Skeptical Science website by Skeptical Science is licensed under a Creative Commons Attribution 3.0 Unported License. |