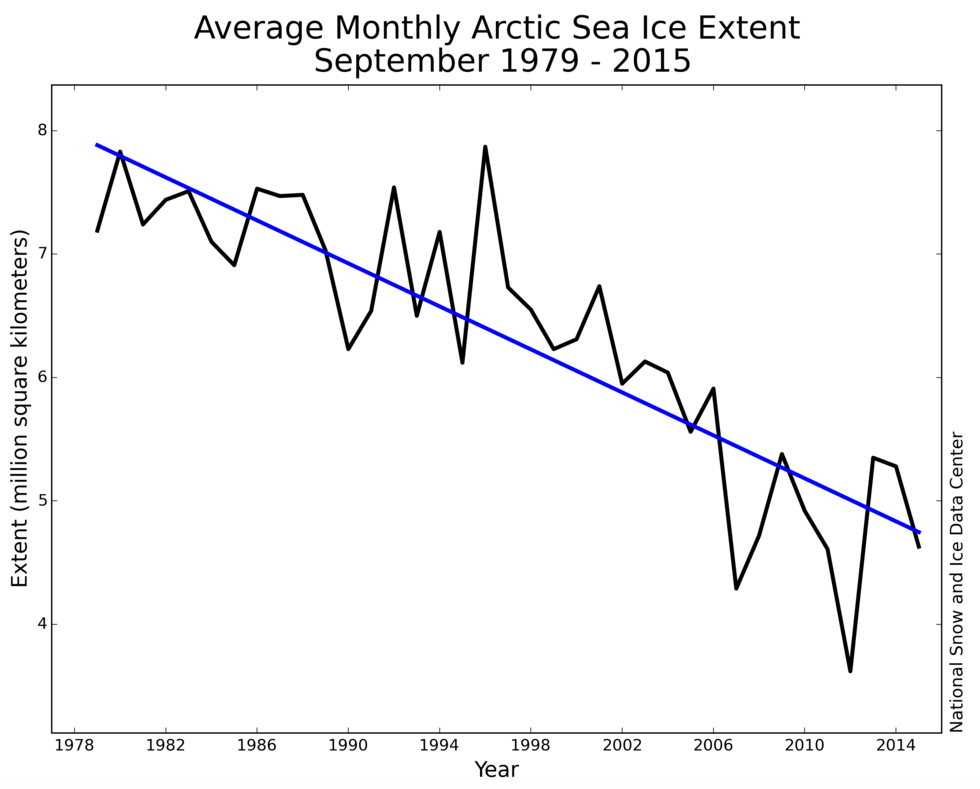
Average monthly Arctic sea ice extent in September between 1979 and 2015 (at a rate of 13.4% per decade). Credit: NSIDC
This is a re-post from Carbon Brief by Florence Fetterer, principal investigator at the National Snow and Ice Data Centre (NSIDC) in the US.
Sea ice cover in the Arctic has undergone a widely reported decline in recent decades. The decrease has been greatest during summer, with sea ice extent reducing by around 12% per decade since the satellite record began in 1979.
The main cause of this rapid decline is rising air temperatures. The Arctic is warming twice as quickly as the global average, a phenomenon known as Arctic amplification. Other factors, such as wind patterns and ocean warming, also play a role in the diminishing sea ice.
Average monthly Arctic sea ice extent in September between 1979 and 2015 (at a rate of 13.4% per decade). Credit: NSIDC
Satellites provide a near-continuous record of Arctic sea ice cover, allowing scientists to monitor changes from one day to the next. But because this data spans only the most recent three and a half decades, we need to look elsewhere to gather information on variations over longer periods.
This data is necessary as there are some research questions that can’t be answered with only short-term records, such as:
To tackle this problem we set about constructing a record of sea ice going back to 1850. And this meant gathering data from some rather unusual sources.
First, a little background. In the 1970s, the world’s community of sea ice researchers was a small one. Academics were mainly interested in the role sea ice played in regulating the surface energy balance of the Arctic. Sea ice insulates the cold atmosphere from the warmer ocean, reflects sunlight throughout the polar summer, and releases or stores heat through the process of melting or freezing.
At the time, the question of whether variability in Arctic sea ice extent was being affected by the climate was still an open one.
Nevertheless, scientists were still concerned about preserving existing data on sea ice, and gathering more, with the aim of producing an Arctic-wide view of sea ice conditions.
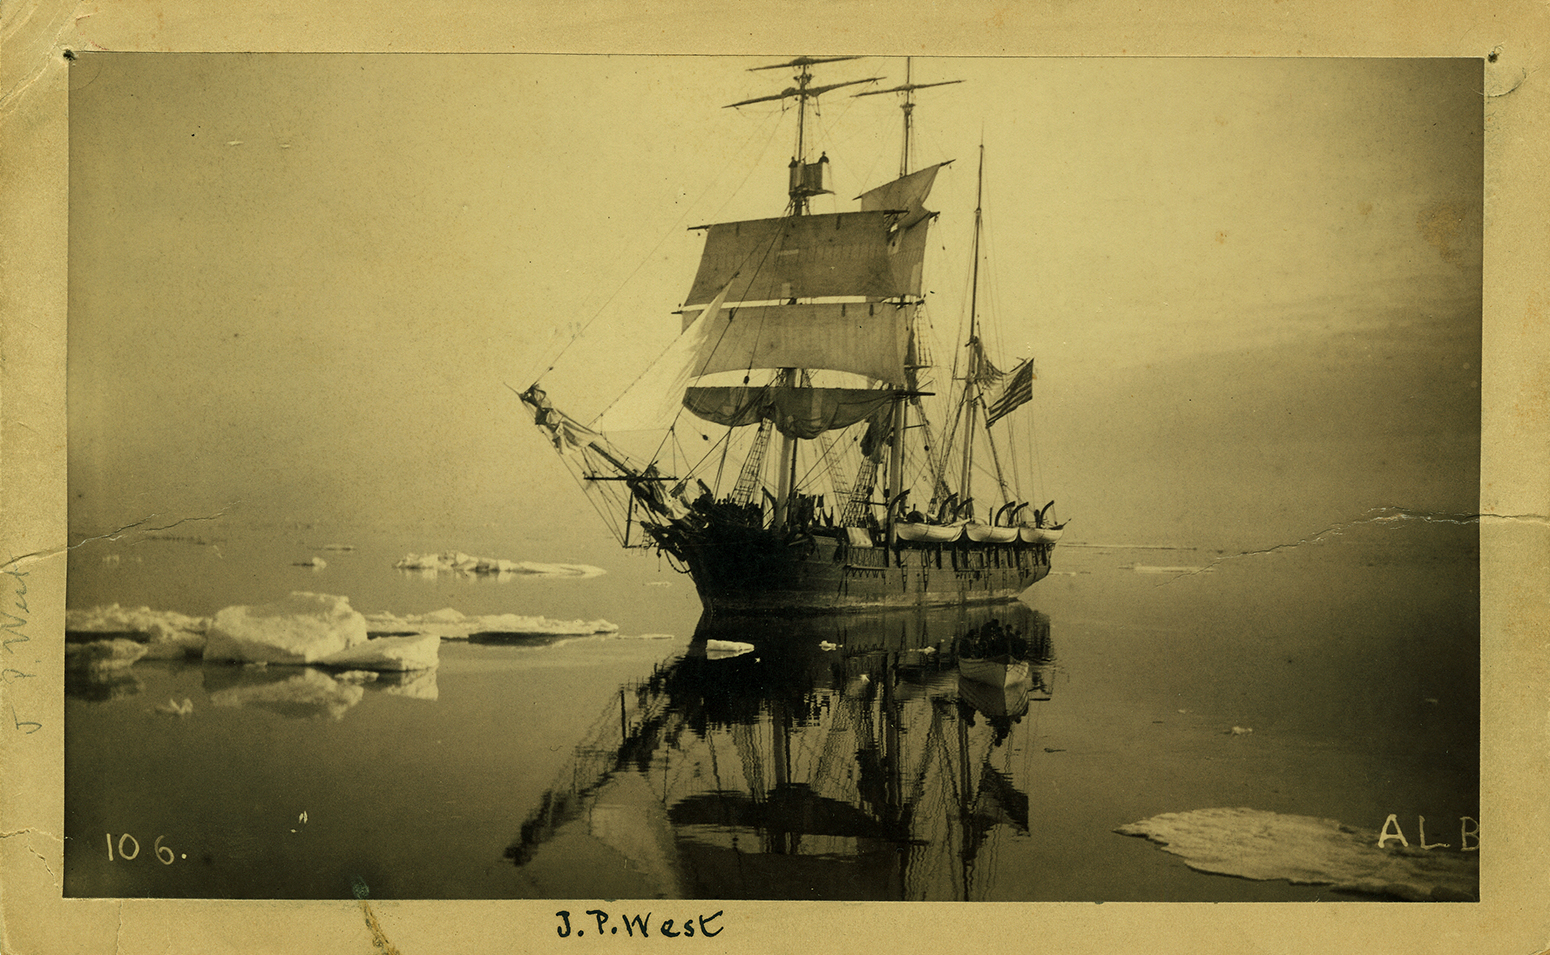
Observations of sea ice came from far and wide, including ship reports, aeroplane surveys, compilations by naval oceanographers, and analyses by national ice services and meteorological offices.
Prof John Walsh, now at the University of Alaska Fairbanks, and Dr Mick Kelly, from the University of East Anglia (now retired), were pioneers at retrieving data. They hand-digitised information from sources, such as aerial surveys, from the US Navy and UK Meteorological Office, and from the Danish Meteorological Institute’s yearbook maps (see examples from 1978 and 1979 – both pdfs).
Walsh, along with Prof William Chapman from University of Illinois, used these various sources to make monthly grids in Arctic and Southern Ocean sea ice concentrations, covering the period 1901-95. These grids proved to be very popular among researchers – possibly because there were few alternatives.
However, the early years of this record had significant gaps. Almost no ice information was collected during the second world war, for example.
These gaps were filled by using the long-term averages for each month. This is illustrated in the charts below, which show monthly sea ice data from the Met Office Hadley Centre (red and black lines) and the recent NASA satellite record (blue line).
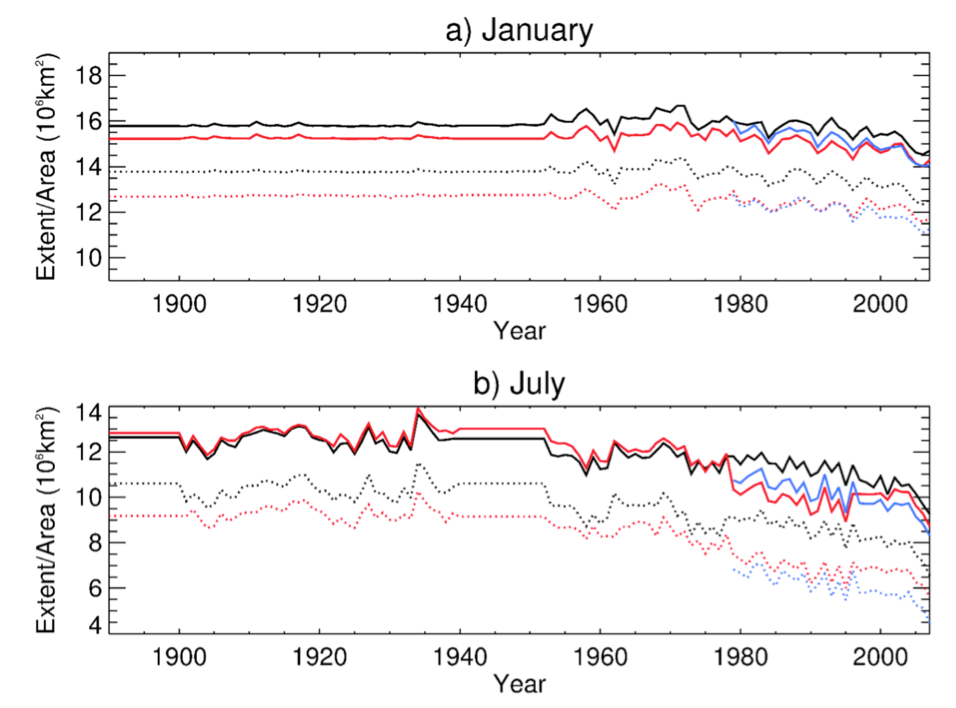
Time series of Northern Hemisphere sea ice extent (solid line) and area (dotted) for 1890-2007, for the Met Office Hadley Centre datasets HadISST.2.1.0.0 (black), HadISST1.1 (red), and the NASA Team dataset (blue). Monthly average values are shown for a) January and b) July. Credit: Holly Titchner, UK Met Office
While this data provides an indication of long-term sea ice changes, it doesn’t accurately reflect the ups and downs of natural variability. This presents a problem for climate modellers, who need data with realistic past sea ice fluctuations on which to base their projections for the future.
Fortunately, in the decade since those monthly grids were published, more historical data sources have become available.
We’ve used a range of new data sources to fill gaps and extend the Arctic sea ice record back to 1850. We’ve also updated the record with the latest satellite data.
These are some of the sources of information we used to create our sea ice dataset:
In the Crow’s Nest, watching for a whale ‘blow’. “Thar she blows”. Photo courtesy of the New Bedford Whaling Museum.
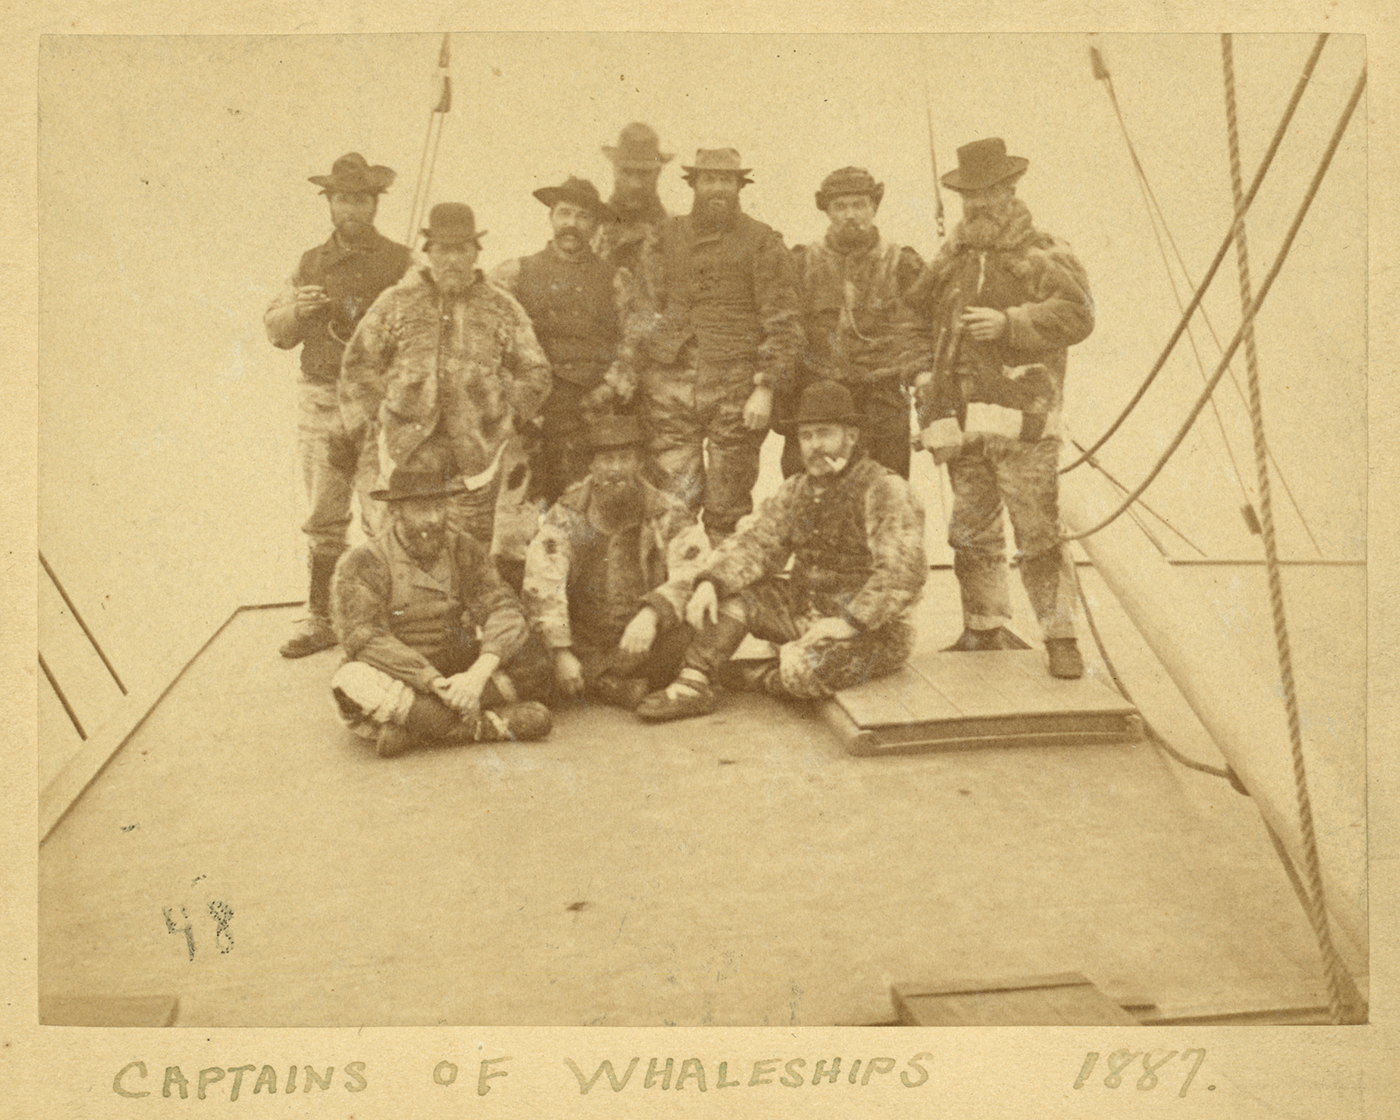
Captains of whaleships in Arctic dress; (left to right) Captains Shockley, Owen, Tobey, Whiteside, Adams, Millard, Fisher, Ellis, Keenan, Baker. Photo courtesy of the New Bedford Whaling Museum.
These new sources already existed as data compilations in one form or another before we got hold of them. But many needed digitisation and interpretation before the information could be incorporated into a long-term record. For example, below is one of the aerial survey maps from the Arctic and Antarctic Research Institute in Russia. The different colour shading indicates the coverage of sea ice.
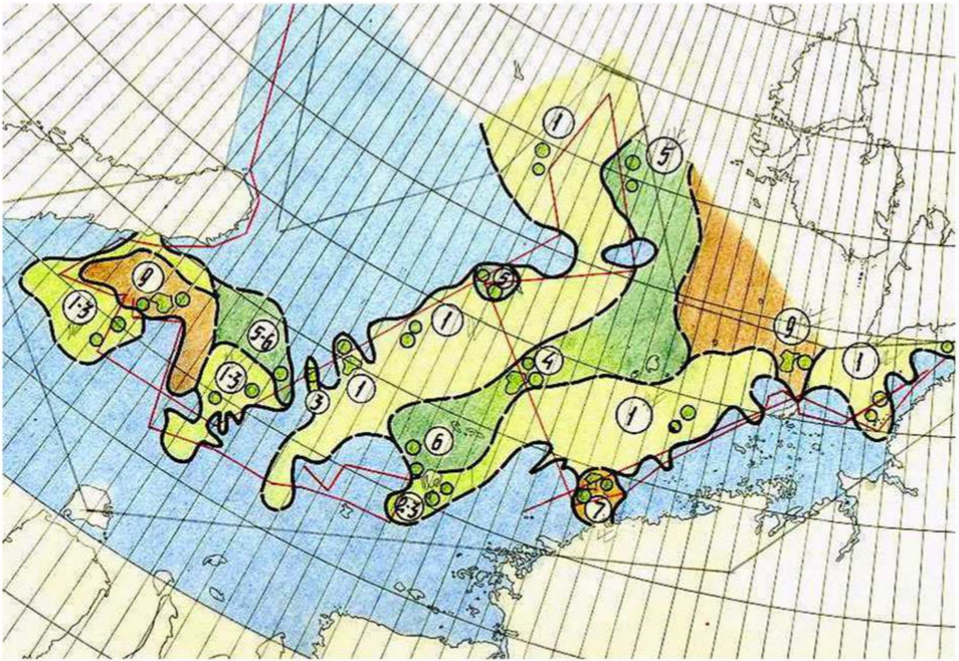
Example of an early (August 1933) sea ice cover map compiled by the Arctic and Antarctic Research Institute (St. Petersburg, Russia). The shading colour indicates sea ice extent. Credit: Walsh et al. (2016)
You can see another source of data below, this time one of the maps from the Danish Meteorological Institute. These are remarkable for their information value and because they represent a cooperative international effort to report ice conditions in a systematic way that was sustained over decades. The red symbols and terms in the legend (see close-up below the map) indicate the sea ice extent. “Tight pack-ice”, for example, indicates ice of 70% to 90% concentration of ice over the sea.
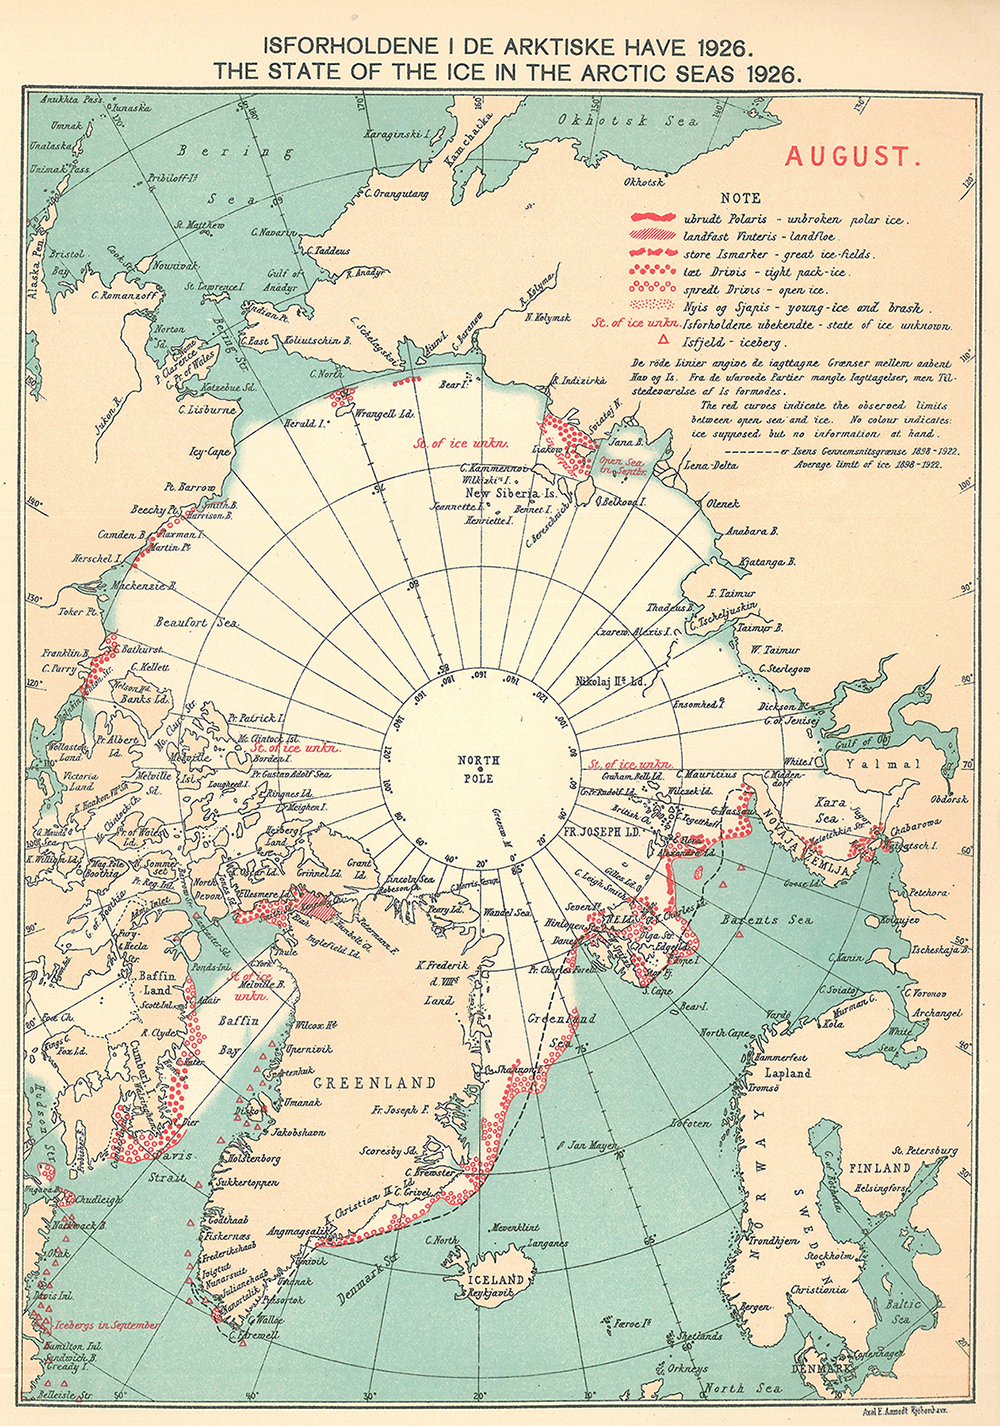
A Danish Meteorological Institute ice chart for August, 1926. The red symbols mark the location of observations recorded in ship logbooks. Source: Walsh et al. (2016).
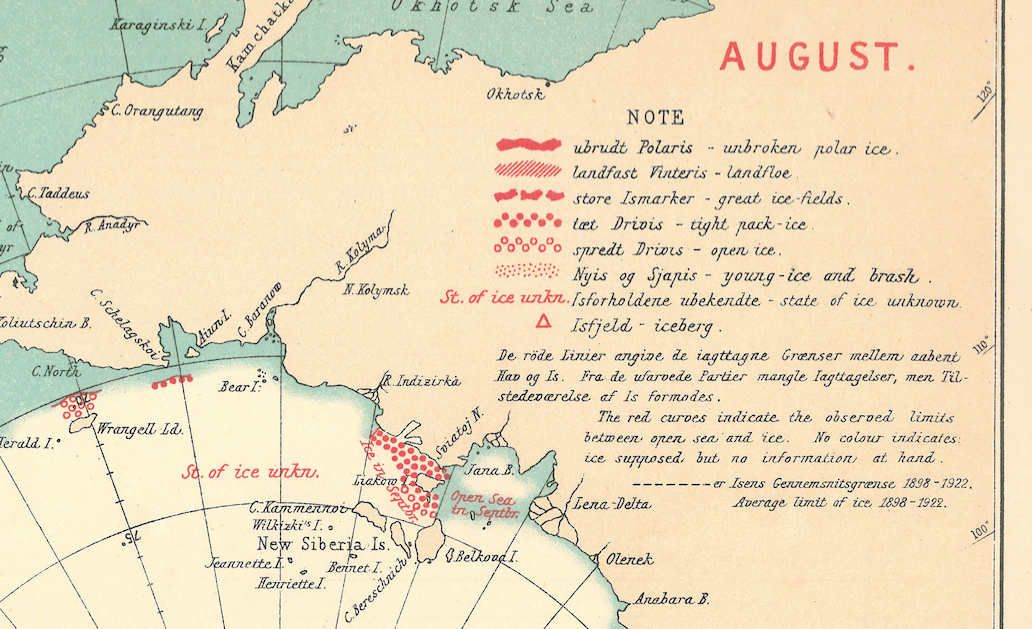
Close-up view of the legend for the above sea ice chart. Credit: Walsh et al. (2016)
The result of all this work is our new dataset, “Gridded Monthly Sea Ice Extent and Concentration, 1850 Onwards”. This has a much more realistic representation of the year-to-year fluctuations in sea ice, as well as the long-term trend.
The charts below illustrate the new record. The blue line shows Arctic sea ice extent in March, at the end of the winter when the ice is at its annual maximum. The red line shows sea ice cover in September, at the end of the summer when ice extent shrinks to its yearly minimum.
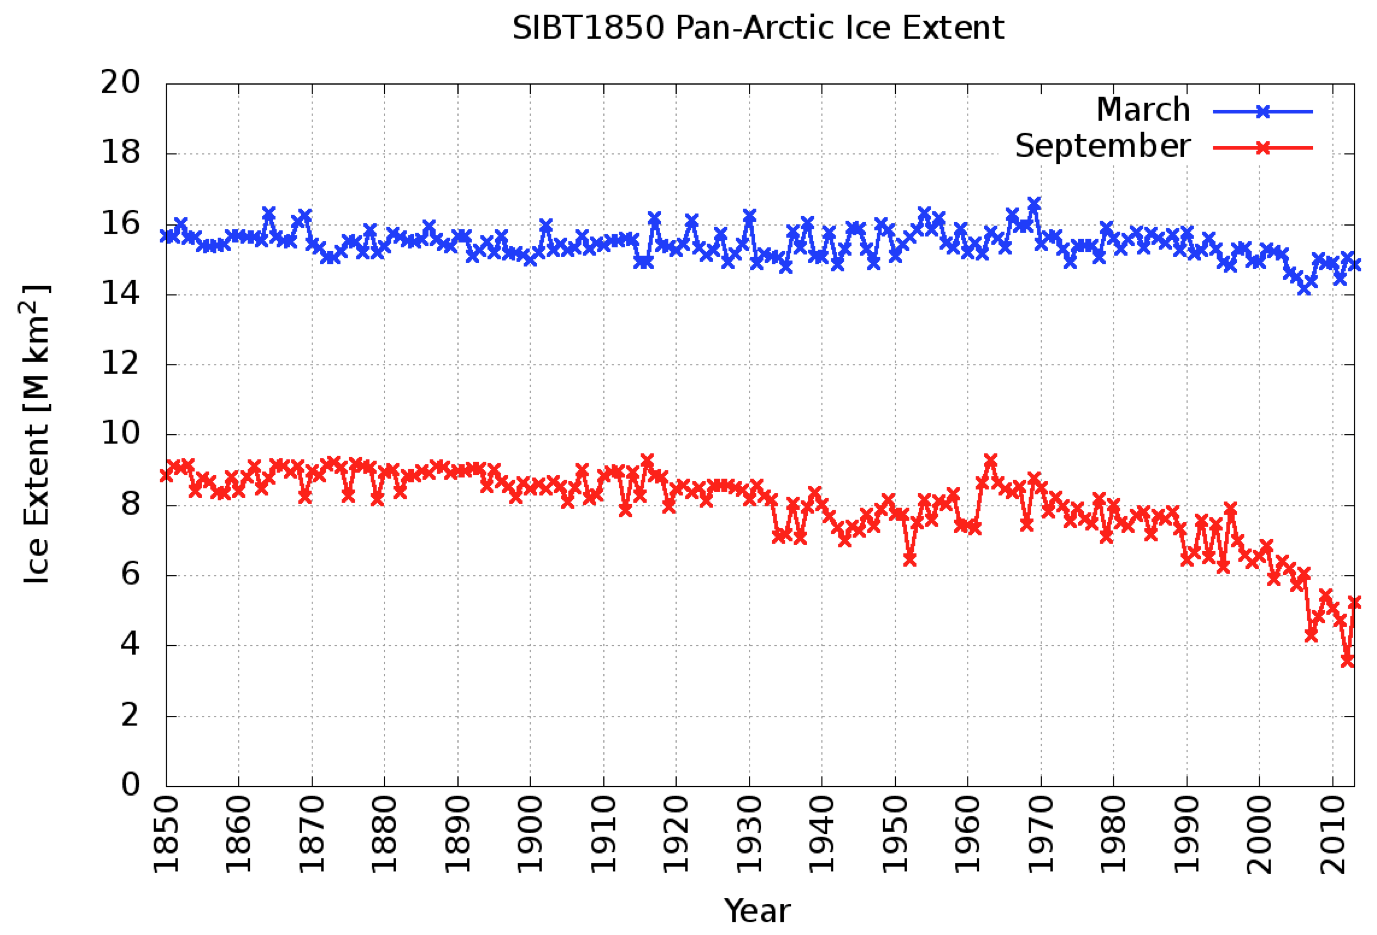
Time series of Arctic sea ice extent, 1850-2013, for March (blue line) and September (red line). Credit: Walsh et al. (2016)
Most fundamentally of all, the new dataset allows us to answer the three questions we posed at the beginning of this article.
First, there is no point in the past 150 years where sea ice extent is as small as it has been in recent years. Second, the rate of sea ice retreat in recent years is also unprecedented in the historical record. And, third, the natural fluctuations in sea ice over multiple decades are generally smaller than the year-to-year variability.
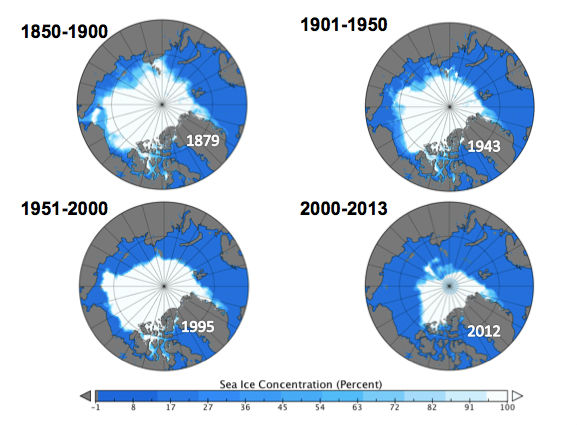
Sea ice cover maps for the annual minimum in September, for the periods 1850-1900, 1901-1950, 1951-2000, and 2001-2013. The maps show the sea ice extent in the lowest minimum during each period, which are in years: 1879, 1943, 1995, and 2012.
This guest article is based on the following journal paper: Walsh, J. E., Fetterer, F., Stewart, J. S. and Chapman, W. L. (2016) A database for depicting Arctic sea ice variations back to 1850. Geographical Review, doi:10.1111/j.1931-0846.2016.12195.x
Posted by Guest Author on Wednesday, 17 August, 2016
 |
The Skeptical Science website by Skeptical Science is licensed under a Creative Commons Attribution 3.0 Unported License. |