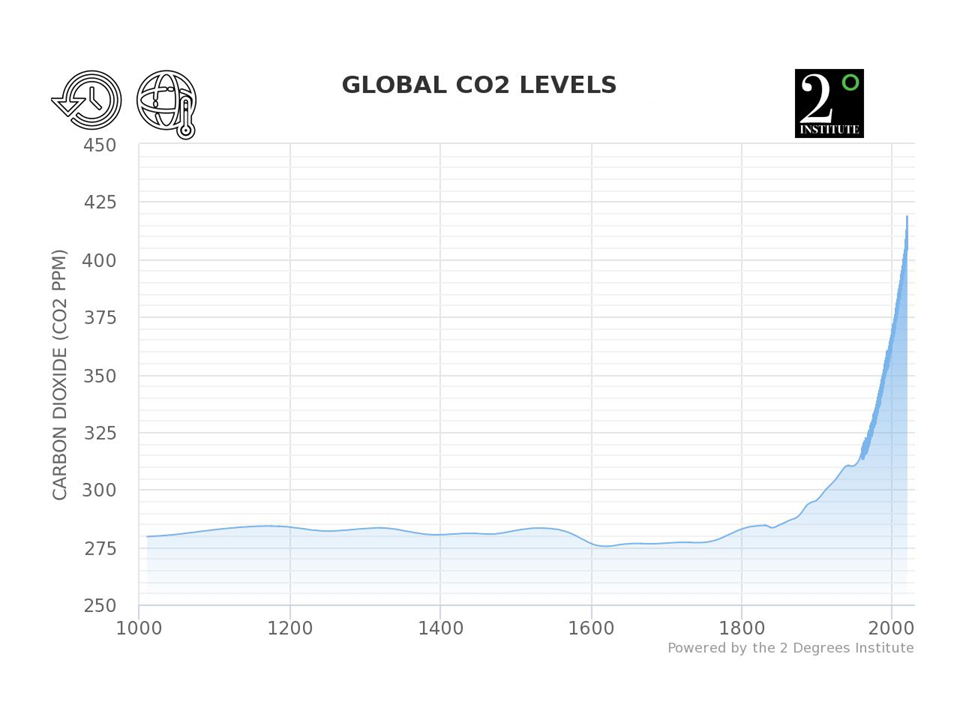
 Figure 1. Atmospheric CO2 estimated from ice-core samples, combined with measurements that started in 1958 (represented by the dark blue line). This graph is available at https://www.co2levels.org/
The question often arises as to how we know that the current year-to-year buildup of CO2 is due to human activities. One way is to do simple bookkeeping of how much of each of the major types of fossil fuels we burn each year, and the predicted CO2 buildup implied by the known yearly combustion rate. Burning fossil fuels produce two major products: CO2 and H2O. As long as we know the carbon and hydrogen content of each of the major types of fossil fuels, it is relatively straightforward to calculate the amount of CO2 released each year. The point of this article is to demonstrate how we do such a calculation, and to demonstrate that such a calculation clearly shows that the measured annual rise of CO2 is due to human activities.
CO2 emissions occur primarily due to burning coal, oil, natural gas, and through deforestation. Because the consumption rates of coal, oil, and natural gas are known, and because other groups monitor the state of forests, it is easy to estimate the CO2 emissions from these sources. Part of the CO2 emitted accumulates in the atmosphere and remains there for centuries to millennia, but part of the CO2 emitted is quickly reabsorbed back into the biosphere (water, soil, and rocks). By using a rough estimate that about 50% of emissions are reabsorbed into the biosphere, it is possible to estimate the atmospheric CO2 accumulation due to human emissions.
Before the Industrial Revolution (which started about 1800 AD) CO2 natural emissions were roughly in balance with CO2 natural sinks, for no net accumulation. This is demonstrated by CO2 estimated from ice-core samples for the period 1000 AD to present, shown in Figure 1. From the dawn of the Industrial Revolution until now atmospheric CO2 concentrations have been steadily increasing. It is easy to show that the atmospheric accumulation of CO2 since the dawn of the Industrial Revolution is due mostly to the burning of fossil fuels, because we know from year to year how much oil, natural gas, coal, and forest trees we are burning, and we know how many molecules are in the atmosphere. Given this data, we can calculate the expected annual increase in CO2 and compare it to the measured annual increase.
CO2 concentrations in Earth’s atmosphere are tracked as the number of CO2 molecules per million molecules [parts per million: ppm]. Figure 1 indicates that 200 years ago this value was about 280 ppm, whereas today it is close to 410 ppm, and from 2005 - 2014 it increased an average of about 2.1 ppm/year. To see that this increase is due primarily to burning fossil fuels and deforestation, we simply divide the number of carbon atoms emitted from Anthropogenic sources by the number of molecules in the atmosphere. It requires a little math, but no computer models.
Figure 1. Atmospheric CO2 estimated from ice-core samples, combined with measurements that started in 1958 (represented by the dark blue line). This graph is available at https://www.co2levels.org/
The information for each carbon source is available in slightly different form, so we have to do calculations to convert from the reported data for each source to kg CO2 emitted from each of the sources. The reported emissions for each are barrels of oil, cubic feet of natural gas, kg of coal, and kg of CO2 for deforestation. In the following table we summarize the consumption for each of these sources and show how to convert each source to annual kg’s of CO2 emitted.
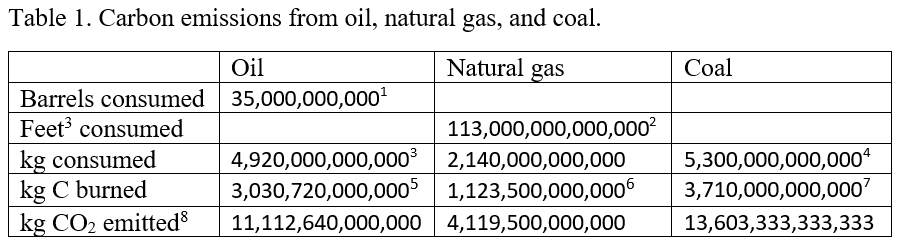
In addition, CO2 emissions from deforestation have been estimated at about 3,000,000,000,000 kg/year.9
These numbers are summarized in Table 2 10 and further manipulated to estimate the annual CO2 increase. In Table 2, Row 1 gives the sum of all CO2 sources from the last line of Table 1, Row 2 shows the weight of a single CO2 molecule, and Row 3 divides the total mass of CO2 emitted by the weight of a single CO2 molecule to estimate the number of CO2 molecules emitted. Because about half of the emitted CO2 is reabsorbed into the biosphere, Row 4 shows the net CO2 remaining in the atmosphere, where we've assumed that about 50% is reabsorbed into the biosphere, leaving 50% in the atmosphere. Row 5 gives the total number of air molecules in Earth’s atmosphere (see Appendix A for methods for calculating this number), and finally Row 6 shows the estimated annual increase of CO2, expressed as ppm CO2. Row 7 shows the measured, average increase from 2005 - 2014.
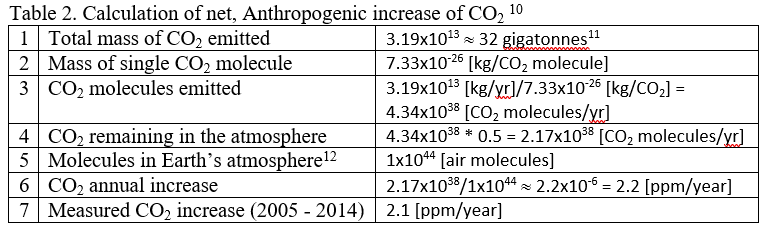
Detailed calculations include other sources, both natural and Anthropogenic, but the purpose of this simple example is to show how the measured increase of 2.1 ppm/year can easily be tracked back to a handful of major sources producing the estimate in Table 2 of 2.2 ppm/year. The point here is not to try to exactly reproduce the measured value, but rather to show that the Anthropogenic contribution is not a mere 0.2 ppm, nor is it 20 ppm, but that the Anthropogenic contribution is very, very close to the measured increase. In short, there is no question that the annual buildup of CO2 in the atmosphere is due to Anthropogenic emissions and is not due to natural sources.
We need to know about how many molecules are in Earth’s atmosphere. There are two ways to calculate this. We either accept a previous calculation of the mass of Earth’s atmosphere as about 5x10¹⁸ kg, together with the weight of an average air molecule of about 5x10-26 kg13 to calculate that there are about 5x10¹⁸/5x10-26 = 1x1044 molecules in the atmosphere, or we can estimate the number of molecules in Earth’s atmosphere by using atmospheric pressure.
To do that, we start with the pressure at sea level, which is about 14.7 pounds/square inch. Or we can express this in MKS units as about 10,400 kg/m2.
Think of this in the following manner. Above each square meter, stretching from the surface of the earth all the way up to space, there are enough molecules being pulled towards earth by gravity to equal a weight of 10,400 kg. Knowing the weight of air and the weight of an average air molecule, we can calculate the number of molecules in this column of air as follows.
Air is about 23% O2 and 77% N2 (we can forget about the contribution of other gases for this approximate calculation). O2 weighs about 5.3x10⁻²⁶ kg/molecule and N2 weighs about 4.6x10⁻²⁶ kg/molecule, for an average weight of air of about 4.8x10⁻²⁶ kg/molecule. This means that in each column of air pushing down on each square meter there are about 10,400/4.8x10-26 = 2.16x1029 molecules/m2.
To determine the total number of molecules in the atmosphere, we need to know the surface area of the earth. Noting that the diameter of the earth is about 12,800 km = 12,800,000 m, from this we can calculate the total surface area, which for a sphere is
Surface area = 3.14159 * diameter * diameter
The surface area of the earth in m2 is, therefore
Surface area of earth = 3.14159 * 12,800,000 * 12,800,000 = 5.1x10¹⁴ m2
We can now determine the total number of molecules in earth’s atmosphere by multiplying the total surface area of the earth times the number of molecules above each square meter as
Molecules in earth’s atmosphere = 2.16x1029 molecules/m2 * 5.1x1014 m2 ≈ 1x1044 molecules.
1. The global daily oil consumption is available here.
2. According to the IEA the global consumption of natural gas is about 113 trillion cubic feet.
3. A barrel of oil weighs about 140 kg.
4. Estimate from the International Energy Agency.
5. About 88% of oil is carbon, and most of the rest is hydrogen. Not all oil consumed is burned. Some is converted to plastics, lubricants, and other products. We assumed that only about 70% of the oil consumed is burned. So we assumed that only about 60% (i.e., 0.88*0.7) of the weight of oil consumed represents C that is burned.
6. About 75% of natural gas is carbon, and most of the rest is hydrogen. Not all of the natural gas is burned. Much of it is used to make plastics. So we assumed that only about 50% (i.e., 0.75*0.7) of the weight of natural gas consumed represents C that is burned.
7. Only about 70% of the weight of coal is carbon.
8. To calculate the weight of CO2 emitted we simply multiply the weight of the carbon burned times the ratio of the weight of CO2 to the weight of carbon (i.e., 44/12).
9. Estimates from https://www.ucsusa.org/global-warming/solutions/stop-deforestation/deforestation-global-warming-carbon-emissions.html
10. In scientific notation a number like 1x106 = 1,000,000 = 1 million. That is, the exponent "6" represents the number of "0's" in a number like 1 million.
11.This is the sum of the four values in the last row of Table 1. Compare this to the more accurate annual estimate of 36 gigatonnes.
12.See Appendix A for how this number is calculated.
13. Air is composed of many types of molecules, each weighing a different amount, but for a mixture of 77% N2, 21% O2, and other trace gases, the average weight of an air molecule is about 5x10-26 kg.
Posted by Evan on Thursday, 20 December, 2018
 |
The Skeptical Science website by Skeptical Science is licensed under a Creative Commons Attribution 3.0 Unported License. |