Former TV weather guy Art Horn has a post up at Pajamas Media about the current La Niña. He mixes some reasonable and accurate observations with several important misconceptions and misstatements about weather, oceanography and climate change.
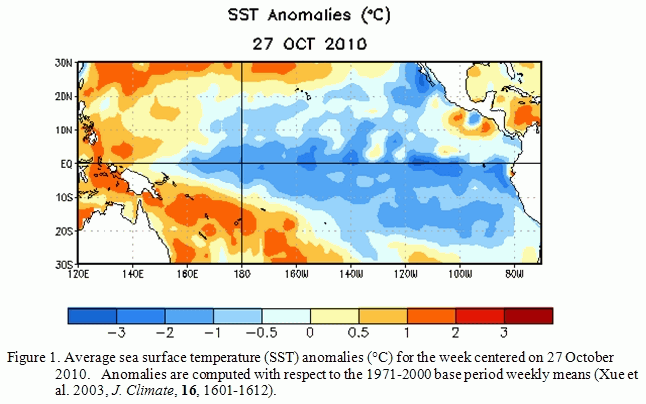
Mr. Horn correctly points out that we are in the midst of a strong La Niña phase of the El Niño Southern Oscillation (ENSO) cycle. We entered the current La Niña when the last El Niño ended in April/May (or a month or so later based on NOAA's Multivariate ENSO Index). As a result, equatorial Pacific Sea Surface Temperatures (SSTs) are currently about 1.4 C cooler than average.

As Art says, the switch from El Niño to La Niña was abrupt, as can be seen in the rapid change from negative to a positive Southern Oscillation Index (SOI):
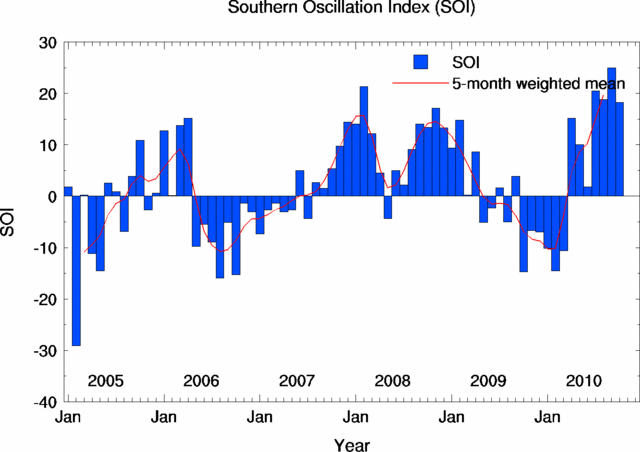
Fig 2. The Southern Oscillation Index (as plotted by the Australian Government Bureau of Meteorology above) is based on the measured air pressure difference between Tahiti and Darwin. Sustained positive values are associated with stronger Pacific trade winds and are indicative of La Niña.
Art then goes on to make a number of errors in his analysis of the relevance of this La Niña, and ENSO in general, for anthropogenic climate change. Although his wording is a bit vague, he seems to suggest that a La Niña can somehow erase anthropogenic heat accumulation:
"strong La Nina events drop the Earth’s average temperature around one degree Fahrenheit" "The most recent La Nina developed in the spring of 2007, and persisted until the early summer of 2008. The global average temperature fell one degree Fahrenheit in that period of time, equal to all of the warming of the last 100 years!"
Two points of correction:
To state the obvious, the ENSO cycle is a primary driver of inter-annual climate variability, particularly global surface temperatures. I think the source of Art's confusion is that he doesn't understand the difference between instantaneous global temperature averages and longer term temperature trends (which is what climate change is all about). As I explained above, the observed cooling during a La Niña does not equal the warming over the last century (it doesn't even equal the warming over the last few decades). But that point is largely immaterial since when this La Niña phase ends, the instantaneous average will go back up to where the long term trend (or running average) lies, i.e., the cooling effect is temporary.
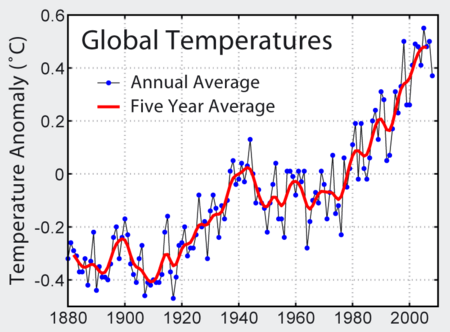
Fig 3. Instrumental record of global average temperatures as compiled by the NASA's Goddard Institute for Space Studies, from Global Warming Art.
Furthermore, this is all just quibbling about terrestrial surface temperatures, when all the action is in the ocean, which are absorbing >90% of the excess heat being retained by the greenhouse gas blanket (Fig 4). Only about 2% of the excess heat is going into warming the surface air.
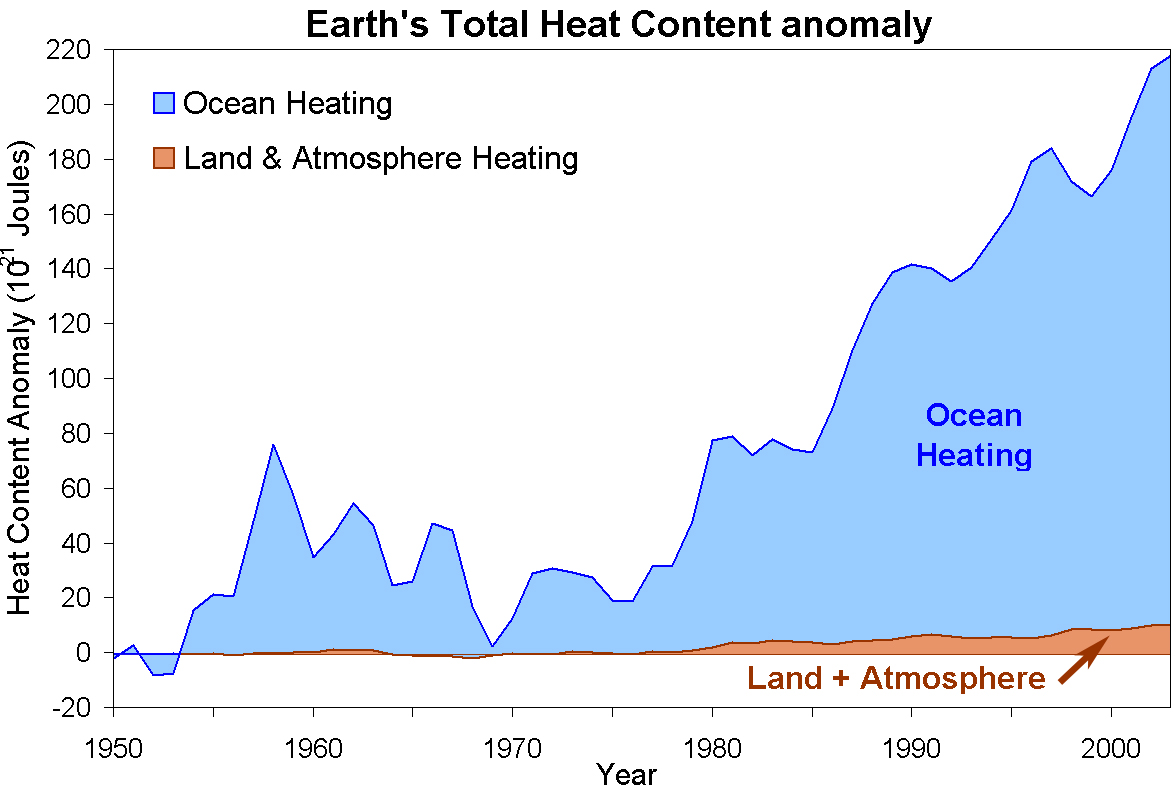
Fig 4. Redrawn by John Cook with data from Murphy et al 2009.
Mr. Horn also states "Many parts of the southern United States had record heat this summer" and "For the last year, the world has been dealing with the warming effects of a strong El Nino." Like the New York Times did in labeling 2010 "an El Niño year", Mr. Horn mistakenly asserts, albeit indirectly, that El Niño has dominated our weather this year. Lets take a look at what the global climate has been doing during the first six months of Art's "super" La Niña. The recent NASA GISS report "2010-How warm was this summer" states:
• June-July-August 2010 was the 4th warmest in the 131 year GISS analysis [for the northern hemisphere it was the second warmest]
• 2010 was a bit cooler than 2009 mainly because a moderate El Niño in the equatorial Pacific Ocean during late 2009 and early 2010 has been replaced by a moderate La Niña
• 8 of the last 10 summers were warmer than the 1951-1980 mean in the United States and Japan, and 10 of 10 in Europe. So if you are perceptive and old enough, you should be able to notice a trend toward warmer seasons.
• The global seasonal temperature anomaly for March-April-May in 2010 was the warmest in the 131 year GISS temperature data set
Furthermore, coral reefs are bleaching worldwide this year due to the anomalously high ocean surface temperatures. The result is extensive coral mortality in the Caribbean and SE Asia over the last two months.
NOAA's Global Climate Analysis for September 2010 states, quite remarkably, that:
"The global average ocean surface temperature for the period January–September was also the second warmest on record, behind 1998"
That is despite the facts that the El Niño that dominated the early months of 2010 was quite mild, the current La Niña is strong and this period of 1998 was warmed by the strongest El Niño of the last 100 years.
There is generally a 2-3 month lag before land surface temperatures respond to changes in ENSO, so it is reasonable to argue that the last El Niño could be in part responsible for the high global temperatures in May-July 2010. However, as Dr. Simon Donnor points out at Maribu, it is highly unlikely that the record breaking global temperatures of 2010 would have occurred in the absence of greenhouse gas emissions. This is especially true given the weakness of the last El Niño and the abruptness of the switch to a strong La Niña. (See the great discussion of this issue in relation to Moscow's 2010 record high summer temperatures on Open Mind here.)
Art Horn: "there has been no net warming or cooling since around 1999. Interestingly, the amount of carbon dioxide in the atmosphere has risen from 369 parts per million to 387 ppm (parts per million) during this time. This amount is above the level of 302 ppm in 1910, when 20th century global temperature started to rise. Despite this significant rise in carbon dioxide since 1999, there has been no “global warming” during this period."
Despite being thoroughly debunked, the "It hasn't warmed since 1998" meme is still alive and well in the denial-o-sphere. This argument is flawed in at least four ways: (1) it isn't true, (2) it is a great example of climate cherry picking, (3) it ignores the well-known role of ENSO in driving year-to-year climate variability and (4) it is a classic straw man fallacy in that it seeks to counter an argument that nobody is making: the (false) expectation of progressive annual warming, i.e., even if true, it wouldn't be relevant to the argument at hand.
Mr. Horn closes with a prediction: "Right now El Nino’s colder sister is on the fast track to generate more temperature extremes and a very cold winter in some parts of the world." At least about this, he is correct (but only partially, e.g., much of the US is actually typically warmer than usual during La Niña, Fig. 5). There will surely be record highs and lows over the next six months and a very cold winter somewhere on earth, possibly due to La Niña.
In fact, I'll up the ante and predict that this will be the case for the next 100 years. Anthropogenic climate change does not mean (or predict) progressive, homogenous warming everywhere. Some places are going have cold winters even a century from now. Cold records will continue to be broken (although with reduced frequency). There will likely be regions that cool, especially if ocean currents are altered, and we could see cool decades. Yet none of that will negate the warming effect of greenhouse gases on the atmosphere and oceans. So keep your PJs on Mr. Horn. A La Niña, no matter how strong, is just a natural cycle that is riding atop of a warming planet, and it certainly cannot erase decades of heat accumulation.
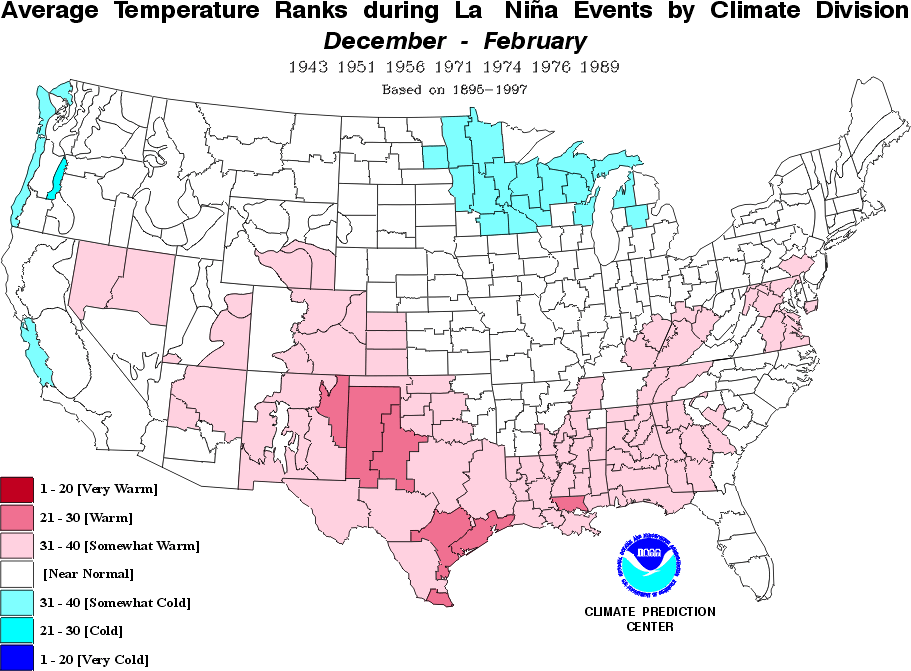
Fig. 5. Seasonal mean temperature trends for the United States during Strong La Niñas.
PS. Take a look at the comments to Art's piece and try to count the number of skeptic arguments. A quick scan revealed "It's freaking cold!" "It's cooling" "Al Gore got it wrong" "It's methane" "It isn't warming" "Warming ended" "It's the sun" "The Medieval warm period and those vikings" and "Ice age predicted in the 70s"
Posted by John Bruno on Monday, 8 November, 2010
 |
The Skeptical Science website by Skeptical Science is licensed under a Creative Commons Attribution 3.0 Unported License. |