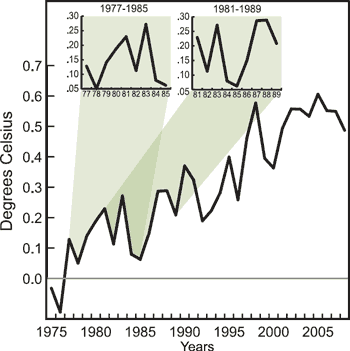
Figure 1: Globally averaged surface air temperature. Two periods with no statistical significant warming trends are 1977 to 1985 and 1981 to 1989.
The most popular skeptic argument in recent times is that global warming has stopped and we're now experiencing global cooling. For example, if we fit a linear trend line to global temperature from 1998 to 2008, we find no statistically significant trend. However, if we fit a trend line from 1999 to 2008, we do find a strong warming trend. It's all too easy to cherry pick start and end dates to reinforce whatever point of view you wish to promote. But what is the most appropriate way to view temperature data?
The paper Is the climate warming or cooling? (Easterling 2009) addresses this question. They examine the long term warming trend from 1975 to 2009 and find a number of periods where there is no statistically significant trend. Eg - 1977 to 1985 or 1981 to 1989 (eyeballing the graph, I might add 1987 to 1996).

Figure 1: Globally averaged surface air temperature. Two periods with no statistical significant warming trends are 1977 to 1985 and 1981 to 1989.
If CO2 is steadily increasing from year to year and CO2 warms the atmosphere, why isn't the atmosphere steadily warming from year to year? The answer is natural climate variability. Effects such as the El Nino/La Nina cycle, volcanic eruptions and solar cycles are all superimposed over the long term warming trend. This is why we've observed several periods of cooling (or no trend at all) amidst the last 30+ years of global warming. Such periods are to be expected.
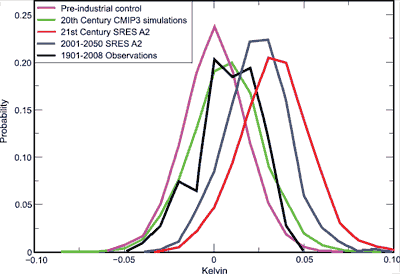
So what is the likelihood of a decade of cooling during global warming? Easterling calculates the probability - both in the observed record and modelled results. The black line in Figure 2 shows the probabilities of various decadal trends in the observed record from 1901 to 2008. As expected, there is a greater chance of positive trends. But there is still a significant chance of a negative or no decadal trend.

Figure 2: Probability distribution functions for decadal trends (kelvin/year) in global air temperature for the observed record (black), pre-industrial control runs (magenta), 20th century simulations (green), and 21st century simulations for the first half of the 21st century (blue) and entire 21st century (red).
For 21st Century model predictions, there is around 5% chance of a negative decadal trend (the red line in Figure 2). This doesn't even take into account volcanic eruptions or solar cycles which also impose several years of short term cooling. In the first half of the 21st Century, the probability increases to 10% (the blue line). In other words, as the warming trend increases this century, cooling periods will occur less often.

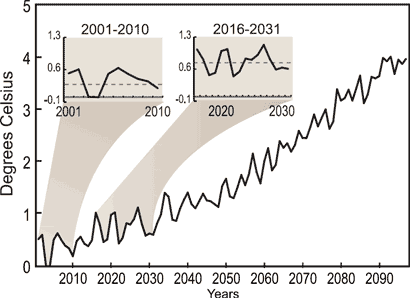
Figure 3: Modelled projections of global temperature (based on the SRES A2 "business as usual" greenhouse gas increase scenario) for the 21st century. Note two periods of statistically insignificant trends in 2001 to 2010 and 2016 to 2031.
So what's the take home from this paper? Climate is variable. This is why climate by definition deals in trends greater than a decade. It is simply not appropriate nor particularly illuminating to draw definite conclusions on where climate is headed based on short term trends. When you read an article stating global warming has ended based on the last 10 years or less, treat the conclusion with much skepticism.
Posted by John Cook on Monday, 20 April, 2009
 |
The Skeptical Science website by Skeptical Science is licensed under a Creative Commons Attribution 3.0 Unported License. |