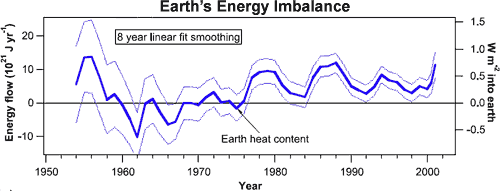
Figure 1: Time history of energy flow into Earth's climate, calculated from the derivative of the Earth's heat content using Domingues 2008 for upper ocean heat (Murphy et al. 2009).
When the Earth is in energy imbalance, with more energy coming in than radiating back out into space, we experience global warming. How do we know if there's an energy imbalance? This can be determined empirically in two ways. Firstly, by using satellites to directly measure the difference between incoming energy from the sun and outgoing radiation from the earth. Secondly, by adding up the energy content of the atmosphere and ocean over time. The newly published paper An observationally based energy balance for the Earth since 1950 (Murphy 2009) does both.
To calculate the Earth's total heat content, the authors took data of ocean heat content from the upper 700 metres. They included heat content from deeper waters down to 3000 metres depth. This is not insignificant - the heat increase in waters deeper than 700 metres is around 40% of the heat increase in waters from 0 to 700 metres. They computed atmospheric heat content using the surface temperature record and the heat capacity of the troposphere. Land and ice heat content were also thrown into the mix.
A time history of the energy going to heat the Earth requires differentiating the heat content. As the heat content data was too noisy for single year differences, successive linear fits were performed to running 8-year segments of data. Eight years was chosen as it's the longest period that still separates the dips due to the El Chichon and Mt. Pinatubo volcanic eruptions. The resultant energy imbalance time series is seen in Figure 1:

Figure 1: Time history of energy flow into Earth's climate, calculated from the derivative of the Earth's heat content using Domingues 2008 for upper ocean heat (Murphy et al. 2009).
We see that since the mid 1970's, the planet has been in positive energy imbalance. This is consistent with satellite measurements which also find more energy coming in than radiating back into space. This energy imbalance is what is causing global warming.
Climate sensitivity is an expression of how much global temperature changes for a given radiative forcing. The general consensus of peer reviewed estimates of climate sensitivity (both modelled and empirically determined) tend to cluster around a global warming of 3 ± 1°C for doubled CO2.
As the ERBE and CERES satellites measure the net energy imbalance, this data can be combined with temperature records to place constraints on climate sensitivity. Because the ERBE satellite record covers only 15 years, it doesn't encompass slower feedback processes such as receding Arctic sea ice. Hence the data provides only a weak upper bound of climate sensitivity (a maximum of around 10°C warming for doubled CO2). However, the analysis rules out climate sensitivities lower than 2°C. This finding is consistent with the general consensus estimate of climate sensitivity (in addition, the author Dan Murphy informs me he's currently doing follow-up work to calculate a more precise lower bound).
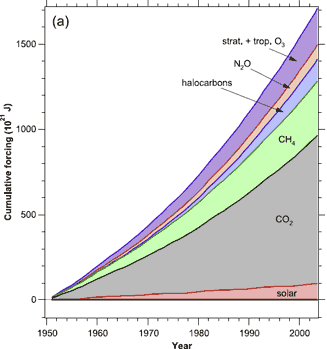
Possibly the most interesting section of the paper (at least to me) is analysing the various contributors to the energy imbalance and where the energy is going. Figure 2 shows the sum of positive, long-term climate forcings.

Figure 2: Cumulative energy budget for the Earth since 1950, showing mostly positive and mostly long-lived forcing agents from 1950 through 2004.
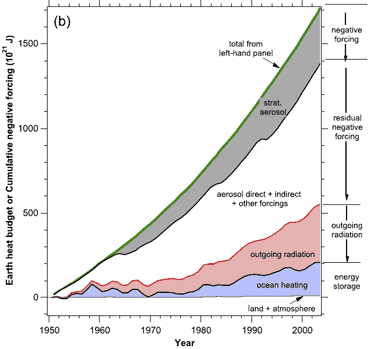
To close the energy budget, the authors also calculated how the positive forcings have been balanced by various negative forcings, as seen in Figure 3. Note that outgoing radiation is on the increase - another indication that the planet is indeed warming and consequently radiating more energy back into space.

Figure 3: Cumulative negative forcings such as stratospheric aerosols, direct and indirect aerosol forcing, increased outgoing radiation from a warming Earth, and the amount remaining to heat the Earth.
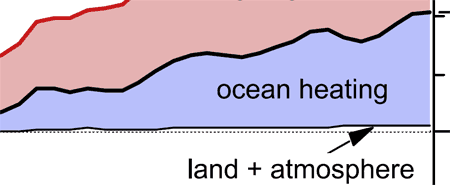
Of particular note is comparing the heat capacities of the land and atmosphere to the heat capacity of the ocean. The land and atmosphere contribution is not even visible in Figure 3 so here is a magnified look at the bottom corner of the graph:

Figure 4: cumulative energy storage of the ocean compared to land + atmosphere.
It's worth remembering that global warming occurs over the entire globe - land, atmosphere and oceans. Consequently, to focus on one very small piece of the puzzle (eg - surface temperatures) while ignoring the larger picture can lead to misguided conclusions.
Internal variability is apparent in the surface temperature record - a measure of atmospheric heat content. This is no surprise from an energy budget point of view. Small changes in heat transfer into or from the ocean into the atmosphere can create significant changes in surface temperature. But when you look at the entire planet's heat content, a clearer picture emerges. The planet is steadily accumulating heat due to its energy imbalance.
Posted by John Cook on Sunday, 20 September, 2009
 |
The Skeptical Science website by Skeptical Science is licensed under a Creative Commons Attribution 3.0 Unported License. |