The Medieval Warm Period (MWP) is a subject of "skeptic" focus, primarily because it was a time of natural warming. It took place from about 950-1250 AD, and, as opposed to today's warming which is global in extent and due to human activities, the MWP was mainly a northern hemisphere phenomenon and smaller in scale. Indeed, the advance of North American glaciers during the MWP is in stark contrast to what is happening in North America today.
Mann (2009) was an analysis of a large set of climate/temperature proxies (ice cores, tree rings, cave mineral deposits, sediments, etc.) covering the MWP. See below:
Figure 1: Reconstructed surface temperature anomaly for Medieval Warm Period (950 to 1250 A.D.), relative to the 1961–1990 reference period. Gray areas indicate regions where adequate temperature data are unavailable.
It's clear from the map that only limited areas of the world were warmer during the MWP than the 1961–1990 reference period, Greenland in particular. Much of the rest of the planet, especially the oceans, were cooler. And take note of the cooler North American west coast, which is consistent with the glacier advance there during the MWP. Obviously, the Earth has continued to warm even further since the 1961–1990 period, so the difference in temperature between the MWP shown in the reconstruction and today is even greater.
The climate proxies suggest a rather different distrubition of heat and rainfall than today. So the question arises: based on the current well-understood climate system, can ocean-atmosphere processes produce temperature patterns like the MWP? For answers we turn to climate models.
The cool central and eastern Pacific suggested by Mann 2009 explain some of planet-wide climate features observed in the MWP, but they fail to explain other aspects, such as as a more positive North Atlantic Oscillation (NAO), and increased rainfall in parts of Asia.
Graham (2010) used the NCAR climate model and, based on findings from other modelling studies and proxy evidence for a warmer Western Pacific Ocean, found that by forcing the simulation to have a slightly warmer Indian and Western Pacific Ocean relative to other ocean basins, the model results match the climate suggested by the proxies.
Below are the comparisons between the climate model control runs (a pre-industrial baseline) and the simulations including a warmer Indian-Western Pacific Ocean, for the northern hemisphere (boreal) winter (figure 2 and 3)
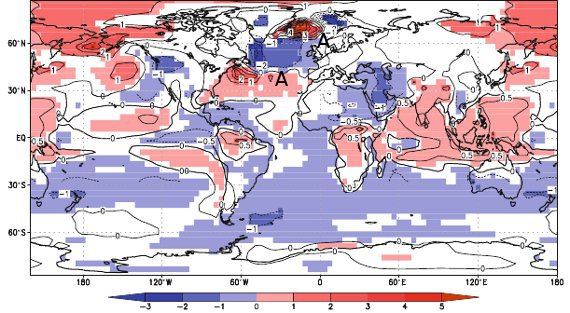
Figure 2: Differences in December–March temperature between the Indian Ocean Warm Pool (25) and control simulations (°C, color; values are Sea surface temperature over ocean and 2-m temperature over land).Lined contour interval is 0.5°C between 30°N and 30°S and 1°C elsewhere. From Graham 2010.
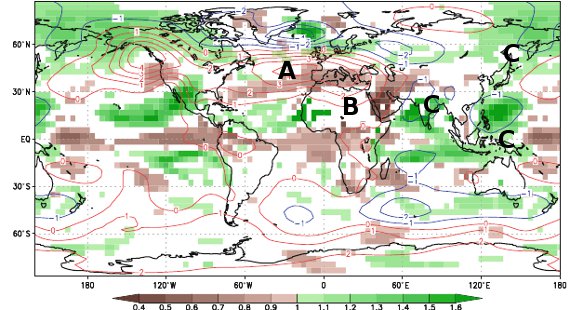
Figure 3: Differences in December–March precipitation (expressed as fraction of Control simulation, color) and Sea level Pressure (difference, hPa) for the Indian Ocean Warm Pool simulation. SLP contour interval is 1.0 hPa except 0.25 hPa in the region 30°S–40°N and 25°E–100°E where the ?ner interval highlights temperature-driven low pressure around continental periphery of northern Indian Ocean. From Graham 2010.
The warm Indian-Western Pacific Ocean, combined with the cool Central and Eastern tropical Pacific reveals a good match with the paleoclimate proxies shown in the Mann 2009 reconstruction, namely:
A mechanism for such warming of the Indian and western Pacific Oceans has not been found, nor do the climate model simulations resolve all the patterns suggested by the proxies (such as warming of the British Isles); however, these findings represent another small step forward in piecing together the puzzle of the MWP, and also support the interpretation of the proxy data in Mann 2009.
The MWP was very unlike warming today; the growing North American glaciers during the MWP being somewhat of a giveaway. The MWP only affected warming in a handful of regions, with Greenland being especially warm (Figure 1), whereas much of the Earth was actually cooler than the late 20th century. By comparison; today virtually every glacier and ice sheet on the planet is in rapid retreat.
Both the climate proxies and the climate models imply that the MWP was a re-organization of the Earth's climate, and that much of this re-organization can be explained by oceanic patterns of warming and cooling, although what started all this rolling in the first place is still unknown.
So while some climate "skeptics" are stuck in a time loop, wilfully reliving their own version of Groundhog Day, science continues to move forward.
Posted by Rob Painting on Sunday, 10 July, 2011
 |
The Skeptical Science website by Skeptical Science is licensed under a Creative Commons Attribution 3.0 Unported License. |