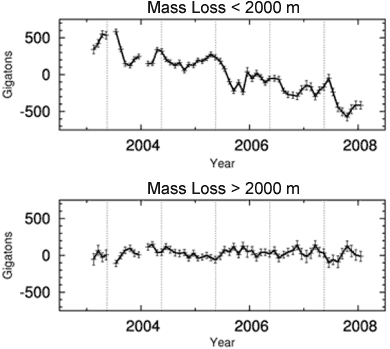
Figure 1. Mass loss from the Greenland ice sheet for coastal regions below 2000 metres (top) and interior regions above 2000 metres (bottom). (Wouters 2008)
In a recent post Accelerating ice loss from Antarctica and Greenland, we saw that ice loss from Greenland has been accelerating sharply over the last 9 years. One commenter suggested 9 years was too short a period. As I'm always harping on about the dangers of focusing on one narrow piece of the puzzle while neglecting the broader picture, perhaps I should practise what I preach. So I've revised the page on Greenland ice trends, adding the latest GRACE satellite measurements but also including long term trends going back to 1958.
Global warming affects Greenland in two ways. Warming temperatures cause the ice sheets to thin and lose ice mass around the edges. On the other hand, warmer temperatures also cause more snow to fall in Greenland's interior. Which has the greater effect? Is Greenland losing or gaining ice?
Over the years, a variety of techniques have been employed to measure Greenland's mass balance. Snow pits are dug to measure snowfall. Stations are set up to measure incoming and reflected sunlight. Aircraft use laser altimetry to measure changes in surface elevation. Melt areas are determined by satellites reflecting microwaves off the surface. Satellite radar interferometry measure the horizontal movements of Greenland's glaciers. In 2003, NASA launched the Ice, Cloud, and Land Elevation Satellite (ICESat), using laser altimetry to more accurately measure changes in the Earth’s surface elevation.
All this data has been pieced together to form a continuous picture of Greenland's mass balance from 1958 to 2007 (Rignot 2008 - H/T to Chris for the heads up). There is robust agreement between the various independent measurements and a clear long term trend is apparent. In the 1960s, the ice sheet was losing 100 gigtonnes of ice per year. In the 1970s-1980s, the rate of ice loss slowed to near mass balance. In 1996, the rate of ice mass loss had increased to 97 gigatonnes per year. In 2007, the ice mass loss increased rapidly to 267 gigatonnes per year. To put this into perspective, a gigatonne is one billion metric tonnes, the mass of a cube of water that is 1 kilometre wide, tall, and deep.
So we see a long term trend of accelerating ice mass loss since the 1970s. This is confirmed by the Gravity Recovery and Climate Experiment (GRACE) satellite, measuring shifts in Earth’s gravity field. The GRACE data offers a complete picture of the entire ice sheet, allowing comparisons of mass changes in coastal regions (eg - elevations below 2000 metres) with the Greenland interior (above 2000 metres). Over the period 2003 to 2008, the coastal regions were observed to be losing ice mass while the interior was in approximate mass balance. The overall result is that the Greenland ice sheet is losing ice mass (Wouters 2008).

Figure 1. Mass loss from the Greenland ice sheet for coastal regions below 2000 metres (top) and interior regions above 2000 metres (bottom). (Wouters 2008)
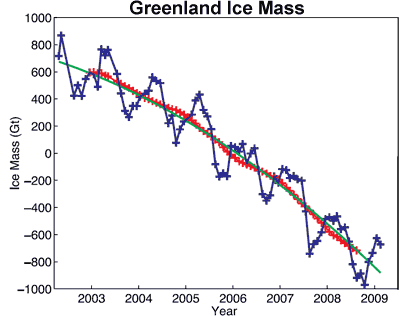
The latest GRACE data reveals more about the long term trend. Figure 2 shows the ice mass changes in Greenland from April 2002 to February 2009 (Velicogna 2009). The blue line/crosses show monthly values of ice mass. The red crosses have seasonal variability removed. The green line is the best fitting quadratic trend. The best fitting trend finds that Greenland ice loss is accelerating at a rate of 30 Gigatonnes/yr2. Greenland's mass loss doubled over the 9 year period.

Figure 2: Time series of ice mass changes for the Greenland ice sheet estimated from GRACE monthly mass solutions for the period from April 2002 to February 2009. Unfiltered data are blue crosses. Data filtered for the seasonal dependence using a 13-month window are shown as red crosses. The best-fitting quadratic trend is shown (green line). (Velicogna 2009)
The long term trend since the 1970s is accelerating ice mass loss. This is confirmed by gravity satellite measurements over the past 9 years which find that the rate of ice mass loss has doubled over the last 9 years. Just as with Antarctica, Greenland's ice sheet contribution to rising sea levels is continuously and rapidly growing.
Posted by John Cook on Wednesday, 11 November, 2009
 |
The Skeptical Science website by Skeptical Science is licensed under a Creative Commons Attribution 3.0 Unported License. |