What The Science Says:
The claim sea level isn’t rising is based on blatantly doctored graphs and conspiracy theories that are contradicted by empirical observational data.
Climate Myth: Sea level is not rising
"Together, these two unaltered [sea level] datasets indicate that global mean sea level trend has remained stable over the entire period 1992-2007, altogether eliminating the apparent 3.2 mm/year rate of sea-level rise arising from the “adjusted” data." (Christopher Monckton)
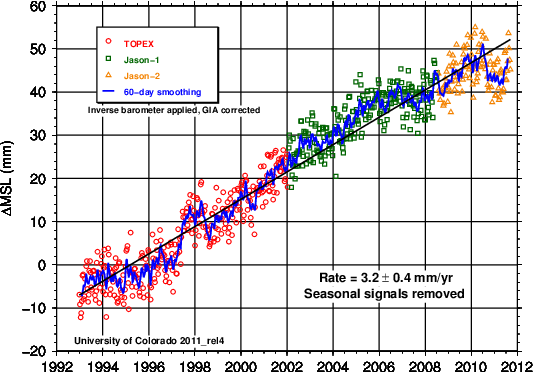
Most claims that sea level is not rising are based on arguments made by Nils-Axel Mörner (i.e. see here). Figure 1 shows the mean global sea level data whose accuracy Mörner denies:
Figure 1: University of Colorado global mean sea level time series (with seasonal signal removed)
Mörner claims that the "true experts" think this data is wrong (emphasis added):
"The world’s true experts on sea level are to be found at the INQUA (International Union for Quaternary Reseach) commission on Sea Level Changes and Coastal Evolution (of which I am a former president), not at the IPCC. Our research is what the climate lobby might call an ‘inconvenient truth’: it shows that sea levels have been oscillating close to the present level for the last three centuries. This is not due to melting glaciers: sea levels are affected by a great many factors, such as the speed at which the earth rotates. They rose in the order of 10 to 11cm between 1850 and 1940, stopped rising or maybe even fell a little until 1970, and have remained roughly flat ever since."
This is quite different from the INQUA official position on climate change, which opens by saying (emphasis added):
Climate change is real
There is now strong evidence that significant global warming is occurring. The evidence comes from direct measurements of rising surface air temperatures and subsurface ocean temperatures and, indirectly, from increases in average global sea levels, retreating glaciers, and changes in many physical and biological systems. It is very likely that most of the observed increase in global temperatures since the mid-twentieth century is due to human-induced increases in greenhouse gas concentrations in the atmosphere (IPCC 2007).
As George Monbiot has documented, INQUA has been trying to dissociate itself from Mörner's views.
Current president of the INQUA commission on Coastal and Marine Processes, Professor Roland Gehrels of the University of Plymouth, says his view do not represent 99% of its members, and the organisation has previously stated that it is "distressed" that Mörner continues to falsely "represent himself in his former capacity."
Tuvalu is among the various individual locations Mörner focuses on in his attempt to distract from global sea level rise. However, it is a rather poor choice, since sea level rise around Tuvalu is faster than the global average (Figure 2).
Figure 2: Map of the Pacific Island region interannual sea level trend (linear variation with time) from the reconstruction 1950-2009. Locations of the 27 tide gauges (black circles and stars) used in the study are superimposed. Stars relate to the 7 tide gauges used in the global reconstruction. Dark areas relate to non-significant trends. From Becker (2011).
So how does Mörner explain the global sea level rise record, in which both satellite altimeters and tide gauges show average global sea level rise on the order of 3 mm per year (Figure 1)? It's all a conspiracy, of course:
"In 2003 the satellite altimetry record was mysteriously tilted upwards to imply a sudden sea level rise rate of 2.3mm per year...This is a scandal that should be called Sealevelgate. As with the Hockey Stick, there is little real-world data to support the upward tilt. It seems that the 2.3mm rise rate has been based on just one tide gauge in Hong Kong"
Obviously this conspiracy theory is utterly absurd, and is easily disproven by simply examining the IPCC Third Assessment Report (TAR) published in 2001, two years before Mörner's accusation of falsified sea level data, which shows an approximately 10 to 15 mm rise in average global sea level from 1993 to 1998 (Figure 3).
Figure 3: Global mean sea level variations (light line) computed from the TOPEX/POSEIDON satellite altimeter data compared with the global averaged sea surface temperature variations (dark line) for 1993 to 1998. The seasonal components have been removed from both time-series. (IPCC TAR Ch. 11)
In short, Mörner's conspiracy theory and accusation of falsified data is complete nonsense. It's also ironic that Mörner accuses others of falsifying data, since he has previously doctored photographs in his own presentations (i.e. see multiple photos of the Maldives 'marker tree' spliced together here and here).
However, even if we disregard the satellite altimetry data and instead examine the tide gauge data that Mörner prefers, his assertions are still clearly false. Church et al. (2011) examined sea level data from both tide gauges (TGs), satellite altimeter data (Sat-Alt), and the estimated contribution to the sea level rise from various sources (Figure 4). The net estimated mean sea level rise from tide gauges and satellites is essentially the same.
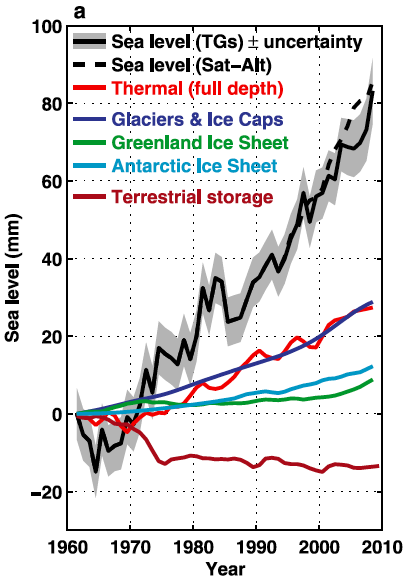
Figure 4: The observed sea level using coastal and island tide gauges (solid black line with grey shading indicating the estimated uncertainty) and using TOPEX/Poseidon/Jason?1&2 satellite altimeter data (dashed black line). The two estimates have been matched at the start of the altimeter record in 1993. Also shown are the various components contributing to sea level rise (Church et al. 2011)
Rather than being flat since 1970, as Mörner claimed in The Spectator article, mean sea level has risen more than 80mm over that period, according to tide gauges. In fact, not only is global mean sea level data rising, but the rise is accelerating.
Highlighting the degree to which his arguments are divorced from reality, in testimony to the British House of Lords, Mörner even presented this laughable graph (which was later reproduced by Monckton and the SPPI), simply rotating Figure 1 to produce "the evidence that sea level is not rising" (Figure 5).
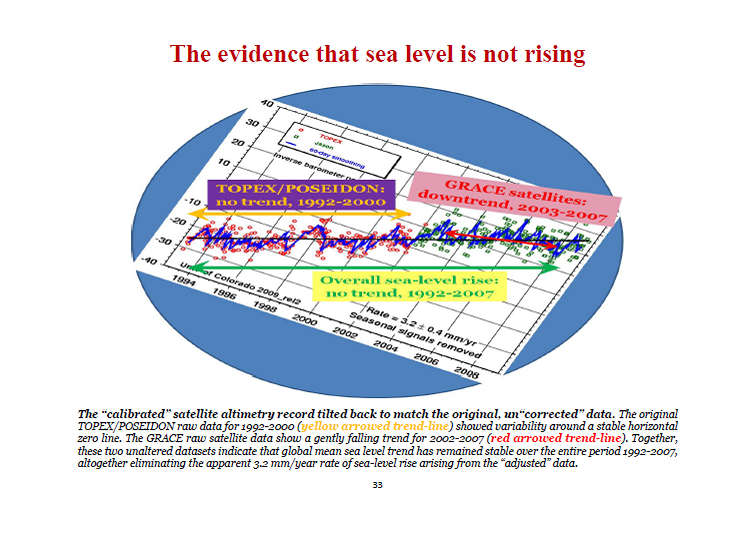
Figure 5: Tilted global sea level data produced by Monckton and Mörner in the SPPI Monthly CO2 Report for January 2011
Nils-Axel Mörner's claims regarding sea level rise are the very definition of denial, involving nothing more than conspiracy theories and unsubstantiated accusations of data falsification wich are easily proven untrue. The mainstream media needs to realize that Mörner is simply not a credible source of information about sea level rise or climate science in general. One individual's unsupported conspiracy theories do not trump empirical observational data.
Intermediate rebuttal written by dana1981
Update July 2015:
Here is a related lecture-video from Denial101x - Making Sense of Climate Science Denial
This rebuttal was updated by Judith Matz on September 13, 2021 to replace broken links. The updates are a result of our call for help published in May 2021.
 |
The Skeptical Science website by Skeptical Science is licensed under a Creative Commons Attribution 3.0 Unported License. |