What The Science Says:
The IPCC report shows that when we account for the warming of the entire climate system, global warming continues at a rapid rate, equivalent to 4 Hiroshima atomic bomb detonations per second.
Climate Myth: IPCC admits global warming has paused
"[The IPCC] recognise the global warming ‘pause’...is real – and concede that their computer models did not predict it. But they cannot explain why world average temperatures have not shown any statistically significant increase since 1997." (David Rose)
Many popular climate myths share the trait of vagueness. For example, consider the argument that climate has changed naturally in the past. Well of course it has, but what does that tell us? It's akin to telling a fire investigator that fires have always happened naturally in the past. That would doubtless earn you a puzzled look from the investigator. Is the implication that because they have occurred naturally in the past, humans can't cause fires or climate change?
The same problem applies to the 'pause' (or 'hiatus' or better yet, 'speed bump') assertion. It's true that the warming of average global surface temperatures has slowed over the past 15 years, but what does that mean? One key piece of information that's usually omitted when discussing this subject is that the overall warming of the entire climate system has continued rapidly over the past 15 years, even faster than the 15 years before that.
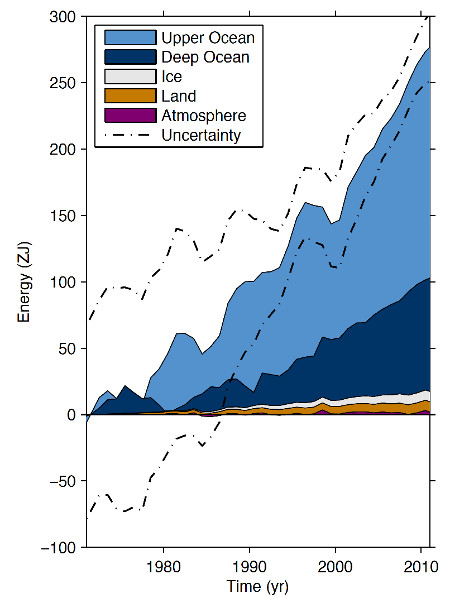
Energy accumulation within distinct components of Earth’s climate system from 1971 to 2010. From the 2013 IPCC report.
The speed bump only applies to surface temperatures, which only represent about 2 percent of the overall warming of the global climate. Can you make out the tiny purple segment at the bottom of the above figure? That's the only part of the climate for which the warming has 'paused'. As the IPCC figure indicates, over 90 percent of global warming goes into heating the oceans, and it continues at a rapid pace, equivalent to 4 Hiroshima atomic bomb detonations per second.
Another important piece of oft-omitted information: while the warming of surface temperatures was relatively slow from 1998 to 2012, it was relatively fast from 1990 through 2006. Over longer time frames, for example from 1990 to 2012, average global surface temperatures have warmed as fast as climate scientists and their models expected.
So what's changed over the past 10 to 15 years? The IPCC attributes the recent slowing of surface temperatures to a combination of external and internal climate factors. For example, solar activity has been relatively low and volcanic activity has been relatively high, causing less solar energy to reach the Earth's surface. At the same time, we're in the midst of cool ocean cycle phases, for example with a preponderance of La Niña events since 1999. A number of recent studies have suggested that most of the recent slowing of surface warming is due to these ocean cycles.
What does that mean for the future? It means more global warming. A number of papers from climate 'skeptics' have sought to fit the surface temperature measurements with various cycles. Some have tried to attribute these changes to astronomical cycles, others to ocean cycles, others to 'stadium waves'. Ultimately these papers are just trying to explain the short-term wiggles in the data. For example, as Marcia Wyatt, lead author of the recent Wyatt & Curry 'stadium waves' paper explained,
"While the results of this study appear to have implications regarding the hiatus in warming, the stadium wave signal does not support or refute anthropogenic global warming. The stadium wave hypothesis seeks to explain the natural multi-decadal component of climate variability."
In other words, the surface temperature speed bump is mainly due to the short-term influences of natural climate variability on top of the long-term human-caused warming trend. As Mark Boslough noted, it all boils down to physics and conservation of energy. We continue to increase the greenhouse effect by burning more and more fossil fuels. The extra energy trapped in the Earth's climate system by that increased greenhouse effect can't just disappear, it has to go somewhere. Right now it just so happens that more is going into the oceans, whereas in the 1990s more was going into the atmosphere.
Some have asked if the 'pause' is real or a result of cherry picking. The answer is that there is a 'pause' if the data are cherry picked. First we have to cherry pick the 2 percent of global warming represented by surface temperatures and ignore the other 98 percent. Then we have to cherry pick a sufficiently short time frame to find a flat trend.
Average of NASA GISS, NOAA NCDC, and HadCRUT4 monthly global surface temperature anomalies from January 1970 through November 2012 (green) with linear trends applied to the time frames Jan '70 - Oct '77, Apr '77 - Dec '86, Sep '87 - Nov '96, Jun '97 - Dec '02, and Nov '02 - Nov '12.
Despite this double cherry picking, ignoring 98 percent of global warming, and despite the sun and volcanoes and ocean cycles all acting in the cooling direction over the past decade, the best climate contrarians can do is find a flat 10-year surface temperature trend. Can you guess what's going to happen the next time the oceans shift to a warm cycle? That's the thing about cycles – they're cyclical.
Intermediate rebuttal written by dana1981
Update July 2015:
Here is a related lecture-video from Denial101x - Making Sense of Climate Science Denial
 |
The Skeptical Science website by Skeptical Science is licensed under a Creative Commons Attribution 3.0 Unported License. |