What The Science Says:
Satellites don't measure temperatures, and the uncertainty in the trend is five times as large as that in the global surface temperature record.
Climate Myth: Satellite record is more reliable than thermometers
"The satellite data are the best data we have."
Ted Cruz
Satellites don't measure temperature. As Carl Mears of the Remote Sensing Systems (RSS) satellite dataset and Ben Santer wrote,
they are not thermometers in space. The satellite [temperature] data ... were obtained from so-called Microwave Sounding Units (MSUs), which measure the microwave emissions of oxygen molecules from broad atmospheric layers. Converting this information to estimates of temperature trends has substantial uncertainties.
Scientists process the MSU data, applying a model to make numerous adjustments, in order to come up with a synthetic estimate of the atmospheric temperature.
As Andrew Dessler describes in the video below by Peter Sinclair, MSUs and advanced MSUs (AMSUs) measure voltages on detectors, which themselves are detecting microwave signals emitted by oxygen molecules in the Earth's atmosphere that change proportionally to temperature changes. To translate these microwave detections into estimates of the temperature of various layers of the Earth's atmosphere requires a model and a lot of data processing and adjustments.
Converting those MSU microwave detections into a reliable long-term synthetic atmospheric temperature record is a challenging proposition, made all the more difficult by a number of confounding factors. For example, the satellites themselves have a limited life span. The overall satellite MSU record is comprised of data from numerous satellites, and each has a different calibration, orbit, etc. that must be accounted for. During that life span, the satellites also experience friction, which causes their orbits to drift. If not correctly taken into account, these factors can create a bias in the synthetic temperature record.
Another issue is that the MSU detections can be influenced by factors besides just oxygen microwave signals, for example, cloud liquid water. Weng et al. (2014) found that the MSU channel (Channel 3) that focuses on the lowest level of the atmosphere (the lower troposphere) is most influenced by the presence of cloud liquid water. Weng et al. suggest,
the global mean temperature in the low and middle troposphere has a larger warming rate (about 20–30% higher) when the cloud-affected radiances are removed from AMSU-A data.
Roy Spencer who, with John Christy, runs the University of Alabama at Huntsville (UAH) satellite synthetic temperature dataset disagrees, believing that the cloud-caused bias is insignificant. The magnitude of this bias in the satellite data remains an unresolved question.
Another issue related to changes in the satellites' orbits is called 'diurnal drift'. The satellites are in 'sun synchronous orbits' and are meant to stay aligned with the sun so that they always cross the equator at the same time. If they don’t, then the normal daily temperature cycles below will start to add a false bias to the data. The UAH team tried to get around this bias in version 5 of their dataset by attempting to use these satellites during periods when the diurnal drift is small, while other groups (RSS and NOAA) apply a correction based on the diurnal drift in a global climate model. Po-Chedley et al. (2015) argue that the UAH method creates a cool bias in their dataset.
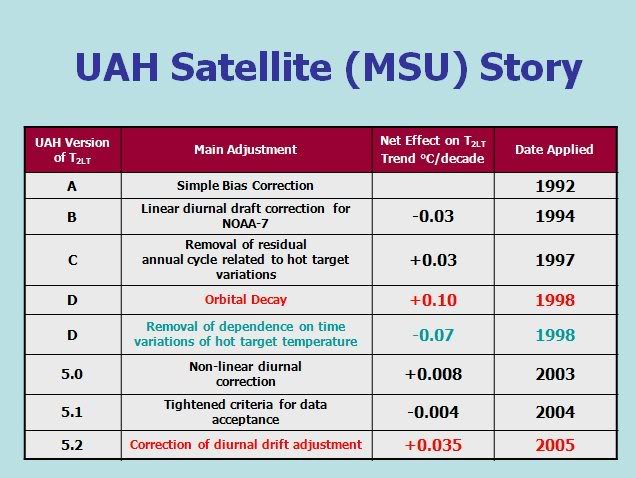
There are still further challenges, for example the fact that the increased greenhouse effect cools the stratosphere, which is the layer of the atmosphere above the troposphere. If microwave measurements from the stratosphere bleed into estimates of tropospheric temperatures, that can also cause a cool bias in the trend. The UAH dataset has required a number of significant adjustments since its inception to correct for these sorts of factors.
The figure below shows all the processing required to get from voltage measurements on an MSU sensor for the Remote Sensing Systems (RSS) group to an estimate of the temperature in the atmosphere.
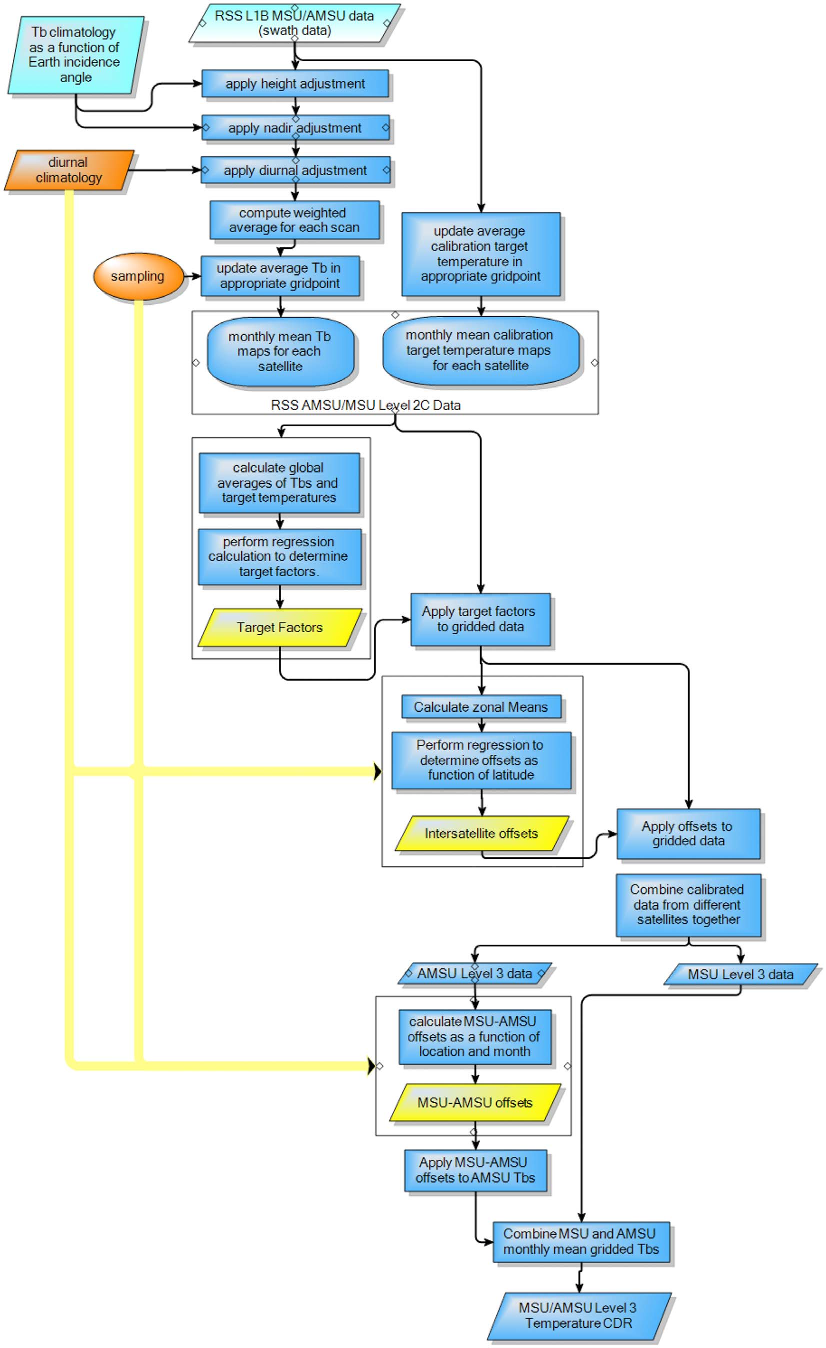
Flowchart of the processing algorithm for the RSS satellite data, from Mears et al. (2011)
As a result, the uncertainty in the satellite data is larger than that in the surface temperature record, which is based on direct measurements by thermometers. In particular, estimated satellite trend observational uncertainty is five times greater.
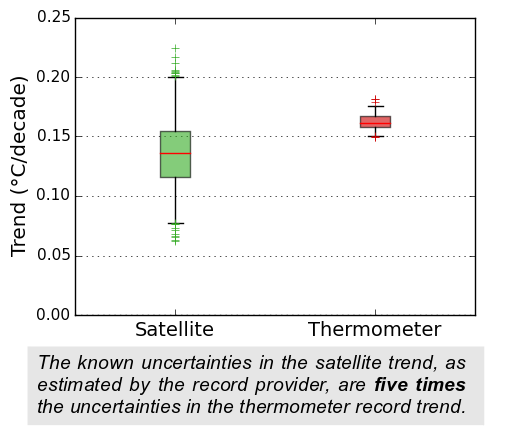
Uncertainty in the temperature satellite and surface temperature trends, estimated from the RSS and HadCRUT4 ensembles. The boxes show the mean and interquartile range of the trends on 1979-2012 in each ensemble. Whiskers indicate the 95% interval (2.5%-97.5%). Crosses indicate outliers. Created by Kevin Cowtan.
on the basis of the best understanding of the record providers themselves, the surface temperature record appears to be the better source of trend information. The satellite record is valuable for its uniform geographical coverage and ability to measure different levels in the atmosphere, but it is not our best source of data concerning temperature change at the surface.
The UAH and RSS groups aren't the only ones trying to estimate the temperature of the atmosphere. We also have direct measurements made by temperature sensors on weather balloons, for example. These are generally in good agreement with the MSU lower atmosphere temperature estimates, until recent years. Since the turn of the century, the UAH and RSS datasets show little warming of lower tropospheric temperatures, while weather balloons show continued warming. For example, Sherwood et al. (2015) concluded that the weather balloon data "contradicts suggestions that atmospheric warming has slowed in recent decades or that it has not kept up with that at the surface."
Similarly, a weather balloon dataset from NOAA called RATPAC shows a growing divergence from the satellite lower troposphere temperature estimates over the past several years.
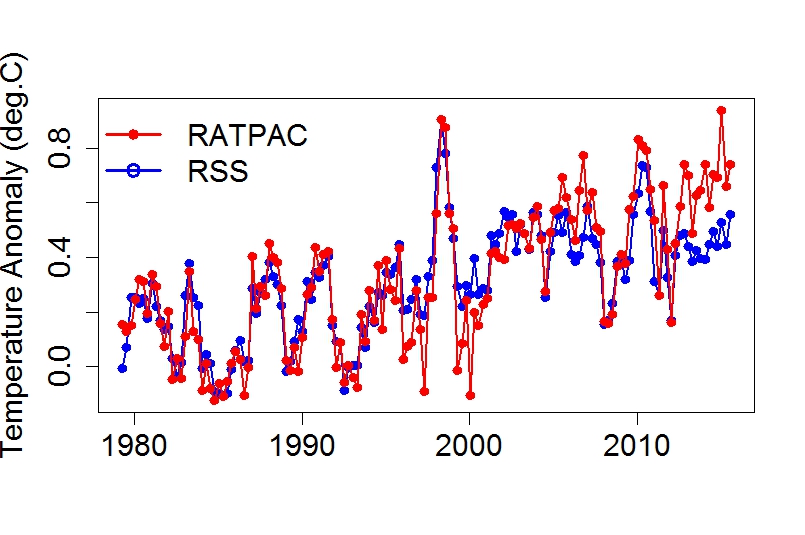
RATPAC vs. RSS lower troposphere temperature estimates. Figure created by Tamino.
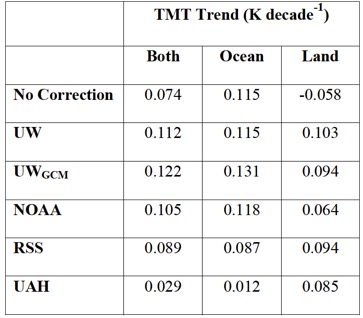
There are also other groups besides UAH and RSS that have used the MSU data to create their own lower and mid-troposphere temperature estimates, and these different estimates show quite a lot of variation. These groups are all using the same raw MSU and AMSU data, and arrive at very different final estimates of atmospheric temperatures and trends.
As Carl Mears of RSS has said,
I consider [surface temperature datasets] to be more reliable than satellite datasets (they certainly agree with each other better than the various satellite datasets do!).
Tropical mid-troposphere temperature satellite trend estimates from different groups using different diurnal drift correction approaches. From Po-Chedley et al. (2014).
This particular myth deals with the claim that the satellite data are "the best data we have" for measuring global warming. What's "best" is a subjective judgment call, but if the goal is to have greater certainty about the data and trends, the surface temperature record is "better" than the satellite data.
Additionally, only about 2% of the global energy imbalance goes into warming the atmosphere. Over 90% goes into warming the oceans, so if the goal is to best measure the overall warming of the Earth, ocean heat content data would be "the best" single source.
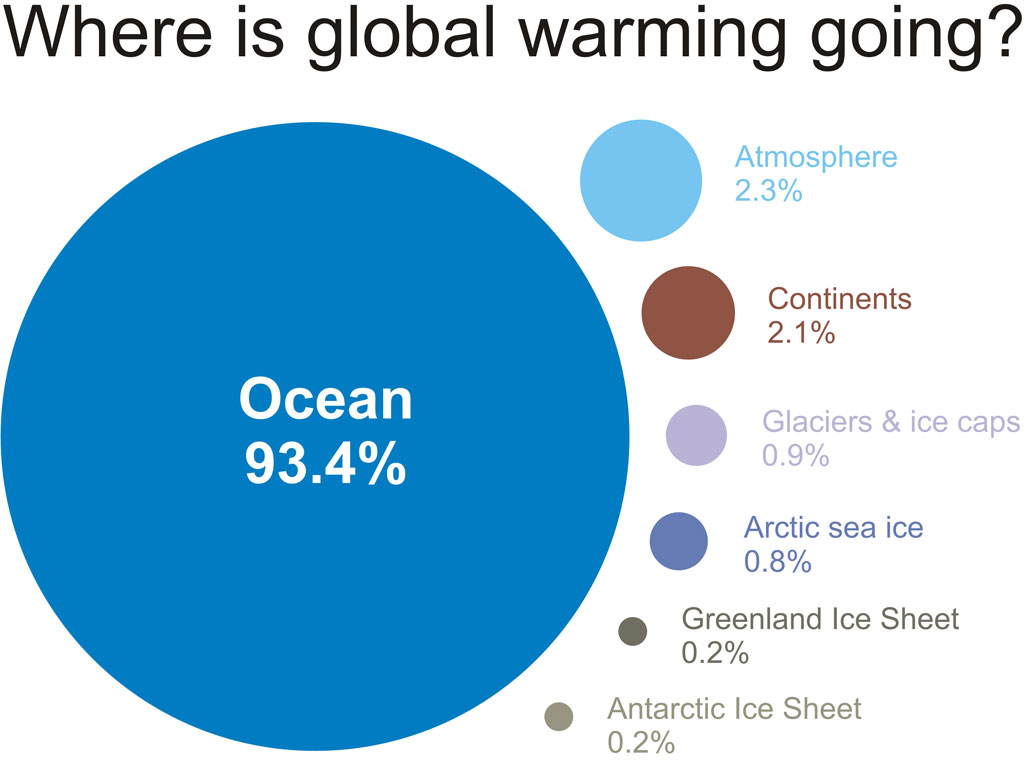
A visual depiction of how much global warming heat is going into the various components of the climate system for the period 1993 to 2003, calculated from IPCC AR4 5.2.2.3.
Another consideration is that humans live on the surface, not kilometers up in the atmosphere. The surface temperature record measures temperature changes where we live, which is arguably the most relevant in terms of effects on human society. By that standard, the surface temperature record would be "the best."
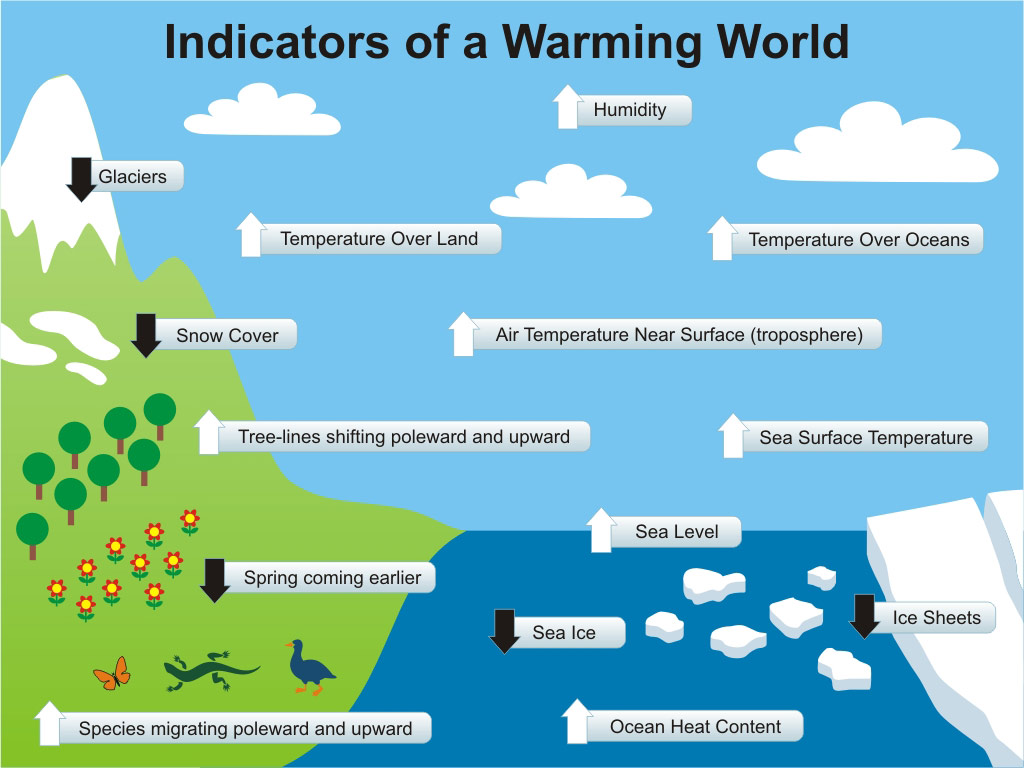
As Carl Mears of RSS noted toward the end of the video above, what we should really do, rather than trying to decide which piece of data is "best," is to consider all the data. That includes the temperature of the atmosphere, surface, and oceans, melting ice, rising oceans, shifting ecosystems, and so on. These paint a clear picture of what's happening with the Earth's climate – it's warming and changing fast.
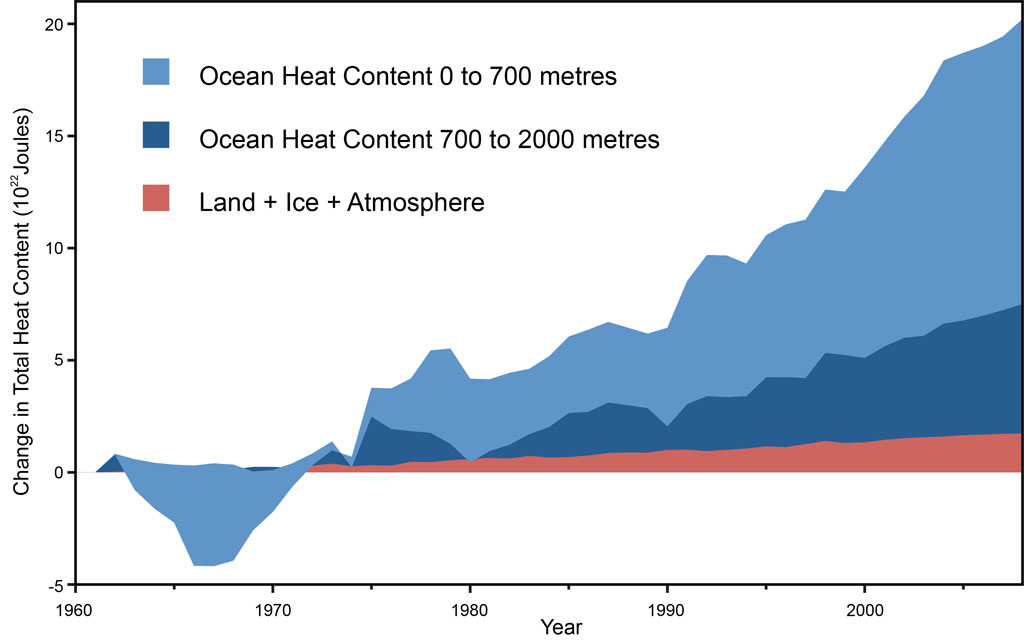
Global heat content data, from Nuccitelli et al. (2012).
The distinguishing feature of the satellite data is that it shows relatively little warming of the lower atmosphere in recent years. But given the fact that all other related datasets disagree, and given the large uncertainties in the satellite data, that may be more of a bug than an accurate feature.
 |
The Skeptical Science website by Skeptical Science is licensed under a Creative Commons Attribution 3.0 Unported License. |