


 Arguments


CFCs contribute only a fraction of global warming
What the science says...
| Select a level... |
 Basic
Basic
|
 Intermediate
|
 Advanced
| ||||
|
Models and direct observations find that CFCs only contribute a fraction of the warming supplied by other greenhouse gases. |
|||||||
Climate Myth...
It's CFCs
"The observed data show that CFCs conspiring with cosmic rays most likely caused both the Antarctic ozone hole and global warming... The total amount of CFCs, ozone-depleting molecules that are well-known greenhouse gases, has decreased around 2000. Correspondingly, the global surface temperature has also dropped." (Qing-Bin Lu)
A paper published in an obscure physics journal by the University of Waterloo's Qing-Bin Lu (2013) has drawn quite a bit of media attention for blaming global warming not on carbon dioxide, but rather on chlorofluorocarbons (CFCs, which are also greenhouse gases). However, there are numerous fundamental flaws in the paper, which is based almost entirely on correlation (not causation) and curve fitting exercises.
Lu's hypothesis was disproven very simply by Nuccitelli et al. (2014). Lu argues that the radiative forcing (global energy imbalance) from CFCs matches global surface temperatures better than that from CO2 over the past decade. This is because as a result of the Montreal Protocol, CFC emissions (and emissions of hydrofluorocarbons, which replaced CFCs) have been flat over the past decade, and global surface air temperatures have also been essentially flat during that short timeframe, while CO2 emissions have continued to rise.
However, a global energy imbalance doesn't just impact surface temperatures. In fact, only about 2% of global warming is used in heating the atmosphere, while about 90% heats the oceans. Over the past decade, ocean and overall global heating have continued to rise rapidly, accumulating the equivalent of about 4 Hiroshima atomic bomb detonations per second (Figure 1).
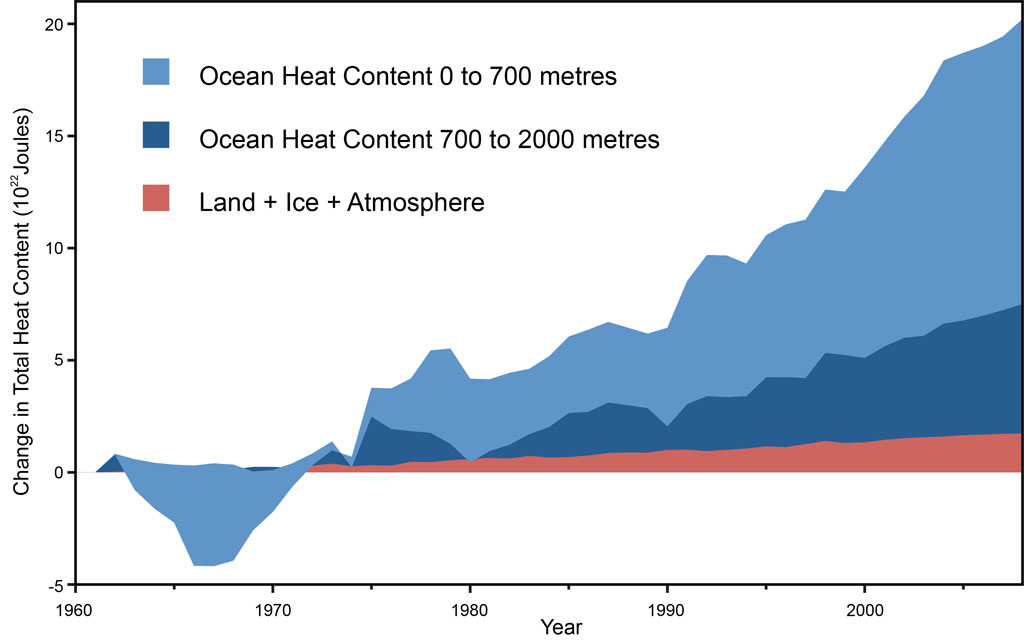
Figure 1: Land, atmosphere, and ice heating (red), 0-700 meter OHC increase (light blue), 700-2,000 meter OHC increase (dark blue). From Nuccitelli et al. (2012).
But let's dig into the details of the paper to see how Lu built his case and where he went wrong.
Unphysical Curve Fitting, Misrepresenting Cited Research, and Circular Logic
Here at Skeptical Science we have previously examined several cases of curve fitting. This describes the practice of scaling several variables without any sort of realistic physical constraint until the model closely matches the observational data, and then declaring that you've proven that those variables caused the changes in the observations. Loehle and Scafetta used this strategy to blame global warming on astronomical cycles, and Roy Spencer used it to blame global warming on ocean cycles.
In this paper, Lu used curve fitting to blame global warming on a combination of solar activity and CFCs. First he randomly scaled a total solar irradiance (TSI) reconstruction to match the surface temperature record as closely as possible. He claimed that this practice was justified by Solanki and Krivova (2003). Lu says:
"...it can be seen that the global temperature indeed closely followed the TSI variation up to 1970; the y-axis for TSI can be scaled so that the magnitudes of the temperature and TSI variations are similar during 1850-1970. This was actually shown previously by Hoyt and Schatten50 and Solanki and Krivova52, and an excellent linear correlation with coefficients of 0.83~0.97 between the TSI and the temperature was obtained.52 This implies that the TSI values can be converted into temperatures using the linear correlation.52 The observed data indicate that the solar effect played the dominant role in climate change prior to 1970."
"We have shown that even in the extreme case that solar variability caused all the global climate change prior to 1970, it cannot have been responsible for more than 50% of the strong global temperature rise since 1970 through any of the channels considered here. We believe that even this fraction is too high."
There is a proportional relationship between changes in TSI and changes in surface temperatures, but it's a physical relationship. You can't just choose whatever proportionality is convenient for your argument. In fact what Lu has done is assume that TSI explains most pre-1970 global surface warming, and then claim that he's proven this is the case. It's circular logic, like fixing a card game and then claiming you're a great card player when you win.
The only reason Lu's TSI model matches the surface temperature data is because he forced it to match through curve fitting – by refusing to apply any physical constraints to his model. Then when his unphysical model fits the temperature data reasonably closely, he declares that he's shown "that the solar effect played the dominant role in climate change prior to 1970." In reality he's shown no such thing, he's simply assumed that his conclusion is true.
Lu also uses a solar reconstruction from Hoyt and Schatten (1993) in his curve fitting exercise. Why use the results of 20-year-old study? Perhaps because it helps Lu arrive at his end conclusion that global warming isn't due to CO2. The Hoyt and Schatten paper claims that the equilibrium climate sensitivity to doubled CO2 is a mere 0.19°C – a factor of 15 lower than today's best estimates.
Perhaps the gold standard of TSI reconstructions comes from Wang, Lean, and Sheeley (2005), updated by Kopp and Lean (2011), whose data are available here. They estimate that the increase in the amount of solar radiation reaching Earth from 1860 to 1970 was not very large (a radiative forcing of less than 0.2 Watts per square meter, compared to the 1.7 Watts per square meter CO2 forcing from pre-industrial times to Present), and only sufficient to account for approximately 0.07–0.15°C average global surface warming. Thus TSI can probably only account for less than half of the observed 0.3–0.4°C surface warming during that time, contrary to the 100% solar attribution Lu claims based on his curve fitting exercise.
Yet More Circular Unphysical Arguments, Curve Fitting, and Misrepresentation of Cited Research
Lu faced the conundrum of having to explain how the increased greenhouse effect from CFCs can cause global warming while the much larger increased greenhouse effect from rising CO2 can't. To accomplish this, he used what the climate scientists at RealClimate have described as the saturated gassy argument – claiming that increased CO2 can't cause more warming because there is already so much in the atmosphere that its greenhouse effect has become saturated. However, as the climate scientists at RealClimate (and we at Skeptical Science) have explained, that argument is quite clearly wrong – disproven by observational data.
Perhaps worse, Lu claimed that a paper by Anderson et al. (2004) supported his saturated gassy argument, claiming the CO2 absorption band is missing from the observed spectrum data. On the contrary, Anderson et al. concluded,
"The spectra in Fig. 8a are the result of a superposition of two different effects. First, there is an increase of greenhouse gases from 1970 to 1996 that gives rise to recognizable bands in the observed spectrum..."
And once again, Lu tried to demonstrate that CFCs can account for the recent global surface warming through unphysical curve fitting, multiplying the CFC forcing by whatever value allowed the CFC data to best fit the temperature data. When using physical constraints, CFCs (included in "halocarbons" in Figure 2) can account for only about 20% as much warming as CO2.
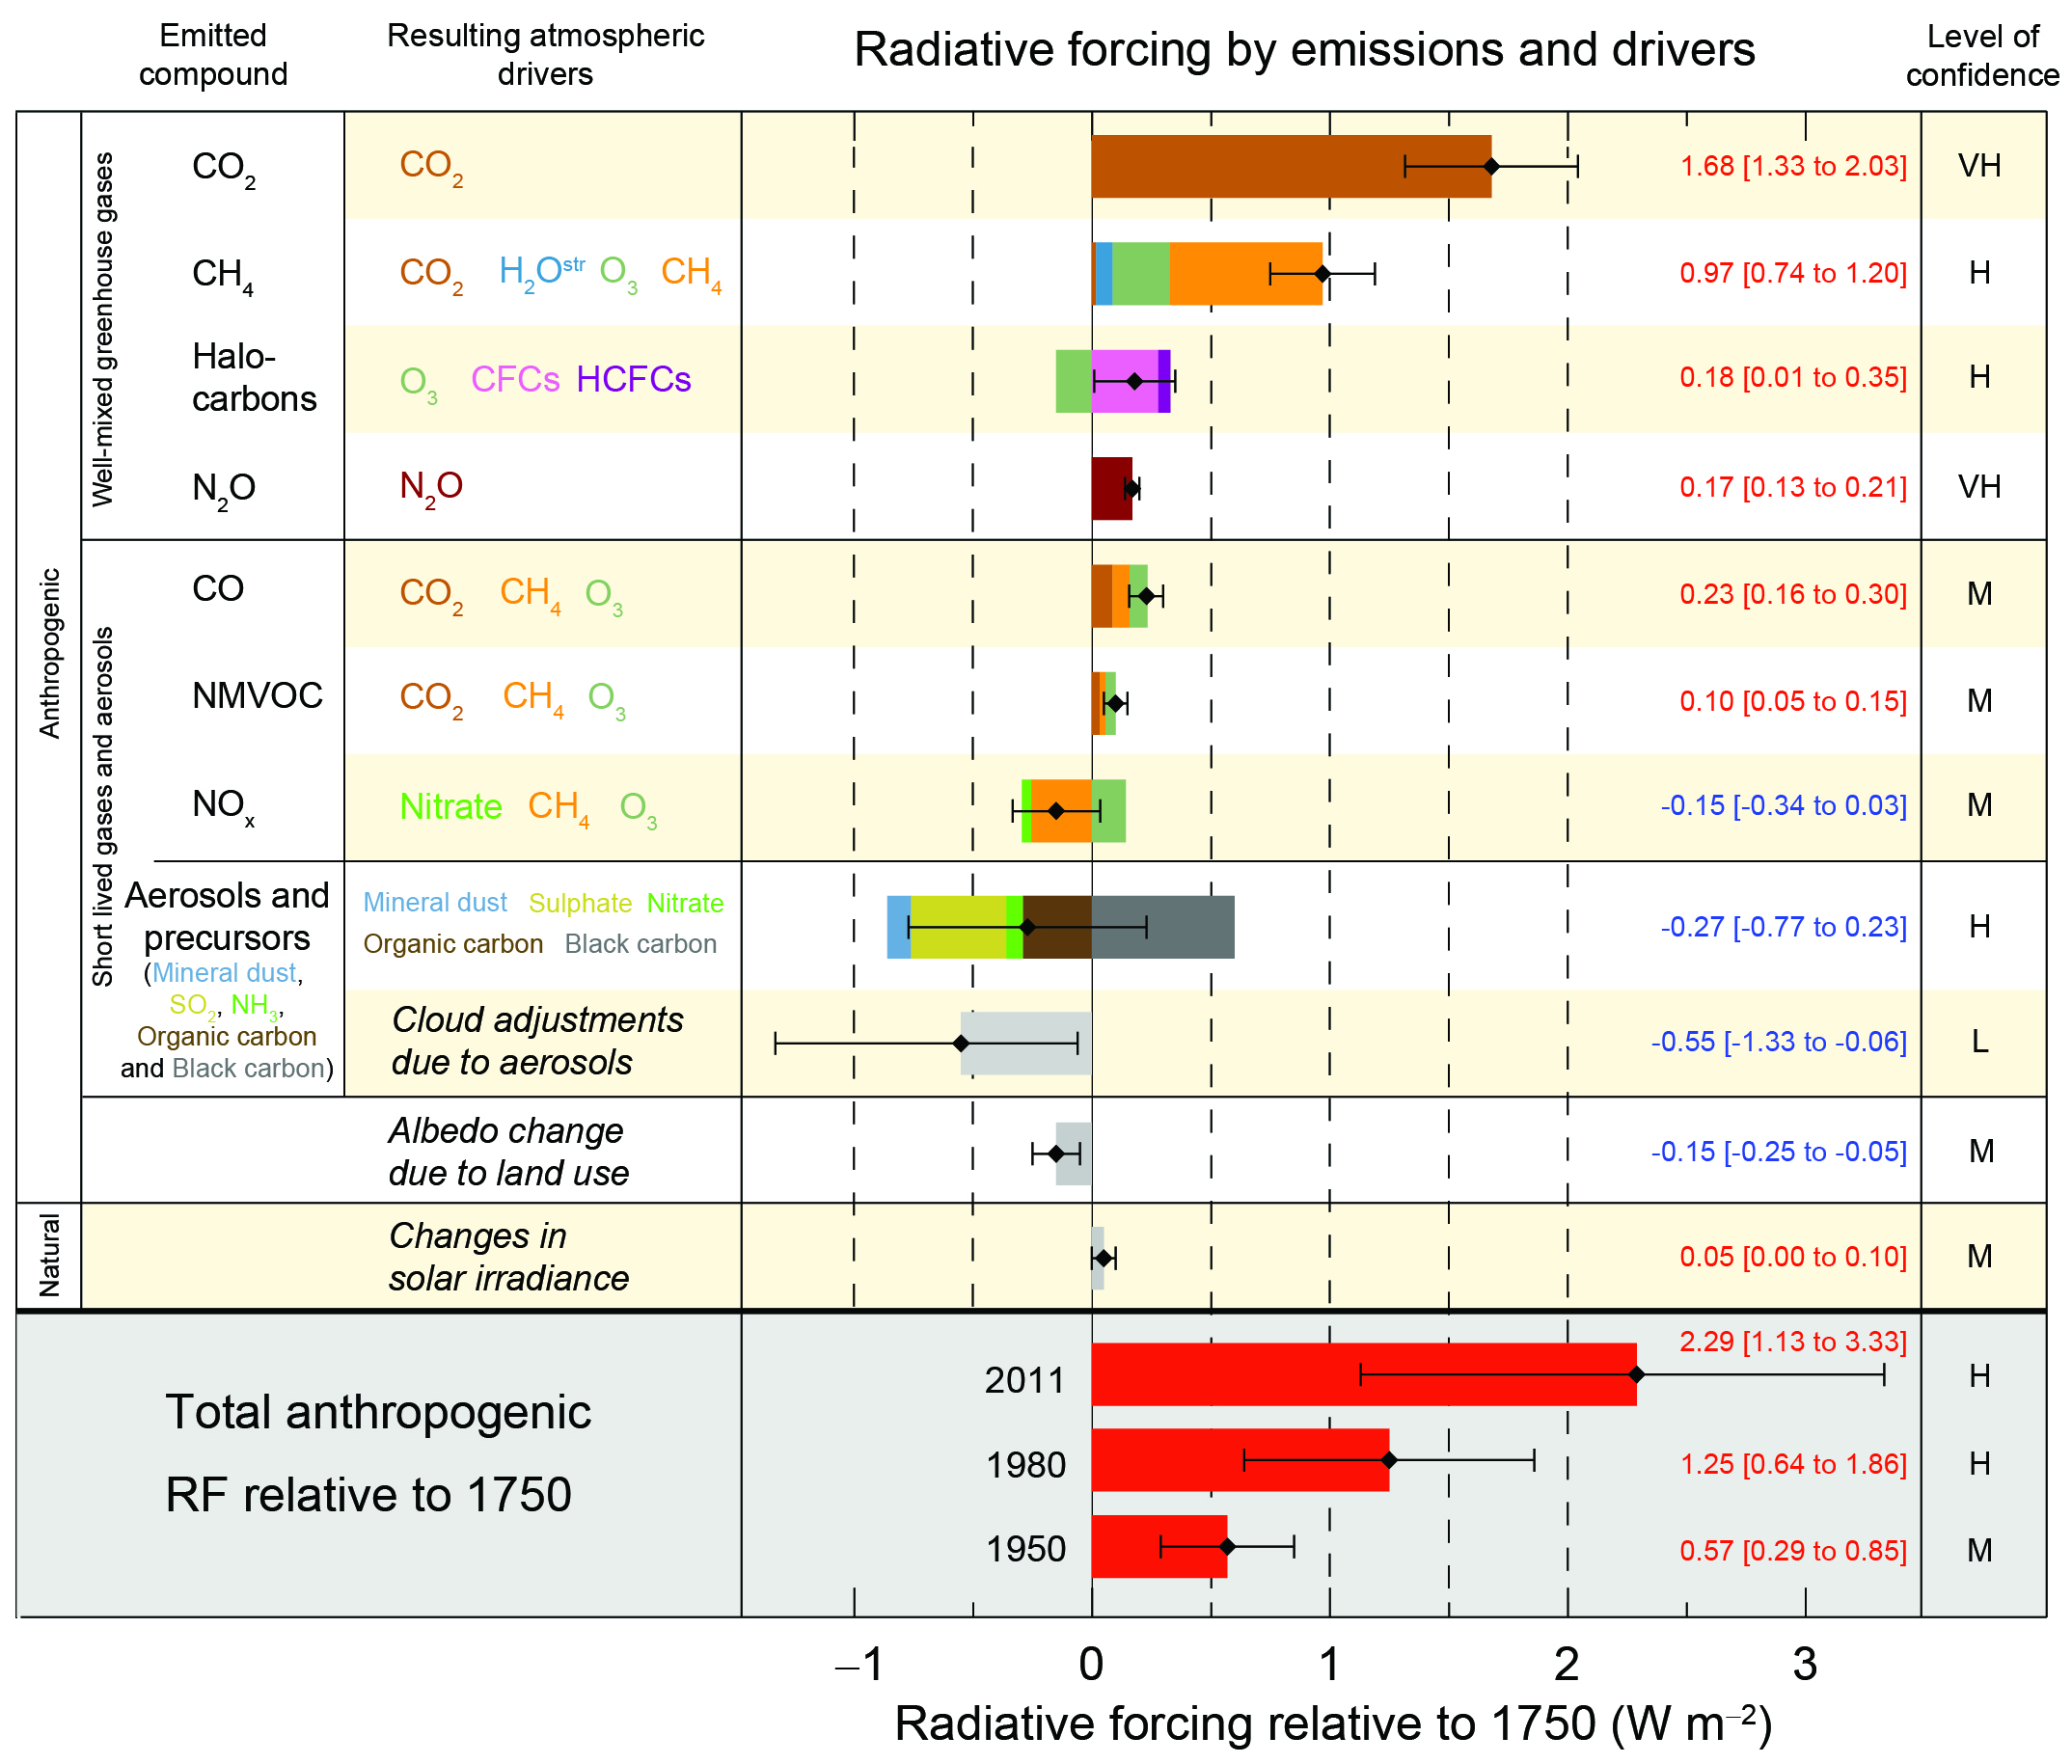
Figure 2: Radiative forcing estimates in 2011 relative to 1750 and aggregated uncertainties for the main drivers of climate change. Values are global average radiative forcing (RF14), partitioned according to the emitted compounds or processes that result in a combination of drivers. The best estimates of the net radiative forcing are shown as black diamonds with corresponding uncertainty intervals; the numerical values are provided on the right of the figure, together with the confidence level in the net forcing (VH – very high, H – high, M – medium, L – low, VL – very low). Albedo forcing due to black carbon on snow and ice is included in the black carbon aerosol bar. Small forcings due to contrails (0.05 W m–2, including contrail induced cirrus), and HFCs, PFCs and SF6 (total 0.03 W m–2) are not shown. Concentration-based RFs for gases can be obtained by summing the like-coloured bars. Volcanic forcing is not included as its episodic nature makes is difficult to compare to other forcing mechanisms. Total anthropogenic radiative forcing is provided for three different years relative to 1750. For further technical details, including uncertainty ranges associated with individual components and processes, see the Technical Summary Supplementary Material. {8.5; Figures 8.14–8.18; Figures TS.6 and TS.7}. From the 2013 IPCC AR5 SPM, page 14.
In his Figure 11, Lu also exaggerates the difference between expected CO2-caused warming and observed temperatures by plotting the observational data against the surface warming we expect at equilibrium. This is wrong because there is a global energy imbalance, which means there is more warming "in the pipeline" for several decades to come before we reach that equilibrium state. In reality the Earth has warmed as expected from the increased CO2 greenhouse effect.
In Nuccitelli et al. (2014), we also found that even ignoring the unphysical "curve fitting" in his model, models using current known human climate forcings produced a more accurate fit to up-to-date surface temperature measurements (HadCRUT4) than Lu's model (r2 of 0.81 vs. 0.72).
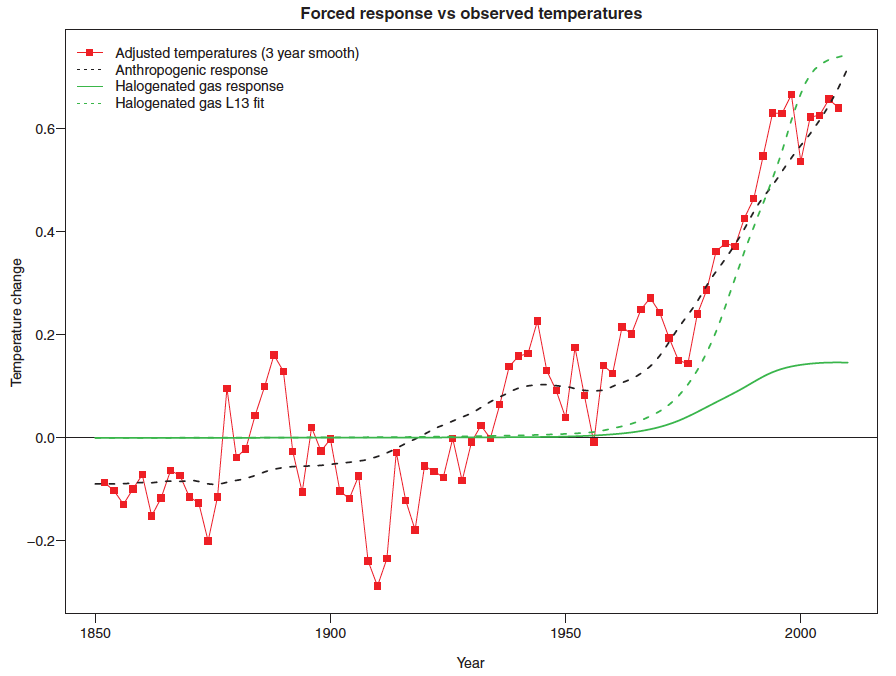
Replication of Lu (2013) Figure 12 using more recent data and a realistic response function. The fit between the anthropogenic forced response (black dashed line) and adjusted temperatures (red squares) is superior to the fit to CFC forcing (green solid line), even allowing for an additional unphysical scaling and lag as in Lu (2o13) (green dashed line).
Ultimately the 'CFCs are driving global warming' myth from Lu (2013) is based on assuming rather than proving the hypothesis, unphysical curve fitting, and misrepresenting the cited research.
Last updated on 14 April 2014 by dana1981. View Archives


And another paper by the same authour, just published in International Journal of Modern Physics B
Cosmic-Ray-Driven Reaction and Greenhouse Effect of Halogenated Molecules: Culprits for Atmospheric Ozone Depletion and Global Climate Change
http://www.worldscientific.com/doi/abs/10.1142/S0217979213500732
and
https://uwaterloo.ca/news/news/global-warming-caused-cfcs-not-carbon-dioxide-study-says
Ah, yes, the International Journal of Modern Physics B, the journal that is supposedly focused on condensed matter, statistical, and applied physics, the journal that published the amazingly wrong Gerlich & Tscheuschner paper.
A new paper in which the author claims that CO2 forcing is saturated, that the log relationship between concentration and forcing for CO2 no longer holds. Oh my...
I would suggest taking climate papers from IJMPB with a large grain (perhaps a block?) of salt.
His newest paper is making the rounds quickly today it seems. Many thanks John, this argument certainly helped the debunking process
Eli Rabett has commented on the "new" (i.e., recycled) 2013 Lu paper claiming CFCs are responsible for everything.
An updated rebuttal of the CFC theory needs to be on the homepage ASAP. Some mainstream media are throwing the ridiculous claims made in Lu's new study around as if they were facts (notably The Australian).
David Karoly pointed out that the HFC replacements for CFCs have just as much greenhouse effect as CFCs, so the reduction in CFCs that Lu insists has been and will cause cooling, is being offset by HFCs. So Lu's assertion is just plain wrong for that reason, too.
As much as it pains me to correct such an eminent and respected scientist, I must humbly submit that Prof David Karoly is mistaken in saying on the ABC radio "AM" story cited by Tom @9 that "The replacement chemicals for chlorofluorocarbons are hydrofluorocarbons, which are used as refrigerants, have already got as large a greenhouse influence as the reductions in the chlorofluorocarbons.
As established by Velders et. al. Science (2012) "Preserving Montreal Protocol Climate Benefits by Limiting HFCs" (and reinforced by the 2011 UNEP Synthesis Report "HFCs: A Critical Link in Protecting the Climate and the Ozone Layer" ) the climate benefit inadvertantly acheived by phasing out CFCs to protect the ozone layer has been significant, yet is likely to be lost in coming decades if we fail to take effective action to prevent rapidly rising emissions of HFCs. The HFCs horses have not yet all bolted, but it is time to shut the gate.
Velders et.al. (2012) put it like this: "Total avoided net annual ODS emissions are esti- mated to be equivalent to about 10 Gt CO2/ year in 2010, which is about five times the annual reduction target of the Kyoto Proto- col for 2008–2012 (5). This climate benefit of the Montreal Protocol may be reduced or lost completely in the future if emissions of ODS substitutes with high GWPs, such as long- lived HFCs, continue to increase."
Preserving the climate benefits of the Montreal Protocol by urgently phasing out HFCs with a mix of policy tools including strict regulation such as end use bans, carbon pricing levies and inclusion in the Montreal Protocol to drive concerted global action is the largest, quickest, cheapest and most effective tool in the emissions abatement policy shed. But as atmospheric HFC concentrations continue to rise, time is running out, and greater attention to the non-CO2 forcers is required now.
Natural refrigerants such as ammonia, carbon dioxide and hydrocarbons stand ready to provide the needed solutions to meet our cooling needs, and the chemical companies that caused the CFC, HCFC and HFC problems have a new range of patented and attractively branded low-GWP 'HFO's' they are pushing to see adopted by anyone who still thinks they deserve to continue to be rewarded for doing so.
Prof Karoly is completely correct in saying "in fact, the global warming influence of these chemicals, the hydrofluorocarbons, is already growing more rapidly than the reductions in chlorofluorocarbons" (although he could have added that hydrochlorofluorocarbons, HCFCs, are also CFC replacements and are still rapidly increasing, in spite of being subject to a Montreal Protocol driven phaseout), but there is still more we could do to increase the reductions of CFCs & HCFCs by recovering them from the pipework and foams of our dead fridges and airconditioners respectively.
Lamentably few scientists understand the climate threat posed by HFCs, and fewer still are prepared to speak out about the need to urgently avoid their use and to rapidly embrace the readily available environmentally benign rerigerant solutions.
If we are to avoid the projected greenhouse impacts of HFCs wiping out those acheived by the CFC phaseout, it would be very helpful if Prof Karoly and others of similar standing were able to assist in clarifying the imperative of acting now to rapidly reduce the use and emissions of Ozone Depleting Substances and Synthetic Greenhouse Gases.
While Lu is completely wrong about CFCs, the debate now required is a good opportunity to correct the widely held yet mistaken notion that the F-gas problem is fixed.
Further to the above @10, I hope the following graphs may be of interest:
These Velders figures illustrate well the 'world avoided' by the Montreal Protocol CFC phase out (and the accelerated HCFC phaseout agreed in 2007), and the HFC projections by volume and CO2-e impact. While not at this stage likely, reducing HFC emissions well below the "low" projection is certainly possible with available technology and a lot more public awareness and political will.
This figure from the 2011 UNEP Synthesis Report "HFCs: A Critical Link in Protecting the Climate and the Ozone Layer" provides a good overview of where we've come from and where the relevant literature indicates we are headed, absent a more informed policy debate and resultant policy and market responses.
Apologies, the figure above with 3 graphs was adapted from Velders et.al. (2007, 2009), but it is actually figure 5-6 from the Scientific Assessment of Ozone Depletion: 2010, a collaboration of WMO, UNEP, NOAA, NASA & EC, see page 5.29 for associated explanation.
GreenCooling: Mario Molina et.al. noted in 2009 in Reducing abrupt climate change risk using the Montreal Protocol and other regulatory actions to complement cuts in CO2 emissions which was published in pnas that:
"The Montreal Protocol is widely considered the most successful environmental treaty, phasing out almost 100 ozone-depleting chemicals by 97% and placing the ozone layer on the path to recovery by mid-century (18). It also is the most successful climate treaty to date..."
CFC is a substance that is widely used around the world. Used as a component in various products such as refrigerators, air conditioners. And products that look like spray, although CFC will be a tremendous benefit to human life. Non-degradable substances in the atmosphere. It will float up to the stratosphere and be altered by the sun's rays. Become a chlorine particle and destroy ozone, which protects the Earth from heat.
The graph in the article shows the ocean heat at CFC. It was released in the city, why heat energy causes the ocean to heat up, as CFCs are released over urban areas.
Chanut.th
CFC's were banned by the Montreal accord. They are no longer used. HCFC's ad other less damaging substances are currently in use. Apparently HCFC's are also being phased out as they also damage the ozone layer. The issue is the ozone layer, which protects the Earth from damaging UV light, not protecting the Earth from heat.
After CFC's and other gasses are released into the atmosphere in the city they are mixed into the entire atmosphere by wind. In a relatively short time the entire atmosphere is mixed together. The heat is absorbed relatively uniformly over the entire Earth Since most of the Earth is covered by ocean, most of the energy absorbed goes into the ocean.
Recommended supplemnental reading:
Closing the Ozone Hole Helped Slow Arctic Warming by Chelsea Harvey, E&E News/Scientific American, Jan 22, 2020
Very recent work led by Lorenzo Polvani and an international team of scientists just published in January 2020 by Nature Climate Change (https://www.nature.com/articles/s41558-019-0677-4)
argues that large amounts of global and arctic warming are actually due to ozone depleting chemicals (CFCs, HFCs, other halons, and nitrous oxide [N20]), no less than 1/2 of all warming in the arctic and no less than 1/3 of all global warming between 1955 and 2005. These ozone depleting chemicals are trace gasses measured in parts per billion but have global warming potentials 100s to many 1000s of times greater than CO2. CFC-11 and CFC-12 are 19,000 and 23,000 times more radiatively efficient than CO2 per molecule. The global warming impact of methane has apparently also been underestimated, with one new study by Hmiel et al. in Nature arguing that anthropogenic CH4 releases have been 25-40% greater then previously thought (https://www.nature.com/articles/s41586-020-1991-8). Another study by Thompson et al. in Nature Climate Change from November 2019 showed that N20 emissions have been rising far more than the IPCC had assumed since 2009 (by an estimated factor of 2.3!) (https://www.nature.com/articles/s41558-019-0613-7). According to the US EPA, the global warming potential of N20 is 265-298 times greater than CO2 over a 100 year timescale (https://www.epa.gov/ghgemissions/understanding-global-warming-potentials). Tropospheric ozone (O3) is both a potent direct greenhouse gas and plays a role in the lifetime and effectiveness of other greenhouse gasses. According to research by Jim Hansen and others published in the Journal of Geophysical Research (2006), tropospheric O3 is estimated to have caused no less than 1/3 to 1/2 of the observed recent trends in arctic warming in the winter and spring, when O3 is easily transported to polar regions from lower latitude urban centers https://agupubs.onlinelibrary.wiley.com/doi/10.1029/2005JD006348. Tropospheric O3’s direct cumulative radiative forcing when combined with fine particulates like black carbon is believed to possibly outweigh that of all the CO2 released since the beginning of the industrial era https://www.pnas.org/content/pnas/early/2010/02/02/0906548107.full.pdf. Sulphur hexaflouride (SF6) is perhaps the most potent anthropogenic greenhouse gas, and its emissions have been rising rapidly from use as an electrical insulator. Its 100 year global warming potential per molecule is estimated at 23,000 times that of C02. Its atmospheric abundance is low at 8.60 parts per trillion volume, but it is rising at a linear rate by 0.33 pptv per year and can persist in the environment for more than 1000 years. https://www.atmos-chem-phys.net/17/883/2017/acp-17-883-2017.pdf
Would that not be evidence that climate sensitivity to CO2 must be much lower than previously modeled? These other GHGs would presumably have the same water vapor amplification feedbacks as CO2 (as non-condensing atmospheric gasses) and produce the expected lower adiabatic lapse rates of warmer water vapor, would they not? Or does water vapor resonate more readily with the discrete wavelengths of infrared radiation emitted by vibrating CO2 molecules? Are those wavebands already saturated so that any additional CO2 emissions can’t add much more radiative heat? In other words, if CO2 is as radiatively powerful as modeled, there should have been dramatically more global warming since the onset of industrialization, especially since the 1950s when these other GHGs really began to be emitted on a very large scale.
In my previous post I failed to mention HFCs (a.k.a. HCFCs). They replaced CFCs with the Montreal Protocol.
The 100 year global warming potential of HCFCs (C5H2F10) was recently re-estimated to be somewhat lower than previously thought, but at 1,410 it is still over 1000 times greater per molecule than C02. https://www.sciencedirect.com/science/article/abs/pii/S0022285217301455. According to NOAA, these chemicals have been accumulating in the atmosphere at a rapid rate since 1990, with HCFC-22 and HCFC-134a above 250 and 100 pptv respectively in 2015 and increasing linearly. https://www.esrl.noaa.gov/gmd/hats/about/hfc.html
EGS:
From the abstract of the paper you cited:
"While the dominant role of carbon dioxide is undisputed"
The IPCC knows that there are a number of other greenhouse gasses besides CO2. Modelers have these gasses in the models. It appears to me that Polvani et al are trying to quantitate more accurately how much warming is due to gasses besides CO2. This is interesting but does not change the basic science of AGW.
Would that not be evidence that climate sensitivity to CO2 must be much lower than previously modeled? These other GHGs would presumably have the same water vapor amplification feedbacks as CO2 (as non-condensing atmospheric gasses) and produce the expected lower adiabatic lapse rates of warmer water vapor, would they not? Or does water vapor resonate more readily with the discrete wavelengths of infrared radiation emitted by vibrating CO2 molecules? Are those wavebands already saturated so that any additional CO2 emissions can’t add much more radiative heat? In other words, if CO2 is as radiatively powerful as modeled, there should have been dramatically more global warming since the onset of industrialization, especially since the 1950s when these other GHGs really began to be emitted on a very large scale.
1/2 of all arctic warming between 1955 and 2005 due to CFCs & N20?
1/3 of all global warming between 1955 and 2005 due to CFCs & N20?
Nearly all the recent decline in arctic sea ice due to CFCs and tropospheric O3?
Tropospheric O3 and black carbon with as much impact on global warming as all the CO2 emitted since c. 1750?
EGS,
You appear to be arguing that Climate Science has severe flaws in calculations based on this paper. The paper does not make that claim. Your claim that "Nearly all the recent decline in arctic sea ice due to CFCs and tropospheric O3?" is not what the paper says. In fact the abstract says:
"when ODS are kept fixed, forced Arctic surface warming and forced sea-ice loss are only half as large as when ODS are allowed to increase" my emphasis.
The response of water vapor to added greenhouse warming from CFC's would be the same as the response to CO2. Your claims that the effect of CO2 are overestimated by the IPCC are not in the abstract of the paper, you appear to have made them up yourself.
Much of the difference between the warming we have seen since 1989 and what Hansen modeled is due to the fact that Hansen modeled CFCs increase as more than they did. The Montreal Protocol resulted in lower increases of CFCs than previously expected.
Only climate deniers claim that only CO2 affects global climate change. Climate scientists know that other gasses (including black carbon) also affect warming and the total effect of human released gasses is much greater than the effect of 415 ppm CO2 alone. The linked press release claims 82% of the increase in greenhouse gasses from 2007-2017 is from CO2. CFC's were released less in that decade than before because of the Montreal protocol.
EGS:
A free copy of the paper you cite is here. It states
"in this paper we focus specifically on the period 1955–2005,
during which ODS concentrations grew rapidly. Over that period
the RF from ODS is estimated16 to be 0.31 Wm–2, which amounts
to nearly one-third of the RF from CO2 (1.02Wm–2), making ODS,
collectively, the second most important GHG in the latter half of
the twentieth century, as seen in Fig. 1. These facts are well established7,17 and the important contribution of ODS to global warming has previously been noted18,19" my emphasis.
It appears to me that your claims are not supported by your citation.
EGS :-
Being far from expert in this area, I should be grateful if you would explain the significance or importance of that recent study by Polvani et al.
The authors are somewhat vague in their claims, and request confirmatory studies. AFAICT their models are based on experimental infrared spectra & calculated instantaneous radiative forcings. They say that their results suggest that ODS [Ozone-Depleting Substances] provide about 20% of the GHG RF forcing over the Arctic. (This fits with past information provided on the NASA website.) Yet they state that "the precise value of ODS efficacy remains to be robustly quantified."
By area, the polar regions are only a small portion of total planetary surface, and they have even lesser importance when given a radiative weighting.
There may be some misinterpretation of the relative radiative importance of the halocarbons, since (like with the comparative weightings of CO2 and H2O vapor) it is difficult to un-tease the overlapping absorptive spectra of other GHGs.
Eclectic,
Are you claiming that the degree of northern hemisphere ice albedo is a trivial amplification feedback in anthropogenic radiative forcing?
[DB] Your previous 2 comments were removed as being off-topic and Gish Gallops of rambling assertions lacking foundation. Just throwing out a bunch of poorly-understood and misrepresented papers does not give you any credence in a science-based forum such as this. Please stick to the topic of this post. Other topics are covered by other posts here (literally thousands exist). Use the Search function to find the most relevant post and read it and its comments and this site's CommentsPolicy before posting further.