


 Arguments


The lines of evidence that humans are raising CO2 levels
What the science says...
Multiple lines of evidence make it very clear that the rise in atmospheric CO2 is due to human emissions.
Climate Myth...
Murry Salby finds CO2 rise is natural
"Salby’s argument is that the usual evidence given for the rise in CO2 being man-made is mistaken. It’s usually taken to be the fact that as carbon dioxide concentrations in the atmosphere increase, the 1 per cent of CO2 that’s the heavier carbon isotope ratio c13 declines in proportion. Plants, which produced our coal and oil, prefer the lighter c12 isotope. Hence, it must be our gasses that caused this relative decline. But that conclusion holds true only if there are no other sources of c12 increases which are not human caused. Salby says there are - the huge increases in carbon dioxide concentrations caused by such things as spells of warming and El Ninos, which cause concentration levels to increase independently of human emissions. He suggests that its warmth which tends to produce more CO2, rather than vice versa - which, incidentally is the story of the past recoveries from ice ages." (Andrew Bolt)
Every year humans release about 30 billion tons of carbon dioxide (CO2) into the atmosphere through the burning of fossil fuels, such as coal and oil. This is causing the Earth to warm by disrupting the biological (fast) carbon cycle, and is therefore increasing the Greenhouse Effect. Although there are large annual fluctuations in carbon dioxide, as it is exchanged back-and-forth between the atmosphere, oceans, soils, and forests, just under half of human emissions (the airborne fraction) remain in the air because the oceans, soils and forests are unable to absorb all of it. As a result, carbon dioxide has been steadily accumulating in the atmosphere.
Figure 1 - Fraction of the total human emissions (fossil fuel burning & land use change) that remain in the: a) atmosphere, b) land vegetation and soil, c) the oceans. From Canadell (2007)
Murry Salby, a professor at Macquarie University in Sydney, Australia, has an upcoming paper that attempts to pin the current rise in carbon dioxide on rising temperatures. Having listened to a podcast of a talk Salby gave at the Sydney Institute earlier this week, he demonstrates a remarkably poor understanding of the carbon cycle, and his hypothesis seems to stem from this fundamental misunderstanding.
Salby's carbon cycle confusion
Professor Salby refers to a number of graphs in his talk, but I have been unable to track down copies of these, therefore we'll have to rely on what I'm able to glean from the podcast, and given it's length, I'll only address some of the more obvious mistakes. At the beginning of the talk Salby states:
"current CO2 values are 380pmmv"(parts per million by volume)
Not an encouraging start that he cites the atmospheric CO2 concentration as it was in 2005, rather than the 393 parts per million by volume (ppmv) it currently is in 2011. Not a fatal flaw of course, but not encouraging either.
"Net annual emission has an average increase of about 1.5ppmv per year. We're on the right planet. That's the annual average increase you just saw. But it varies between years, dramatically by over 100%. From nearly zero in some years to 3ppmv in others. Net global emission of CO2 changes independently of of the human contribution"
At this point the accentuation and drama in Salby's voice make it sound as though he has stumbled onto something momentous, something no one else has noticed before. On the face of it, it seems preposterous that the army of scientists that have worked on carbon cycling over the years could have missed something so glaringly obvious. No, of course they haven't.
As discussed in the first paragraph of this post (and evident in Figure 1), the natural flux of CO2 in and out of natural systems varies from year-to-year. This flux is 20-30 times larger than the annual contribution by humans, but this balances out in the long-term. This variability is driven largely by El Nino and La Nina in the tropical Pacific, which shifts rainfall patterns over much of the world and is associated with warming and cooling of equatorial waters in the Pacific. The change in seawater temperature, and episodic upwelling of carbon-rich deep water, significantly affects the uptake and outgassing of CO2 from the oceans, and of course rainfall variation greatly affects plant growth.
The upshot is that land vegetation takes up more CO2 during La Nina, and expels more CO2 during El Nino. In the ocean, the opposite trend occurs - El Nino leads to more CO2 absorption, and La Nina is when the oceans give up more CO2 (Figure 2).
Figure 2 - (a) time trend in the exchange of CO2 by land-based vegetation (& soil microbes) with the atmosphere. (b) same - but for exchange of CO2 by ocean with atmosphere. Red indicates El Nino and blue La Nina phase. See Keeling et al. (1995).
There is simply no reason why the annual fluctuation should match the human contribution. At least Salby doesn't explain why he expects this to be the case.
Having now convinced himself that short-term net CO2 has nothing to do with the human contribution, Salby therefore deduces long-term net CO2 must also be unrelated to human emissions. He goes on to derive a formula for CO2 rise associated with temperature. Salby claims a good match back to 1960 but therefafter it deviates from actual CO2 measurements by 10ppmv. By 1880, prior to atmospheric CO2 sampling, he estimates atmospheric CO2 at 275ppmv with a whopping uncertainty of 220 to 330ppmv!
In order to explain the deviation between the surface temperature record and his calculated atmospheric CO2 level, Salby blames the surface temperature record as being unreliable. As for his calculated trend disagreeing with the ice core record for the year 1880 (i.e the CO2 in air, from that period, trapped in ice cores) he 'disses' the ice core record claiming it to be only a 'proxy'. Which is news, I'm sure, to respected ice core experts like Dr Richard Alley.
You will note that every time the data disagrees with Salby's 'model', he trusts his 'model' over the data. Which contravenes the 'skeptic lore' that models are worthless and must be bashed, and only data should be trusted.
Q&A time - try not to shoot yourself in the foot!
The question & answer session at the end of Salby's talk throws up a few more comments that just reinforce that he has strayed into a field of science which he just simply doesn't understand. Witness:
"I think it's a pitfall that people look at the ice proxy of CO2 and take it literally. It's not atmospheric CO2, and I don't believe it's CO2 that was even in the atmosphere when that piece of snow was layed down"
This is nonsense. Perhaps Professor Salby should have acquainted himself with glaciology research before making such comments, because CO2 from ancient air trapped in the ice cores is precisely what is measured, albeit with some uncertainty in dating some sections.
"CO2 after the turn of the (21st) century continued to increase, in fact if anything slightly faster, but global temperature didn't. If anything it decreased in the first decade of the 21st century. Now I'm confident the IPCC (Intergovernmental Panel on Climate Change) will come up with an explanation, in fact they've come up with several"
It's here we need to back the truck up a bit. Salby's entire premise is that CO2 in the air directly dependent upon temperature - increase temperature and you increase CO2. Yet here he argues that CO2 can increase without an accompanying increase in temperature. Which contradicts his 'model'. By this time Salby is too focused on 'dissing' the IPCC to notice his own incoherency, and none of the audience picks up on this either.
Note that SkS recently discussed the 'noughties slow-down' in global temperature here and here.
If the curve fits
Seasoned readers will notice similarities between this Salby claim and a Lon Hocker rebuttal here at SkS last year. But the whole premise seems to follow along the lines of other recent flawed works tendered by Roy Spencer and Craig Loehle & Nicola Scafetta. That is: find some tenuous statistical relationship between two sets of data, and use these to assert the mainstream scientific establishment is wrong. The fact that there is no physical basis for the statistical relationship, or it doesn't fit within the well-established scientific framework, or is contrary to numerous other sets of data, never seems to warrant attention by "skeptic" scientists. It should, because of the implications one can draw.
So what does this work by Salby imply, if it were true? From what I can gather from Salby's podcast, a 0.8°C change in average surface temperature is supposed to lead to about 120ppmv change in CO2. Therefore we can work backward in time to estimate what he reckons atmospheric CO2 would be at the time of the last Ice Age (glacial maximum), a time when global temperatures were about 4-6°C cooler than now . Today atmospheric CO2 is about 393ppm, so with 4°C cooling you already have a negative value for CO2 when we re-trace our steps back to the last ice age. Therefore all plant-based life on Earth must have died (and all the animals that depended on them) according to Professor Salby. And the Earth froze solid too.
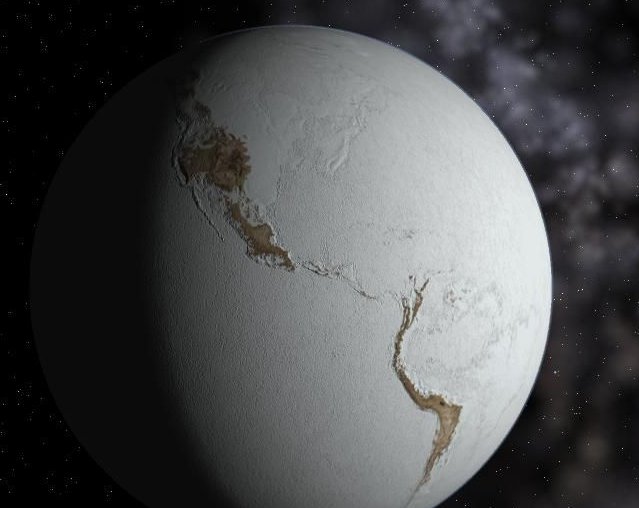
Figure 3 - the last Ice Age according to Murry Salby? Fictional image from celestiamotherlode.net
Science - a description of reality, but YMMV
Without viewing Salby's calculations on the temperature/net global CO2 relationship, it's not possible to provide the 'killer blow' to his assertions; however, I don't believe that's necessary, considering the many flaws in Salby's work and fundamental reasoning.
The gradual increase in atmospheric CO2 is less than the total emissions of CO2 from human sources, so by elementary deduction, the excess must be going into the oceans, forests and soils, the other components of the fast carbon cycle.
A tell-tale signature of human fossil fuel emissions is the large fraction of CO2 being driven into the oceans. According to Henry's Law, we would expect the oceans to absorb more CO2 as the air above it becomes increasingly saturated with CO2. In other words the CO2 must be coming from a source external to the fast carbon cycle. This is supported by measurements showing that CO2 is accumulating in the ocean, and is reflected in the declining oceanic pH, showing the ocean is actually gaining CO2 over the long-term, not losing it, as Salby seems to believe.
We also know that the world's land vegetation has increased in mass - through re-growth in forests in the Northern Hemisphere, and CO2 fertilization of tropical forests. So that is gaining carbon too, and the areas affected are so large, we would expect them to have an effect on atmospheric CO2 levels at a global scale.
There are a host of other problems with Salby's 'model', such as the ice core record, and where the warming came from in the first place, but there's no need to go into these details when the fundamental premise of Salby's argument is so clearly wrong.
Intermediate rebuttal written by dana1981
Update July 2015:
Here is a related lecture-video from Denial101x - Making Sense of Climate Science Denial
>
Last updated on 11 July 2015 by MichaelK. View Archives


Just been pointed to this article that seems to support Salbys work. Do you have a rebuttal for its conclusions?
http://www.sciencedirect.com/science/article/pii/S0921818112001658
[TD] Just more of the same for Humlum. Search for "Humlum" on this page. Also enter Humlum in the Search field at the top left of this page to find more.
[TD] Sorry, I should caffeinate before typing in the morning. Mark Richardson wrote a Skeptical Science post about this Humlum paper!
Michaelf, Mark Richardson debunked Humlum's 2013 article in the latest issue of the same journal.
[TD] Mark Richardson wrote a whole Skeptical Science post summarizing his comment.
Michaelf, a debunking by Masters and Benestad was published in the July issue of the same journal. The article is paywalled, but Masters explained the approach on his blog, and Benestad debunked previous, annoyingly similar "work" by Humlum on RealClimate. Masters discusses their Masters and Benestad critique on his blog, including a discussion by he and Richardson about the complementarity of their critiques.
[TD] Mark Richardson wrote a whole Skeptical Science post summarizing his comment.
Thanks. Had not come across it before, read it, thought it was very similar to what Salby was trying to get published but couldn't, so was surprised to see those theories published. Probably because he left the question open about where the CO2 was coming from and did not answer the question of where our CO2 had gone. So before I had that argument I thought I would check over here. Glad I did :-) will go and do some reading.
What I am about to ask may seem unfair, but it would be very helpful to me. As a former Process Control engineer I am very interested in where you see a mistake or error in the presentation at https://www.youtube.com/watch?v=K_hBOU26F5o I know you have posted arguments against Salby in the past, but what I am looking for is not counter arguements, but rather something like "At time frame 50:45" his math is wrong as follows..." or "At time frame 50:45, the assumption he makes is wrong based on the following research data [with reference to study data ] I want to keep the arguement tight and specific. I realize this is a lot of work, but you might gain a convert (me) if you can show me specifically where he goes wrong in this presentation. I am putting questions to Salby as well. Thanks!
InnocentSmithReturns @17.
You ask about "a mistake" but appear to ask for a detailed blow-by-blow rebuttal. Don't hold your breath on the latter. You may consider the following a response to the former and a taste of what the latter would contain.
The first of Salby's graphics plots global CO2 emissions from fossil fuel & cement and onto this trace Salby draws two period trends and annotates the annual rate of change for these periods. He says this rate of change grew massively between the 1990s and the 2000s. The rate of change has changed! This is fine. The rate of change of fossil fuel (&cement) emissions increased during the 1960s, fell back through the 1970s, bulged up and down through the 1980s, stayed low through the 1990s (averaging 80Mt(c)/y/y) then rising again through the 2000s and staying high to 2013 (averaging 240Mt(C)/y/y 2002-2013). These therefore are probably what Salby means by "the growth of fossil fuel emissions increased by a factor of 300%." It is however messy data, something Salby rather ignores.
Where Salby is also silent here is the change in CO2 emissions between these two periods1990-2001 & 2002-2013. Between the two periods, the annual emissions rose from 6.4Gt(C)/y average to 8.6Gt(C)/y average due to FF+cement, a rise of 33%, but more correctly, including net land use emissions these figures are 7.9Gt(C)/y to 9.5Gt(C)/y a rise of 20%.
Salby's second graphic is MLO CO2 data. When he claims the rate of change in atmospheric CO2 is "exactly" the same for the period 1990-2001 as it is to 2002-2013 (he may be using slightly different periods but the outcome would be the same) he is simply lying. For the two periods, the average annual increases were 1.6ppm/y and 2.1ppm/y respectively, a 40% increase. A least squares through the MLO data yields a 1.57ppm/y(+/-0.1) for the first period and 2.01ppm/y(+/-0.1) for the second, a 28% increase.
So that's the first 3 minutes of the 70 minute presentation. Selby compares 300% with 0% and says science is wrong and ignores this mismatch. But the 300% is not what he should be comparing and the 0% is a lie. You can even spot the lie on the next graph he presents. While the remaining 67 minutes of Sably's analysis does get more complex, it fails to get more truthful.
InnocentSmithReturns - The current science on CO2 indicates that the recent warming of 0.8C over pre-industrial levels has released an additional ~10-12 ppm of CO2 from the oceans. Salby claims that _all_ CO2 increase from pre-industrial levels comes from ocean warming, a rate of perhaps 120 ppm per degree. And not from our (well known) emissions.
If that relationship held true, given that the ice ages perhaps 6-7C cooler globally, CO2 levels during the ice ages would have gone to zero (-300ppm or so by that relationship, in fact!), killing all life on Earth. That's absolutely not the case, and the failed relationship of Salbys presents a reductio ab adsurdum failure of his arguments.
Salby's arguments are nothing but nonsense.
Leaving aside Salby's nonsense, it is worth noting that the over very long time scales (100s of million years), the trend in CO2 has been downward. Just as well because the sun is gradually getting hotter over similar time scales. At about end of Pliocene, CO2 got low enough for Milankovitch cycles to induce ice ages. With our massive release of millions of years worth of stored hydrocarbons, we have kind of reset that cycle.
InnocentSmithReturns @17, I have a very low opinion of Murray Salby's honesty, for reasons partly explained here and here. He immediately shows, in this new video, why that low opinion is justified. He begins by referring to is sacking by Macquarie University (0:30). He says:
He must have had a sense of deliberate mischief in making that claim, which makes it appear as though he was prohibitted from teaching prior to his dismissal. In point of fact, he was dismissed, in part, because he refused to teach:
Salby demonstrates incredible chutzpah in accusing the University of preventing him from teaching, whereas in fact he was dismissed because he refused to teach.
Of coure, that was only part of the reason. A further reason was his undertaking a trip to Europe when his class schedule required him to be in Australia, and paying for that unauthorized trip through the unauthorized use of university funds. Nor was that misappropriation the first by Salby, who ceased employment in the US because he had been found to undertake conduct that "...reflects a consistent willingness to violate rules and regulations, whether federal or local, for his personal benefit."
Fast forwarding to 1:06:06 on the video, Salby shows a graph the obsolute HadCRUT3 data set. Leaving aside why he uses the obsolete data set rather than the current HadCRUT4 data set, he shows two apparent trend lines on the graph at that point. Careful examination shows that they are not in fact trend lines, but pseudo-trendlines. They are intended to look like trend lines, but are not. The periods are from 1877-1910 (actual trend: - 0.0089 C per annum), 1910-1945 (actual trend: 0.0159 C per annum). This gives a mean change in temperature between start point and end point of the intervals of -0.3 C and 0.4 C respectively. Salby shows them as -0.7 and 1 C instead, inflating the values by 133% and 150% respectively.
Earlier, in discussing the HadCRUT3 data he asserted that the warming post 1910 was "just as long and even faster" (1:05:00) than the warming post 1976. His highlighted area for post 1976 actualy ends in 1998, but I have taken it to 2001 to cover the same period ("just as long"). That reduces the trend for the period. Nevertheless the trend from 1976 to 2001 is 0.0172 C per annum, 8% faster than the earlier period. That difference may not be statistically significant, but that does not justify claiming the period with the lower nominal trend had the higher nominal trend which is a direct falsehood. Even that leaves aside the fact that Salby cherry picked the earlier period to give the maximum trend, but excluded years ('74 and '75) that would have resulted in an increased trend for the later period.
(Analysis made using the Wood for Trees resource. All trends calculated from January of the initial year through to December of the final year.)
Clearly Salby has not abandoned the dishonest presentation of data on which so much of his argumenation depends in earlier videos.
This may seem like shooting the messenger. It is not. The paradox of internet "experts" is that they seek tirelessly to convince the generally uniformed and inexpert public that what they say is true, while scrupulously avoiding putting their arguments before genuine experts who are long familiar with the relevant arguments, and the relevant data. Specifically, while rusing to convince the uninformed public, they avoid peer review. Somebody truly convinced of their theories would take the opposite approach. There confidence in the soundness of their arguments should result in equal confidence that they will be able to persuade the majority of domain experts as to the truth of what they say. Conversely, when a supposed expert insists in presenting their "revolutionary" theories time again to an uncritical public, while avoiding opportunties to present them before the well informed - you should take that as in indication of their confidence, or rather their lack of confidence, in the soundness of their arguments.
That is particularly the case when they repeatedly (as Salby does) choose obsolete data over current data, cherry pick, use misleading presentations of the data, apply statistical tests to theories they oppose while avoiding similar tests for their own theories, and repeatedly misrepresent the nature and substance of the theories they criticize. (The later is very evident in this video in Salby's complete failure to acknowledge the many other forcings other than CO2 that the IPCC recognizes and discusses, in addition to more pointed examples I may discuss later.)
The scope of Salby's video is so broad that your request for a point by point rebutal amounts to a request to be given a free Climate Science 101 course; with the added onus on your respondents that they have to correct Salby's misleading presentations of data and theory at the same time. It is a big ask. It is not something I am inclined to do unless I see clear evidence of good faith in the form of an ability to recognize Salby's shoddy practise for what it is.
The first factual error he makes is at 1:15 and is the first piece of scientific information given in the talk. He says:
"The IPCC position is exclusive; the increasing CO2 results from anthropogenic emissions entirely"
This isn't actually true, in AR5 says (page 493)
"With a very high confidence, the increase in CO2 emissions from fossil fuel burning and those arising from land use change are the dominant cause of the observed increase in atmospheric CO2 concentration"
The reasons they say "only "dominant" is because there are also emissions from cement production, but also to allow for the possibility of some component due to ENSO (I know this because I asked for clarification). So Salby misrepresents the IPCC in the very first statement. Not a good start.
The fact that the natural environment is a net carbon sink is, somewhat ironically, established by the equations he gives on the slide from 5:12. If instead of plugging in the IPCC estimates for natural fluxes, you use the observed growth rate to infer the difference between natural emissions and natural uptake, you find that natural uptake is always greater than natural emissions. This directly refutes Prof. Salby's conclusions, and he has been informed of this, but he contines to ignore that and doesn't mention in in his talks. You can find an explanation of why in my article on an earlier talk (I sent him a copy for comment before publishing it, but recevied no reply).
My article also explains his mathermatical error that starts with the following slide (note he never states exactly how he gets the data for that graph, and ignored my request for clarification).
Dikran Marsupial @22.
How does Salby get that data? I think we can safely conclude that the green CO2 data presented variously by Salby (your Figure 2) is a short slice of a genuine atmospheric CO2 record (presumably MLO) but after it has been passed through a Fourier analysis & stripped of unwanted frequencies. Thus he gets a nice clear sine-type wobble.
We also know that the majority of the blue trace, the "lion's share" he tells us, is global temperature so if it is derived from actual data, it will have been likewise filtered through a Fourier analysis and also shifted a few months because of the lag between temperature & CO2 that Salby helpfully illustrates at 22:00 (although it is less than the 10 months he states in his talk).
Mind, as Salby is at best entirely untrustworthy in these presentations of his, being in error at almost every turn (and so untrustworthy and error-prone that it is very difficult not to consider his talk as an insincere pack of lies), it might be a simpler task to answer InnocentSmithReturns by pointing out "specifically where he (Salby) goes right in this presentation."
He's back. Talk at University College London on July 18, 2016 so the "1000frolly" shill thing says. Can anybody tell me where Murry Salby gets this "Thermally-induced component of atmospheric CO2" graph he presents. I want to find the source and ponder it. Searching those phrases on the internet and sks isn't yielding any relevant results.
I've been engaged in debate at a Discovery article, with someone called RealOldOne2, who is made the following claim today, in response to a comment by me.
["Peer reviewed science says that only 15% of the increased CO2 since the Industrial era is human, and 85% is natural:
"The anthropogenic contribution to the actual CO2 concentration is found to be 4.3%, its fraction to the CO2 increase over the Industrial Era is 15%" - Harde(2017) "Scrutinizing the carbon cycle and CO2 residence time in the atmosphere"]
I don't have the resources or know how to research the subject enough to counter his claim. Anyone want to take a shot at it?
He also makes claims (in another comment) about short wave energy striking the earth increasing due to cloud changes effecting albedo, and cites published papers, to back his claim that this effect is stronger radiative forcing than human CO2 emissions.
He said.
"And the amount of solar radiation reaching the earth's surface increased by 2.7W/m² to 6.8W/m² during the late 20th century warming. This is documented in the following peer reviewed science:"
Here's the link
LINK
[DB] Shortened link