


 Arguments


What's happening to Tuvalu sea level?
What the science says...
Between 1950-2009 sea level at Tuvalu rose at the rate of 5.1 (±0.7) mm per year. This is almost 3 times larger than average global sea level rise over the same period.
Climate Myth...
Tuvalu sea level isn't rising
Because the coral atoll of Funafati, Tuvalu is densely populated and generally less than 3 metres above sea level, this small island nation in the Pacific is often the subject of intense media speculation about the impact of rising seas. The atoll is likely to begin to be overtopped by the sea sometime between mid to late 21st century, however Tuvaluans have often featured in the mainstream media claiming to be already experiencing the detrimental effects of sea level rise. Scientific studies to support these claims has been have been hard to find, but now a recently published study vindicates what many Tuvaluans have insisted all along - sea level has risen rapidly around Tuvalu.
Becker et al. (2012) has examined sea level rise in the western tropical Pacific Ocean using a combination of tide gauges, satellite-based measurements, ocean modelling and GPS, and found that the region is experiencing sea level rise much larger than the global average. At Funafati Island, the study authors found that between 1950-2009 'total' sea level, which also accounts for the rate of island subsidence or sinking, rose at 5.1 (±0.7) mm per year, almost 3 times larger than the global average over the same period.
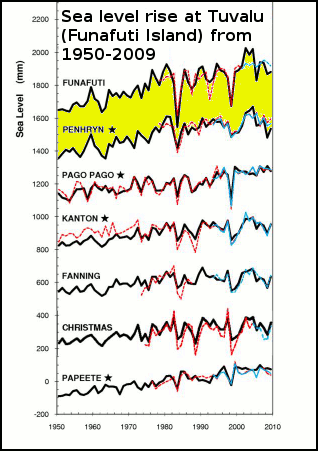
Figure 1- Sea level curves at tide gauge sites since 1950. Time series of reconstructed sea level (black), tide-gauge (red) and altimetry satellite in blue continue and in dash line (when tide gauge records were supplemented using altimetry data). From Becker (2011). Image cropped from original.
Sea level rise is not level
Of the many things about global warming misunderstood by the public at large, the irregular or lumpy distribution of sea level rise must surely be near the top of the list. When sea level rise is mentioned, this typically refers to the global average or mean, but this obscures the fact that not all areas of the ocean are rising. In a few regions sea level is actually falling, while at others it is rising at a rate much larger than the global average. So even though the total volume of seawater from melting land ice, and thermal expansion from ocean warming are increasing, this isn't being evenly spread around the oceans. See figure 2 below.
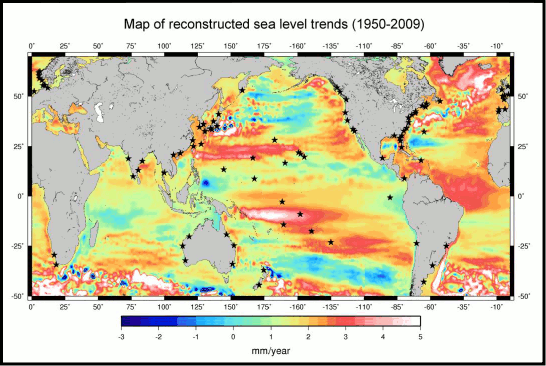
Figure 2 -Location map of the 91 tide gauges (stars) used in the global sea level reconstruction. The background map shows the sea level trends over 1950–2009 from DRAKKAR-based (an ocean model) reconstruction of sea level (uniform trend of 1.8 mm/yr included). From Becker et al. (2012).
It just so happens that the western Pacific and Tuvalu in particular, are one such region where there is a large rise in sea level, much greater than the global average. See figure 3.
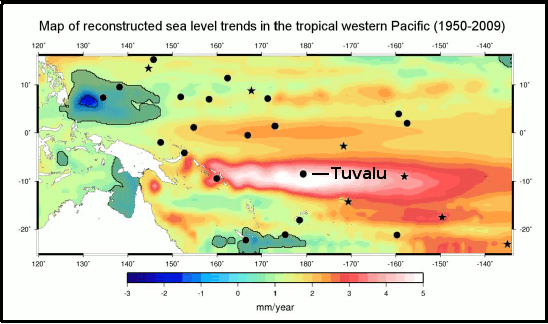
Figure 3 - Map of the Pacific Island region interannual sea level trend (linear variation with time) from the reconstruction 1950-2009. Locations of the 27 tide gauges (black circles and stars) used in the study are superimposed. Stars relate to the 7 tide gauges used in the global reconstruction. Dark areas relate to non-significant trends. From Becker et al. (2012).
Mapping sea level rise in the western Pacific
Measuring ongoing sea global level rise, which results from the global warming-induced melting of land ice and thermal expansion, is a complicated business. This comparitively small long-term rise is often obscured because sea level can undergo large up-and-down fluctuations over seasonal, annual, and even decade-long time scales. This is especially true in the case of the islands of the western Pacific where the ENSO cycles El Niño and La Niña result in sea level fluctuations up to 20-30 cms, which is around 40-60 times larger than the long-term annual increase (5.1mm) found at Tuvalu. Quite obviously these fluctuations have to accounted for in order to see the underlying long-term trend.
Overcoming problematic data
The tide gauge and satellite altimetry data both have their own shortcomings, for example the tide gauges have long records, but some are plagued by data gaps, and monitoring equipment that has been updated over time. Also, tide gauges are fixed to the seafloor, which can either be sinking or rising dependant on the location (hence the use of co-located GPS equipment at some sites), so that has to be factored in to observations too.
Satellite altimetry is a vast improvement over the tide gauge network in that it covers the entire oceans, and not just the coastal regions. It can therefore provide a more detailed picture of sea level variations from region to region. See figure 4.
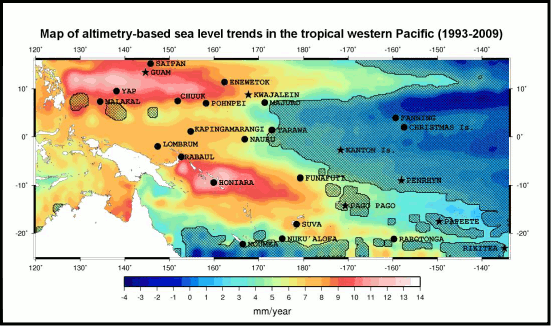
Figure 4 - Satellite altimtery-based sea level trend patterns in the tropical western Pacific over 1993-2009, on which are superimposed the 27 tide gauges used in the study. Stars correspond to the 7 tide gauges used in the global reconstruction. From Becker et al. (2012)
But the downside of satellite observations is they have only been in operation for a short time. They do show a dramatic rise in sea level, in some areas in excess of 10mm per year (Honiara & Yap in figure 4), but the record only began in 1993, and 17 years (to 2009) is hardly long enough to tease out any decades-long natural variability that might exist. In other words, the rapid rate shown in the satellite data may not be indicative of the long-term rate of sea level rise in the region.
Global and regional sea level reconstruction
Becker et al. (2012) set about reconstructing sea level over the period (1950-2009) by analysing the tide gauge, satellite altimetry, GPS data and use of an Ocean General Circulation Model. Combining a selection of 91 good quality tide gauge records (from 1950-2009) with gridded fields in the ocean circulation model they were able to unravel how sea level evolved in both time and space. To test how well their reconstruction matched observed sea level at a global scale, the authors removed a single tide gauge record from the reconstruction and compared the remaining reconstruction with that at the tide gauge site they removed. This exercise was repeated for each individual tide gauge. Finding good agreement, the authors then compared their reconstruction with the satellite altimetry over the period 1993-2009 in the western Pacific. See figure 5.
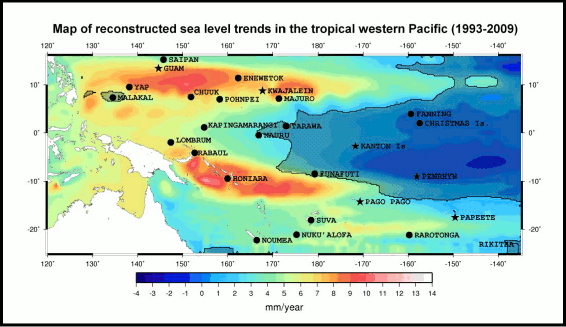
Figure 5 - Reconstructed sea level trend patterns in the tropical western Pacific from 1993-2009, on which are superimposed the 27 tide gauges used in the study. Stars correspond to the 7 tide gauges used in the global reconstruction. From Becker et al. (2012).
As seen in figures 4 & 5, the reconstruction method does a good job of describing the actual change of sea level in the western Pacific, although the total amount of sea level rise in the reconstruction is smaller (at maximum & minimum) due to the statistical filtering method employed. See figure 1 for a comparison of the global reconstruction against the tide gauges for the western Pacific not used in the global reconstruction, and against the satellite altimetry.
Tuvalu sea level rises with La Niña and falls with El Niño
As seen in the "Sea level fell in 2010" rebuttal, short-term global sea level can fluctuate due to the temporary exchange of water and snow between the land and sea, rising during El Niño when the land surface dries out, and falling with La Niña when the land surface recieves extra doses of rain and snow. In the western tropical Pacific, especially around Tuvalu, this trend is exactly the opposite, sea level there falls during El Niño and rises during La Niña. So what's going on?
This is largely due to the tilting of the thermocline in the tropical Pacific. See this animation for a great illustration of what this means. During La Niña strengthening of the easterly trade winds straddling the equator pushes warm water toward the western tropical Pacific. This warm water piles up in the western Pacific, which drives warmth down deep (the tilt of the thermocline), but it also causes the ocean to bulge upwards there due to the extra wind-driven water mass (see Timmerman [2010], Merrifield [2011] & Qiu & Chen [2011]). Both have the effect of raising sea levels, with the 'twin peaks' of sea level rise very obvious just north and south of the equator in figures 4 & 5 (the equator would be a horizontal line through Nauru).
During El Niño the trade winds weaken and the warm wind-driven water mass is no longer pushed toward Tuvalu and neighbouring islands. Instead the thermocline tilts back onto a more level plane, warm water begins to accumulate in the central Pacific, and accordingly sea level drops around Tuvalu.
The huge drop in sea level around Tuvalu, and nearby islands, shown in figure 1 around 1982-1983 is due to the strong El Niño during that time. Which goes to show not only how variable and sensitive to ENSO sea level in the western tropical Pacific is, but also how much variation there is even within the western Pacific itself. This ENSO/sea level relationship is shown in figure 6 below, however note that this graph accounts for the tropical western Pacific, not just Tuvalu.
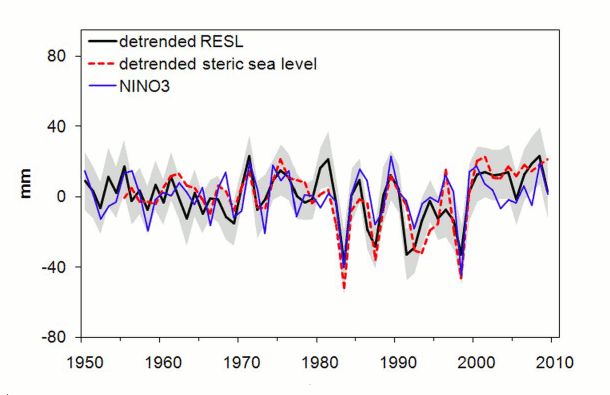
Figure 6 - Reconstructed sea level (RESL=black line) over the tropical western Pacific between 1950-2009 after the 1.8 mm per year trend has been removed (detrended). Gray areas represent RESL uncertainty. Red line=detrended steric (thermal expansion + salinity change) over the same period from ocean heat content data. Blue line= the NINO3 index, which is a measure of the sign (El Niño or La Niña) and strength of ENSO. See global map here for NINO3 region. From Becker et al. (2012)
Steric sea level is variation which results from changes in ocean heat content (thermal expansion), and changes in salinity (saltiness) which affects the density of seawater. Once the long-term trend has been removed (de-trended) from the reconstructed sea level and steric sea level, the relationship between sea level, the steric component and ENSO is plain to see in figure 6.
GPS - accounting for vertical land movement
In many parts of the world the land surface is either very slowly rising or sinking, and this needs to be factored into reconstructions because, unlike the satellites measuring sea level, the tide gauges are firmly anchored to the sea floor. Becker et al. (2012) sift through the GPS equipped western tropical Pacific tide gauge sites, ending up with 7 sites that are of sufficient quality for analysis. They make the assumption that the rate of subsidence (sinking) observed over the short time of GPS use, holds true back to 1950, and find that subsidence adds an additional 10% to the total sea level rise experienced at Tuvalu.
So to sum up:
- Sea level rise is not level. Although the oceans are gaining water mass from melting land ice, and the oceans are expanding due to increasing heat content, this water mass and heat is not spread evenly over the oceans.
- In the tropical western Pacific the dominant short-term influence on sea level is the extremely large fluctuation due to the ENSO events El Niño (falling sea level at Tuvalu) and La Niña (rising sea level at Tuvalu).
- Sea level at Tuvalu can vary by 20-30cms from the influence of ENSO. This is 40-60 times larger than the annual rate of sea level rise at Tuvalu.
- This regional susceptibility to ENSO is because of the weakening (El Niño) or strengthening (La Niña) trade winds near the equator, which push warm water mass toward the tropical western Pacific.
- Becker et al. (2012) uses a combination of tide gauge data, satellite observations, ocean modelling and GPS to assess sea level change around Tuvalu.
- Removing all the factors which affect short-term sea level fluctuation, the study authors found long-term sea level at Tuvalu from 1950-2009 rose at the rate of 5.1 (±0.7) mm per year. This almost 3 times greater than the global average sea level over that time of 1.8 mm per year.
- 10% of this 'total' sea level rise at Tuvalu is due to land subsidence
- Becker et al. (2012) builds on earlier work by Church (2006) , and the South Pacific Sea Level and Climate Monitoring Project, which also confirm that sea level at Tuvalu is rising.
Advanced rebuttal written by dana1981
Update July 2015:
Here is a related lecture-video from Denial101x - Making Sense of Climate Science Denial
Last updated on 4 November 2016 by pattimer. View Archives


The link Rob P posted to the Tuvalu post explains a lot about local sea level rise.
A comment on the OP here: I visited Funafuti in December 1988. Only a very small portion of the atoll is 3 meters above sea level as mentioned in the OP. Most of the island is much lower. According to this Wikipedia article, the average height of Funafuti is less than 2 meters (no date given). This climate report shows knee deep water in the center of town. The island is so small that water from rain runs off immediately, the water would be at sea level. Even in 1988 there were large areas in the village that regularly flooded at high tide. A rise of even a few centimeters would have been immediately noticable. Since they are dependent on ground water for many uses flooding would ruin their water supply.
When you combine that with the fact that the El Nino cycle can raise sea level 20-30 cm (as described in the OP), and consider similar storm surge increases in sea level, it is no wonder that the people of Tuvalu are concerned.