


 Arguments


Examining Hansen's prediction about the West Side Highway
What the science says...
Hansen was speculating on changes that might happen if CO2 doubled.
Climate Myth...
Hansen predicted the West Side Highway would be underwater
'What I can comment on is this prediction by Dr. Hansen: “The West Side Highway [which runs along the Hudson River] will be under water.” As you can clearly see in the Google Earth images, the West Side Highway remains dry and open. Sea level (at which the Hudson River at that point becomes) is not encroaching on the highway' (Anthony Watts)
James Hansen made his statement in response to a question by Bob Reiss, a journalist and author, in 1988. He did not predict that the West Side Highway would be underwater in 20 years.
Bob Reiss reports the conversation as follows:
"When I interviewed James Hansen I asked him to speculate on what the view outside his office window could look like in 40 years with doubled CO2. I'd been trying to think of a way to discuss the greenhouse effect in a way that would make sense to average readers. I wasn't asking for hard scientific studies. It wasn't an academic interview. It was a discussion with a kind and thoughtful man who answered the question. You can find the description in two of my books, most recently The Coming Storm."
James Hansen reports the conversation as follows:
"Reiss asked me to speculate on changes that might happen in New York City in 40 years assuming CO2 doubled in amount."
The book The Coming Storm and the salon.com article are different. In The Coming Storm the question includes the conditions of doubled CO2 and 40 years, while the salon.com article which is quoted by skeptics does not mention doubled CO2, and involves only 20 years.
To understand the discrepancy between these two published accounts, it helps to look at the timeline of events. The original conversation was in 1988. Ten years later, referring to his notes, Bob Reiss recounted the conversation in his book The Coming Storm. James Hansen confirmed the conversation and said he would not change a thing he said. After the book was published, Bob Reiss was talking to a journalist at salon.com about it. As he puts it,
"although the book text is correct, in remembering our original conversation, during a casual phone interview with a Salon magazine reporter in 2001 I was off in years.”
We can check back in 2028, the 40 year mark, and also when and if we reach 560 ppm CO2 (a doubling from pre-industrial levels). In the meantime, we can stop using this conversation from 1988 as a reason to be skeptical about the human origins of global warming.
References:
The Coming Storm by Bob Reiss, copyright 2001
Book review in Salon. Com: http://dir.salon.com/books/int/2001/10/23/weather/index.html
As reported by Anthony Watts:
Communication from James Hansen, January 26, 2011
Email from Bob Reiss, February 15, 2011
Last updated on 28 February 2011 by ClimateHawk.


Rob Honeycutt @25 ,
thanks for that info. I did come across a Dave Burton and his SeaLevel website a couple of years back (via the illustrious WUWT, iirc). But I soon gave up on his "sealevel" site, because the ratio of disinformation to information was excessively high.
Perhaps he is in the process of turning over a new leaf ~ and will now provide some useful scientific info & analysis. Hope springs eternal, eh.
Rob @ 25, Eclectic @ 26.
Oh, I think it is almost certain that our daveburton and "the other Dave Burton" are one and the same, but Tamino's posts give extensive detail that applies to daveburton's arguments whether it is the same person or not.
Tamino's posts also give considerable detail on the background of the other Dave Burton that give a pretty good idea of where the other Dave Burton's biases might originate. The other Dave Burton has peddled his wares at other blogs that I have seen - RealClimate, and And Then There's Physics.
Eclectic @26,
Indeed it can be hoped that people will turn over a new leaf if they developed a liking for and acted on a "...ratio of disinformation to information...".
it is important to appreciate that it is unacceptable for any presentation of misunderstanding to be paired with a lack evidence of a passion to learn to be corrected and evidence of significant interest and effort to limit and repair damage done by the incorrect belief and sharing of the misunderstanding.
Note that the seed for effective disinformation is a kernel of truth. No matter how much truth is part of a presentation of disinformation (a deliberate creation and sharing of misunderstanding) the presentation is still 'harmful disinformation'.
PR and marketing experts are well aware of the knowledge that "The Whole Truth and Nothing but the Truth" has a significant disadvantage in competitions for popularity or profit.
Michael wrote, "the last time Carbon dioxide was over 400 ppm the sea level was more than 20 meters higher than current sea level."
Yes, many things were different 4.5 million years ago. They weren't all caused by CO2.
For example, the highest-quality Pacific sea-level measurement record is from Honolulu, on Oahu. But it would be difficult to say anything meaningful about how sea-level there has changed since CO2 levels were last this high, because Oahu (and the Big Island) didn't exist 4 million years ago!
Michael wrote, "Your sea level graphs are obviously flawed."
I guarantee that they are not flawed.
They are accurate plots of sea-level measurements at those two sites, which are the best long NOAA Atlantic sea-level measurement record (The Battery, NYC), and the best long NOAA Pacific sea-level measurement record (Honolulu, HI). The linear and quadratic regressions are accurately calculated from the most recent 100 years of data at each site, shown with deep blue traces. Earlier data (not included in the regressions) is shown in light blue.
If you click the links, you can adjust the measurement periods over which the regressions are calculated, and see the effect of those adjustments. You can also smooth the plots, and choose whether to plot linear and/or quadratic fits, as well as confidence and/or prediction intervals. At the top of each graph you'll also find links to the corresponding NOAA and PSMSL web pages for those sites. You can also do the same analyses for other NOAA measurement sites, and for over 1000 sites with data available from PSMSL (though the PSMSL data aren't as up-to-date as the NOAA data).
Michael wrote, "you have cherry picked two single locations to do your calculations without justifying your choice."
They aren't "cherry-picked," I told you why I chose them: they are "the best long U.S. Atlantic and Pacific sea-level measurement records, respectively."
The analysis period of 100 years is arbitrary, of course, but if you click the links which I provided you can easily change it:
https://sealevel.info/MSL_graph.php?id=Battery&c_date=1923/6-2023/5
https://sealevel.info/MSL_graph.php?id=Honolulu&c_date=1923/6-2023/5
I also reported the conclusion of a comprehensive study: "Hogarth studied many long measurement records, and concluded, 'Sea level acceleration from extended tide gauge data converges on 0.01 mm/yr²'" (That's negligible, BTW.)
Beware of "global" sea-level analyses which use varying mixes of measurement locations. As you can see from the striking difference between Oahu and New York, sea-level trends vary considerably from one location to another. So if you use a different mix of measurement locations for the left and right ends of a plot, you can easily create the illusion of a sharp acceleration or deceleration which is not evident in the individual measurement records.
Also, beware of the fact that there are also regional effects, in some places. For example, ENSO causes changes in low-latitude easterly Pacific trade winds. During El Niños easterly Pacific equatorial trade winds diminish, so the Pacific ocean sloshes east, raising sea-level in the eastern Pacific, and lowering it in the western Pacific. This is very striking when you compare the sea-level measurement records of Kwajalein (in the western Pacific) and San Diego (in the eastern Pacific). They are almost perfect mirror images!
https://sealevel.info/1820000_Kwajalein_San_Diego_2016-04_vs_ENSO_annot4.png
(One of the nice things about Honolulu is that it is near the ENSO "teeter-totter pivot point," so, unlike other long Pacific sea-level measurement records, Honolulu's is scarcely affected by ENSO.)
Another example of regional effects is the southeastern United States, where Gulf Stream variations are apparently the cause of well-known multi-decadal fluctuations in sea-level trends. For a discussion see Zervas (2009), NOAA Technical Report NOS CO-OPS 053, Sea Level Variations of the United States, 1854-2006. Here's a relevant excerpt:

Indeed, Daveburton, the sea level is a complex subject. I applaud the detailed work you have done on some aspects of it.
Nevertheless, Dave, you have taken a relatively short-term look at some trees ~ while entirely failing to look at the forest. And failing to take a commonsense look at the underlying physics : the causes of long-term changes.
I am fairly sure you are not the Flat-Earth Scientist who completely discounts the role of CO2 in climate & consequent sea level changes (despite you consciously /subconsciously "trailing your coat" at the start of post #29 ).
My worry (for you) is that you have been "captured" by Motivated Reasoning . . . and that for a number of years now, you have not climbed out of the rabbit-hole.
So . . . good luck for self-examining your inner emotions & motivations. A scientific thinker must rise above his inner bias.
As OnePlanet says, it is the half-truths which are the danger [to one's own self, especially].
Dave @29... Here you're playing the classic science denier game of cherry picking facts that support the conclusion you prefer. Your graphs are technically correct but intentionally misleading because you're using them outside of the full context of the issue at hand.
If, on the absurd chance, you actually believe what you're presenting is compelling evidence then it is encumbent upon you to publish your findings in a legitimate science journal and convince a panel of experts that your findings are significant.
Given you've been doing this for something over a decade now I would have expected your position to become more substantive and nuanced. But it's not. You're regurgitating the same junk you've been posting all over the internet this entire time.
This leads me to believe you're not genuinely interested in facts or science. You're merely promoting an ideological position and you think this is an interesting way to do that.
Once again, this is not ad hom. Lots of people do exactly what you're doing and they (and you) have every right to do so. All any of us are doing is pointing out how weak your position is.
DaveBurton:
You are wastiing our time here with your obvious, deliberately incorrect graphs. I note that Tamino specifically addressed your deliberate mistakes as long as a decade ago. You have been wrong for over a decade and you are not informed enough to realize it. You have no excuse for your false claims. Neutral observers wonder why you persist in your obviously false claims for so long.
No-one here will give your garbage a second consideration. You will not convince anyone with your absurd claims. You need to go back to WUWT where they do not care about being lied to.
Every scientist who studiies sea level rise states that sea level rise has accelerated substantially. When you are alone claiming something and everyone who studies the topic professionally states that you are wrong you need to realize that you are not Galileo, you are simply wrong. Look at the pictures of fish in the streets all over the world.
You should go away. You contaminate a scientific site with pretend analysis.
[BL] Please tone down the accusations a bit.
daveburton @ 29:
You seem to be under some serious delusions as to what the words "best", and "accurate" really mean.
You have no objective criteria to declare that The Battery and Honolulu are "the best" at representing anything other than local effects. Just because they have long records does not mean that they accurately reflect regional or global trends. You also state:
So, you admit that single locations do not provide global trends - yet you seem to be arguing that the "best" way to get global trends is to ignore most of the other data.
You are clearly picking locations to try to tell the story you want to tell. That is not "accurate".
As for your quadratic fits: it has been pointed out to you over the past 10 years that quadratic fits mean nothing when the underlying data does not resemble a quadratic relationship. It does not matter if you "accurately" calculated the quadratic fit when the underlying physics says "not quadratic".
This discussion is also getting off topic for this rebuttal of Hansen's statement. If you want to continue to discuss sea level, there are better places here at SkS. Here are two SkS posts that provide some of the material from Tamino that I referred to earlier.
Has sea level rise accelerated since 1880?
Is sea level rise accelerating?
Philippe Chantreau wrote, "I will respond to Dave Burton on the CO2 fertilization thread on the part of this latest post regarding that subject."
Will you please provide a link to your comment to me, Philippe?
[Major snip]
Rob Honeycutt wrote, "1) That is not an image that appears in AR6, not with the added orange box. Thus you're co-opting their work to infer conclusions they do not make."
That's incorrect.
Since we're onto the next page of comments now, here's the image again:
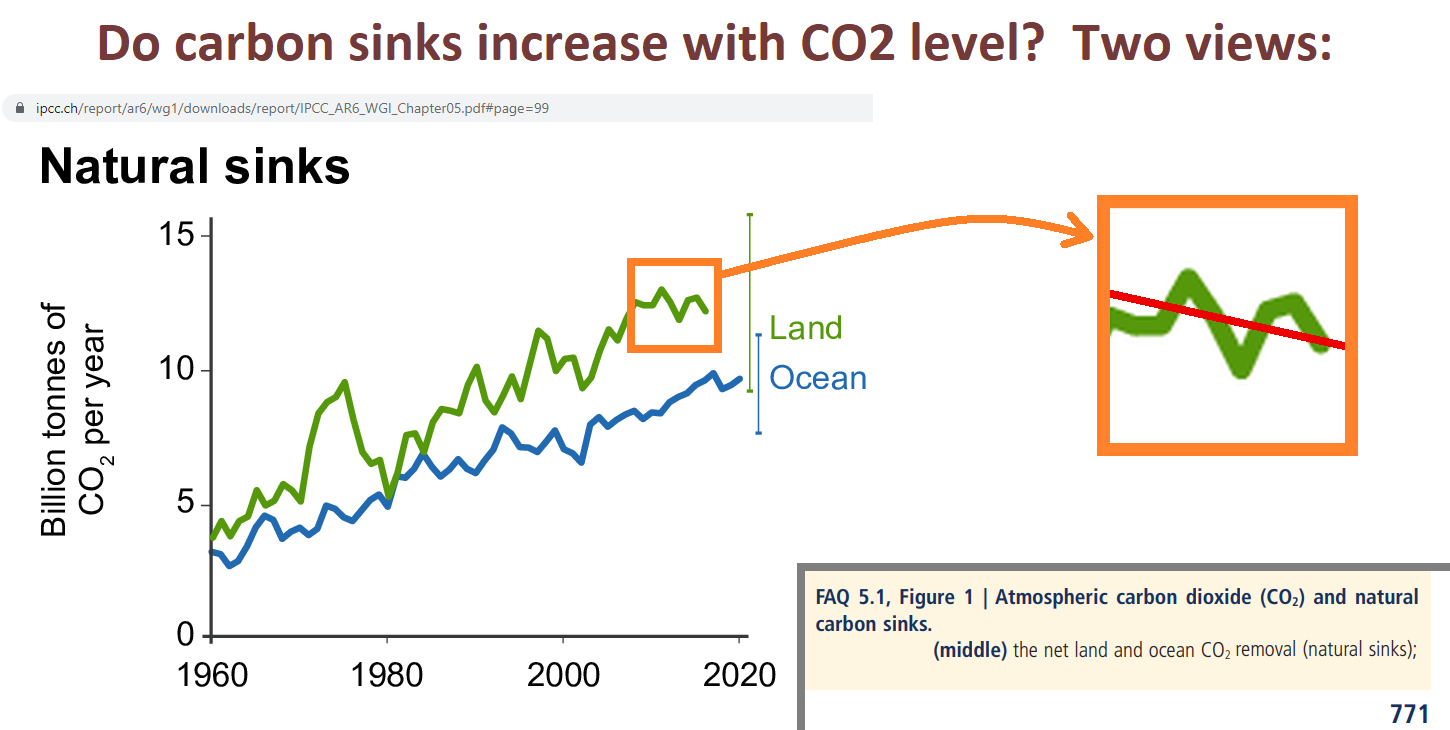
https://sealevel.info/AR6_FAQ_5p1_Fig_1b_final2.png
If you enlarge it you can see, in fine print, the URL that will take you to where you can find it in chapter 5 of AR6:
https://www.ipcc.ch/report/ar6/wg1/downloads/report/IPCC_AR6_WGI_Chapter05.pdf#page=99
I added the orange box to highlight the (small) part of the image which supports your contention that, "greening is now turning into 'browning.' ... fertilization [has now been] overwhelmed by other effects... In other words, the greening has now stopped."
AR6 directly contradicts your contention, Rob. In fact, it does so in the caption on that very figure:
They could not have been clearer in stating that natural removal of carbon from the atmosphere is NOT weakening.
The authors did PREDICT a "decline" in the FUTURE, "if" emissions "continue to increase." But that hasn't happened yet, and the "decline" which they predicted was NOT for the rate of natural CO2 removals by greening and marine sinks, anyhow. Rather, that hypothetical decline was predicted for the ratio of natural removals to emissions, and their prediction is conditional, depending on what happens with future emissions ("if CO2 emissions continue to increase").
Well, predictions are cheap. My prediction is that natural removals of CO2 from the atmosphere will continue to accelerate, for as long as CO2 levels rise.
The "fraction" which they predict might decline, someday, doesn't represent anything physical, anyhow. (It is one minus the equally unphysical "airborne fraction.") Our emission rate is currently about twice the natural removal rate, so if emissions were halved, the removal "fraction" would be 100%, and the atmospheric CO2 level would plateau. If emissions were cut by more than half then the removal "fraction" would be more than 100%, and the CO2 level would be falling.
Rob, it's possible that your confusion on the greening/browning point was due to a widely publicized paper, with an unfortunately misleading title:
Wang et al (2020), "Recent global decline of CO2 fertilization effects on vegetation photosynthesis." Science, 11 Dec 2020, Vol 370, Issue 6522, pp. 1295-1300, doi:10.1126/science.abb7772
Many people were misled by it. You can be forgiven for thinking, based on that title, that greening due to CO2 fertilization had peaked, and is now declining.
But that's not what it meant. What it actually meant was that the rate at which plants remove CO2 from the atmosphere has continued to accelerate, but that its recent acceleration was less than expected. (You can't glean that fact from the abstract; would you like me to email you a copy of the paper?)
What's more, if you read the "Comment on" papers responding to Wang, you'll learn that even that conclusion was very dubious:
Sang et al (2021), "Comment on 'Recent global decline of CO2 fertilization effects on vegetation photosynthesis'." Science 373, eabg4420. doi:10.1126/science.abg4420
Frankenberg et al (2021), "Comment on 'Recent global decline of CO2 fertilization effects on vegetation photosynthesis'." Science 373, eabg2947. doi:10.1126/science.abg2947
Agronomists have studied every important crop, and they all benefit from elevated CO2, and experiments show that the benefits continue to increase as CO2 levels rise to far above what we could ever hope to reach outdoors. Perhaps surprisingly, even the most important C4 crops, corn (maize) and sugarcane, benefit dramatically from additional CO2. C3 plants (including most crops, and all carbon-sequestering trees) benefit even more.
Bob Loblaw wrote, "...I have no way of knowing whether our daveburton is the same Dave Burton seen in the discussions at Tamino's... The other Dave Burton's name shows up quite a few times, although he does not comment."
Yes, I'm the Dave Burton who Tamino intermittently criticizes. Unfortunately, when I try to comment on his blog, he nearly always deletes my comments, so I stopped trying. Suffice to say, if you like being misled, you should enjoy his blog. (Example.)
[BL] All of this is off-topic for this thread.
Use the search function to find appropriate threads. You have already been pointed to several options.
Dave... Some abbreviate response is posted on THIS thread. Please go there if you wish to further discuss CO2 fertilization.
I have had many other things to do, certainly more important. I have a full time job and a life. I will respond in time. Perusing through the references presented, I was not very impressed.
Bob Ludlow wrote
[Contents snipped]
"You have no objective criteria to declare that The Battery and Honolulu are "the best" at representing anything other than local effects..."
The Battery has 1825 months of sea-level measurements. No other NOAA Atlantic site has that much. Only San Francisco has more, but it has only 1404 months of measurements since the 1906 earthquake. The downside to The Battery's measurement record is its high (atypical) rate of subsidence, which roughly doubles the local ("relative") sea-level trend there.
There are some European sites with longer, better Atlantic / North Sea / Baltic measurement records, and Australia has an excellent Pacific measurement record, but there are substantial delays getting data for those locations. My sealevel.info stie pulls data from NOAA frequently, so it's much more up-to-date.
Some of the European sites, have recorded a slight acceleration; it was most noticeable at Brest, which saw a 0.0 mm/year trend in the19th century, but a 1.6 mm/year trend since then, though there are substantial gaps in ther record.
Several German sites have particularly excellent measurement records; here's one of them:
In the Pacific, Honolulu has 1421 months (>118 years) of continuous sea-level measurements, without even a single missing month. Just as importantly, Honolulu is a near-ideal measurement site, near the middle of the world's largest ocean, on an "old" island with near-zero vertical land motion, small tides, and (unlike most places!) almost no seasonal cycle. What's more, its mid-Pacific location is near the pivot point of the east-west Pacific "teeter-totter," so it is little affected by ENSO "slosh." That is, El Niño and La Niña don’t affect sea-level there much at all. It really is a superb dataset.
Bob continued, "Just because they have long records does not mean that they accurately reflect regional or global trends."
That's true. As I've mentioned, NYC's sea-level trend is atypical, because of the high rate of subsidence there.
However, if subsidence / uplift are due to very long term processes, like PGR, there's reason to hope that they are fairly consistent over the duration of the measurement record. In that case, even if the linear trend is greatly affected by uplift or subsidence, the acceleration won't be. (Of course, that doesn't work in places, like Manila, where changing local factors, like groundwater pumping, cause varying subsidence.)
So it should not surprise you that, even though The Battery and Honolulu have seen quite different linear trends over the last century, the measured acceleration in both places is very similar (negligible).
Bob wrote, "You are clearly picking locations to try to tell the story you want to tell."
That's a false accusation. You just find the data surprising, so you make baseless accusations, without evidence. That is not conducive to constructive dialogue, nor to learning.
If you think I chose unrepresentative sites, or sites with inferior quality measurement data, then YOU tell me what sites YOU think are better, and why.
Bob wrote, "As for your quadratic fits: it has been pointed out to you over the past 10 years that quadratic fits mean nothing when the underlying data does not resemble a quadratic relationship."
Nobody competent makes that claim in the context of sea-level analysis.
If there were a step-change in some climate system input, then you could look for a step-acceleration as a consequence. But there's been nothing like that. The radiative forcing trend from CO2 has been very gradual, and strikingly linear (just barely more than linear) for the last forty years. It's been quite gradual for much longer than that.
Quadratic regression is the cannonical way of detecting gradual acceleration. It's how Church & White did it, and how every competent sea-level analyst since then has done it. When Hogarth reported that, "sea level acceleration from extended tide gauge data converges on 0.01 mm/yr²," that's what he was talking about.
[BL} I see that reading comprehension is not one of your strong points.
Assuming that "Bob Ludlow" is supposed to mean "Bob Loblaw", you will also note that I said:
The next off-topic post be be deleted in its entirety.
One of the "BL"s here wrote, "[Major snip] Response: [BL] All of this is off-topic for this thread."
And that is why SkS is not on my list of recommended climate change blogs.
You left Rob Honeycutt's accusations, but deleted my response to them.
You left Bob Loblaw's speculation about my identity, but deleted my response.
If this is not the right thread for the replies to those comments, then how can it be the right thread for them to make those comments, BL?
[BL] Moderation complaints snipped.
Please note that posting comments here at SkS is a privilege, not a right. This privilege can and will be rescinded if the posting individual continues to treat adherence to the Comments Policy as optional, rather than the mandatory condition of participating in this online forum.
Moderating this site is a tiresome chore, particularly when commentators repeatedly submit offensive or off-topic posts. We really appreciate people's cooperation in abiding by the Comments Policy, which is largely responsible for the quality of this site.
Finally, please understand that moderation policies are not open for discussion. If you find yourself incapable of abiding by these common set of rules that everyone else observes, then a change of venues is in the offing.
Please take the time to review the policy and ensure future comments are in full compliance with it. Thanks for your understanding and compliance in this matter.