Climate Science Glossary

Term Lookup

Enter a term in the search box to find its definition.

Settings

Use the controls in the far right panel to increase or decrease the number of terms automatically displayed (or to completely turn that feature off).

Term Lookup

Settings


All IPCC definitions taken from Climate Change 2007: The Physical Science Basis. Working Group I Contribution to the Fourth Assessment Report of the Intergovernmental Panel on Climate Change, Annex I, Glossary, pp. 941-954. Cambridge University Press.

Home Arguments Software Resources Comments The Consensus Project Translations About Support

Twitter Facebook YouTube Mastodon MeWe

RSS Posts RSS Comments Email Subscribe


Climate's changed before
It's the sun
It's not bad
There is no consensus
It's cooling
Models are unreliable
Temp record is unreliable
Animals and plants can adapt
It hasn't warmed since 1998
Antarctica is gaining ice
View All Arguments...


Username
Password
New? Register here
Forgot your password?

Latest Posts

Archives

Are CO2 levels increasing?

What the science says...

Currently, humans are emitting around 29 billion tonnes of carbon dioxide into the atmosphere per year. Around 43% remains in the atmosphere - this is called the 'airborne fraction'. The rest is absorbed by vegetation and the oceans. While there are questions over how much the airborne fraction is increasing, it is clear that the total amount of CO2 in the atmosphere is increasing dramatically. Current CO2 levels are the highest in 15 million years.

Climate Myth...

CO2 is not increasing

"...there is the contention by Wolfgang Knorr of the Department of Earth Sciences at the University of Bristol in England that carbon dioxide levels in the atmosphere are about where they were 160 years ago." (as quoted by Ken Ward Jr.)

The 'airborne fraction' refers to the amount of human CO2 emissions remaining in the atmosphere. Approximately 43% of our CO2 emissions stay in the atmosphere with the rest being absorbed by carbon sinks. But is the airborne fraction increasing? A paper published in November 2009 found no statistically significant trend (Knorr 2009). Anthony Watts labeled this result the "Bombshell from Bristol" - A potentially devastating result for anthropogenic global warming. Was it such a shock? The 2007 IPCC verdict on the airborne fraction was "There is yet no statistically significant trend in the CO2 growth rate since 1958 .... This 'airborne fraction' has shown little variation over this period." (IPCC AR4) I'm not sure the move from "not much happening" "to "still not much happening" warrants the label "bombshell".

The airborne fraction is calculated from the rate of human CO2 emissions and changes in atmospheric CO2 concentration. The global increase in atmospheric CO2 has been directly measured since 1959 and can be calculated from ice cores for earlier periods. Primarily, CO2 emissions come from fossil fuel combustion with a lesser contribution from land use changes. Fossil fuel combustion is calculated from international energy statistics. CO2 emissions from land-use changes are more difficult to estimate and come with greater uncertainty. Land use emissions are estimated using deforestation and other land-use data, fire observations from space and carbon cycle modeling.

There have been several recent studies determining the airborne fraction. Trends in the sources and sinks of carbon dioxide (Le Quere 2009) examines the airborne fraction from 1959 to 2008. This period was chosen as we have directly measured atmospheric CO2 levels over this time. Fossil fuel emissions rose steadily in recent decades, contributing 8.7 ± 0.5 gigatonnes of carbon in 2008. This is 41% greater than fossil fuel emissions in 1990. CO2 emissions from land use was estimated at 1.2 ± 0.4 gigatonnes of carbon in 2008. Note the proportionally higher uncertainty compared to fossil fuel emissions.

Over this period, an average of 43% of each year's CO2 emissions remained in the atmosphere although there is much year-to-year variability. The noise in the airborne fraction was reduced by removing the variability associated with El Nino Southern Oscillation (ENSO) and volcanic activity. They found the airborne fraction increased by 3 ± 2% per decade. This is a slightly increasing trend although only barely statistically significant .

Knorr 2009 extends this analysis back to 1850 by combining direct CO2 measurements from Mauna Loa and the South Pole with CO2 data derived from Antarctic ice cores. This enabled Knorr to compare CO2 emissions to atmospheric CO2 levels for the past 150 years.
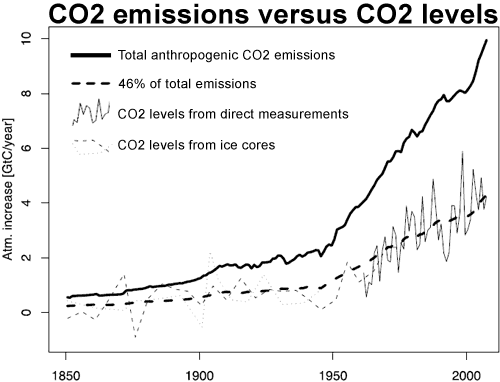

Figure 1: Observed increase atmospheric CO2 derived from direct measurements, taking the average of Mauna Loa (Hawaii) and the South Pole (thin solid line) and two ice cores: Law Dome (dashed thin line) and Siple (thin dotted line). This is compared to total anthropogenic emissions (thick solid line) and 46% of total emissions (thick dashed line). (Knorr 2009)

Knorr finds that since 1850, the airborne fraction has eemained relatively constant. When CO2emissions were low, the amount of CO2absorbed by natural carbon sinks was correspondingly low. As human CO2 emissions sharply increased in the 20th Century, the amount absorbed by nature increased correspondingly. The airborne fraction remained level at around 43%. The trend since 1850 is found to be 0.7 ± 1.4% per decade.

There are several differences in methodology between Knorr 2009 and Le Quere 2009. Knorr's result does not include the filtering for ENSO and volcanic activity employed by Le Quéré. However, when Knorr does include this filtering in his analysis, he finds a trend of 1.2 ± 0.9% per decade. This is smaller than Le Quere's result but is statistically significant.

Knorr also finds the 150 year trend while Le Quéré looks at the last 50 years. This may be significant. If the airborne fraction is increasing, it is possibly a recent phenomenon due to natural carbon sinks losing their absorption ability after becoming saturated. Several studies have found recent drops in the uptake of CO2 by oceans (Le Quere 2007, Schuster 2007, Park 2008). However, with such a noisy signal, this is one question that will require more data before being more fully resolved.

Lastly, some perspective. There are still areas of uncertainty associated with the carbon cycle. Because of this uncertainty, scientists are currently debating whether the airborne fraction is steady at 43% or slightly Increasing from 43%. Unfortunately, some skeptics use this uncertainty to hold the position that the airborne fraction is closer to 0%.

Intermediate rebuttal written by John Cook


Update July 2015:

Here is a related lecture-video from Denial101x - Making Sense of Climate Science Denial

Additional videos from the MOOC

Andy Skuce: The CO2 rise is man man-made

Interviews with various experts

Expert interview with Corinne Le Quéré

Last updated on 8 July 2015 by pattimer. View Archives

Printable Version  |  Offline PDF Version  |  Link to this page

Argument Feedback

Please use this form to let us know about suggested updates to this rebuttal.

Comments

1  2  Next

Comments 1 to 25 out of 42:

  1. Based on CBD's comment:
    "There is a hemispheric seesaw in CO2 as spring and summer in each hemisphere allow plants to grow and absorb CO2 while fall and winter see plants dying and releasing CO2."
    I thought I would kick off this thread with some visual evidence of this seesaw: This one, using 2008 CarbonTracker data, animates changes over time. View is global, looking down. This one, from the GlobalView-CO2 Project (using data from 1979 to 2006), also animates changes over time. View is horizontal, pole-to-pole. A neat way to present a similar concept, but in a different way. I'll link this back to CBD's post on the other thread. The Yooper
  2. "The 'airborne fraction' refers to the amount of human CO2 emissions remaining in the atmosphere." Denial of increasing atmospheric CO2 levels is absurd, but absurdity is a common theme among deniers. But in referring to an increase in the 'airborne fraction', you're really addressing the declining ability of natural 'sinks' to absorb excess CO2. Europe seems way ahead of the rest of the world in quantifying this: Researchers from 17 European countries cooperating in the EU-Integrated Project CarboEurope ... have compiled the first comprehensive greenhouse gas balance of Europe. Key findings: Net European sinks of CO2 only amount to 15% of fossil fuel emissions. For the EU as a whole, the sink capacity is only 11% of CO2 emissions. As sinks are degraded, airborne fraction must rise.
  3. Canadell et al. 2007 document the degrading of carbon sinks since 1960: We estimate that 35+/-16% of the increase in atmospheric CO2 growth rate between 1970–1999 and 2000–2006 was caused by the decrease in the efficiency of the land and ocean sinks in removing anthropogenic CO2 (18 +/- 15%) and by the increase in carbon intensity of the global economy (17 +/- 6%). The remaining 65 +/- 16% was due to the increase in the global economy.
  4. The problem with the use of ice cores as a proxy for CO2 measurements is that the ice is unavoidably contaminated by liquid water. Dr. Zbigniew Jaworowski of the Central Laboratory for Radiological Protection (CLOR) in Warsaw, Poland, in written testimony submitted to a U.S. Senate committee in March 2004 said: "Determinations of CO2 in polar ice cores are commonly used for estimations of the pre-industrial CO2 atmospheric levels. Perusal of these determinations convinced me that glaciological studies are not able to provide a reliable reconstruction of CO2 concentrations in the ancient atmosphere. This is because the ice cores do not fulfill the essential closed system criteria. One of them is a lack of liquid water in ice, which could dramatically change the chemical composition the air bubbles trapped between the ice crystals. This criterion, is not met, as even the coldest Antarctic ice (down to -73°C) contains liquid water. More than 20 physico-chemical processes, mostly related to the presence of liquid water, contribute to the alteration of the original chemical composition of the air inclusions in polar ice." Since global-warming evidence of C02-levels rests exclusively in ice-core samples, then this argument proves its Achilles-Heel.
    Response: Moderator Response: You have posted related claims about ice cores in at least five different threads on this site. Please do not spread discussions of a single, narrow topic across many different threads. Another commenter (KR) has already responded to your claims in the thread where you first posted this material (What does past climate change tell us about global warming?), so it would be a good idea to respond there. Thank you.
  5. @KirkSkywalker: Zbigniew Jaworowski's views on the validity of ice core samples are hotly contested, and do not represent the current state of the science. There's no real reason to doubt the validity of ice cores samples with regards to CO2 levels in the last 600,000 years. It's all about evidence, and Jaworowski doesn't have much to support his claims (and neither do you).
  6. Make up your mind, Captain Kirk. Elsewhere just a few minutes ago you said the problem w/ice cores is sublimation of CO2, here something different. It's ruinous to your credibility when you spew hypotheses willy-nilly.
  7. KirkSkywalker, just one of several places you can find details of the problems with Jaworowski's claims is by Jim Easter.
    Response: Thanks to all three of you for responding to KirkSkywalker's comment. However, in the interests of not diffusing this discussion all over the site, let's redirect any additional comments to the thread where KirkSkywalker first posted on this subject (What does past climate change tell us about global warming?).
  8. This is my response to a comment by NETDR on another thread, as my attempt to move that conversation to this appropriate thread. Tamino wrote an excellent post demonstrating that CO2 rise is exponential, not linear.
  9. Here's a good illustration of the changes in atmospheric CO2 concentration over time (h/t to Lou Grinzo for alerting me to this much-updated animation): You can literally watch the Earth "breath"... The Yooper
  10. #8 Tom Dayton http://www.woodfortrees.org/plot/esrl-co2/from:1958/to:2010/plot/esrl-co2/from:1958/to:2010/trend The increase from 1958 to 2010 is a good indication of modern trends in CO2. It is the biggest "cherry " we have accurate data for. Before that the sites jump around and are hit and miss. How do thy correlate and is one the same as another on the same day ? I doubt it. Besides the argument is what is the trend now not 1,000 years ago ? The argument is that since the effect of CO2 is logarithmic and the increase in CO2 is almost linear the rate of warming should slow down in later years. I wish woodfortrees had a handy app for this but they don't. I pulled the CO2 data for 58 years into excel and did a simple log of the data. If the rate is increasing exponentially with a large enough exponent we should see a straight line output indicating increasing warming. The slope should tell us how log it would take to have a doubling of effect. In other words If y=X^2 and T = log(y) In this test case T is a straight line with a steep slope. [About 3/10 ] If this were the case I would agree this would show that the geometric increase in CO2 would cancel out the logarithmic effect of CO2. If however the effective warming [T] is almost flat the world has little to fear. If I take the data set in to Excel and take the log of the 58 years of data I get a straight line with very little slope [.09 / 58 years or .00155 per year ] at that rate a doubling of effect would take thousands of years. Go to the Mona Loa site and download the data and check me. This indicates to me that we have little to fear from CO2 causing rising temperatures for many hundreds of years.
  11. NETDR, this thread is about the rate of increase in CO2. You had claimed on another thread that CO2 is increasing nearly linearly. I pointed you to a very thorough analysis by a professional time series statistician, showing unequivocally that the increase is exponential. You completely ignored that, instead meandering off into something about doubling the effect of CO2 and something about temperature.
  12. #10: "The slope should tell us how log it would take to have a doubling of effect." Yes, linear trends can be used to extrapolate forever. How's that working for you in the stock market? Bet you won't get a linear fit to these data: . We add more than 2ppm/year and that rate is increasing. Go to the MLO site and look at the annual rate of change. Then go look at an Arctic site like BRW, where the annual rate change is even larger. Look at how the fossil fuel consumption rates are rising worldwide and project forward. Look at how the oceans/biosphere aren't taking as much CO2 out of the atmosphere as they once were. Then tell us when we'll be at 560 ppm. But why do you even care about atmospheric CO2? Is that 'rampy-siney thing' not working for ya?
  13. Tom Dayton It is no digression. The warming of CO2 is proportional to the log of the amount of CO2. By taking the log of the CO2 we see how fast the warming can take place all other things being equal. The rate may be exponential but if the exponent is very small the increase in warming is itself slow and probably not a problem. This seems to be the case. Taking the log of an exponential function shows us the exponent. The increase in value of this log is an indication of the rate of warming Now go back and read my previous post #10 again.
  14. muoncounter(12#) 170 PPM to get to 560 ppm, so we increase around 2 PPM per year. S0 170/2=85 years give or take. We will get there near 2095-2096.
  15. "The rate may be exponential but if the exponent is very small the increase in warming is itself slow and probably not a problem" The final equilibrium temperature depends on the accumulated amount of CO2 in the atmosphere, not the rate of increase. If the accumulation is fast, then equilibrium will be reached more quickly, of course. We'll be reaching a doubling of CO2 compared to pre-industrial levels this century, and at that point will be committed to about a 3C global rise in temps, with the average temperature over land in the NH being much higher than that (say, double). You claim this is "slow and probably not a problem". Many, many experts say otherwise. I'll listen to the experts rather than someone who tries to wave away exponential increases in the rate of accumulation of CO2 as being "nearly linear".
  16. 15 dhogaza Yes I do claim it will be slow and not a problem. The maximum warming with ADO PDO and a monster El Nino and sunspots the largest in recorded history only made the 1978 to 1998 warming rate 1.2 ° C per century. I am underwhelmed. Mother nature did everything she could to help your puny CO2 and that is the best it can do ? No wonder when the ADO and PDO go negative the rate of warming goes flat or negative !
    Response: You are incorrect that solar activity since 1978 contributed to warming. See "It's the Sun" and especially "Climate Time Lag."
  17. #14: "we will get there... " You missed the part about 'and that rate is increasing'? So the bets are in as to when 560 ppm will happen. In the words of that great American philosopher, Dirty Harry: "You gotta ask yourself one question, do I feel lucky?"
  18. Reply to comment here. "is it about 40% absorbed, 5.23*(0.4) ~ 2.0?" Actually, the most recent increase is back up to 2.3 ppm/year, a sure sign that the recession is ending. And the ~40% absorption is an average; it will vary by several points from year to year. Take the world's annual CO2 emissions in Gtons, convert to ppm by volume and divide. You can't make this increase -- and the inescapable fact that we are its source -- go away by a few back-of-the-envelope calculations.
  19. mozart - Reply here, as it's a much more appropriate thread. It's well worth reading the topic, also see the video in post #9, also graphs in #12, and in particular #17. Exponential growth has a nasty effect of slamming in hard down the line, much more people expect. Your CO2 emissions scenarios are grossly overoptimistic.
  20. Ten years ago we would have said the curve was flat....and it's an odd explosive growth model that has it's highest observation 13 years ago in 1998.
    Response: [Daniel Bailey] Not at all flat; current levels are the highest in over 400,000 years (you must be looking at the South Pole station data curve):
  21. #20: "it's an odd explosive growth model that has it's highest observation 13 years ago in 1998" Odd indeed. So odd that one can only conclude that the observation you made must be incorrect. If you cared to look upthread, you would see that models are very close to observed (those are the dots on the emissions graph). If we stay at or near A1FI, we reach 560ppm (a doubling of pre-industrial CO2) mid century. That's what the science says; what you choose to believe is your own. I refer you once again to the noted futurist, H. Callahan, as quoted at the bottom of this comment.
  22. Mozart - Firstly the "percentage" arguments are smoke and mirrors. ppm for pre-industrial(1830) is 280, 560 is double that. Growth from 1830 to 1950 was 30ppm - 10% and 0.25ppm/yr Growth from 1950 to 2000 was 55ppm - 20% and 1.1 ppm/yr Growth from 2000 to 2010 was 25ppm - 9% and 2.5 ppm/yr Still need another 60% to get to doubling, but at 2.5ppm per year, this takes 66 years. Where did you get the idea CO2 rates were flat 10 years ago? Another assertion without evidence. Why exactly do you think that China and India (or US for that matter) will stop burning coal? Anyway, the point of SRES scenarios is that you can take the scenario that you think is best likely to describe the future (by looking at the assumptions it makes, not wishful thinking) and then looking at WG2 to see what world would look like with that scenario.
  23. Delightful news: Jan 2011 CO2 = 391 ppm; an annual increase of 2.7 ppm/year. Yes, the recession is over. Do we break 395 this year?
  24. @ 23 Given the 2010 Amazon drought, another year of oceanic warming (especially in the polar oceans)...I say yes. Followed by a 50/50 shot at 400 in 2012. Speaking of 400, who's turn is it to watch Teddy Ballgame's head anyway? The Yooper
  25. #24: "Teddy Ballgame's head" That would be 406; not 'til 2014 by a long shot. By now our Aussie friends must think that Yanks speak in code.

1  2  Next

Post a Comment

Political, off-topic or ad hominem comments will be deleted. Comments Policy...

You need to be logged in to post a comment. Login via the left margin or if you're new, register here.

Link to this page


The Consensus Project Website

THE ESCALATOR

(free to republish)


© Copyright 2024 John Cook
Home | Translations | About Us | Privacy | Contact Us