


 Arguments


Mauna Loa and global network of CO2 measurements
What the science says...
| Select a level... |
 Basic
Basic
|
 Intermediate
|
 Advanced
| ||||
|
Due to its location at high altitude and in the middle of the ocean, Mauna Loa proved to be an excellent place for background CO2 measurements. The influence of the volcano is easily spotted and removed, together with other even more important spurious influences. The Mauna Loa CO2 record is considered one of the best records in climate science. |
|||||||
Mauna Loa is a volcano
'Mauna Loa has been producing a readout which supports Manning's predetermined goal by showing steady growth in atmospheric CO2 concentrations since 1959. Just thirty miles from the observatory, Kilauea's Pu`u O`o vent sends 3.3 million metric tons of CO2 into the atmosphere every year. Pu`u O`o sends into "the undisturbed air" near "the remote location" the equivalent to yearly CO2 production from an average city of 660,000 people.' (Andrew Walden)
Thinking that the Mauna Loa record is affected by the presence of the volcano implies that Keeling didn't notice it. Keeling was looking for the best places where to perform accurate background CO2 measurements; he picked two, Antarctica and Mauna Loa. To understand why the Mauna Loa record is so accurate and representative of the northern hemisphere background CO2 concentration, we need to know how the measurements are performed and how they are analyzed.
First I'll start with the obvious advantages of the Mauna Loa Observatory (MLO) as a place to measure the background CO2 concentration. It's on an island in the middle of the ocean; it's at high altitude; no vegetation whatsoever around (take a look at these nice pictures of the site). In this way human and vegetation influences are minimized.
But yes, the MLO sits on a volcano and we all know that volcanoes have the bad habit to pour (among other things!) CO2 in the atmosphere. When the instrument happens to be downwind from a source of CO2 (yes, they also measure wind intensity and direction up there), it detects wild and rapid fluctuations of the concentration due to the turbulent mixing of the air. These fluctuations are easily identified and eliminated.
Strangely enough, this is not the hardest problem to solve. A more subtle effect is due to the diurnal cycle of the winds along the slopes of the mountain. After sunrise, the rising air from the warming land causes the winds to go uphill. Due to the diurnal photosynthesis cycle, this air is impoverished of CO2. After sunset this process reverses and the winds going downhill bring "clean" air from higher altidudes.
CO2 concentration measurements are taken continuously but are analyzed on a hourly basis. Keeping in mind that what they want to measure is the background concentration, on these short time scales large changes are not expected. The standardized data selection procedure follows four steps:
- the standard deviation of minute averages should be less than 0.30 ppm within a given hour. Flag "V" if not met;
- the hourly average should differ from the preceding hour by less than 0.25 ppm. Flag D" if not met;
- data point during hours of uphill winds are flagged with a "U";
- a curve is fitted to the preliminary daily mean excluding data points that did not survive step 1 and 2 or are flagged at step 3. All hourly averages that are further than two standard deviations away from the fitted curve are rejected. This step is iterated untill no more rejections occur. Rejected data flagged "A".
After data selection they build the other averaged datasets. Anyway, no raw data point is lost, they're all archived here, each with the appropiate flag. (Note: there is an important file in that directory, it is called "README" for a reason, read it!).
To visually see the impact of the data selection procedure, in the figure below I show both the full and the final datasets for year 2009. (Hours with no data are not shown)
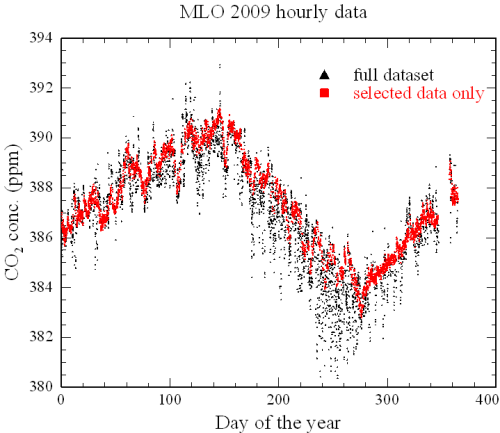
Over the 8760 hours of 2009, 534 data points are rejected from step 1, 916 from step 2, 1147 from step 3, 772 from step 4 and 652 were missing (instrument failure, maintenance, etc.) . The final dataset includes 4735 data points. It is immediately apparent that the CO2 impoverished air coming upslope has the largest impact.
Whenever possible, scientists want to confirm their findings by independent reproductions of their results. From time to time, usually weekly, two samples of air are taken and sent to a laboratory in Boulder, Colorado. One comes from the same intake line of the analyzer, just before the instrument. The other, instead, is completeley independent of the analyzer system to check for possible contaminations along the analyzer intake lines. The results of these control sets are then compared with the hourly average from the continuous analyzer at the time when the two control samples were taken. Overall, the reliability of the MLO data is found to be within 0.2 ppm.
Finally, the results from an independent instrument run by the Scripps Institution of Oceanography using different calibration and different data selection are in good agreement with the data from NOAA within 0.04 ppm on average.
Probably I could have made it easier and show just how Mauna Loa data compares with other sites in different parts of the world:
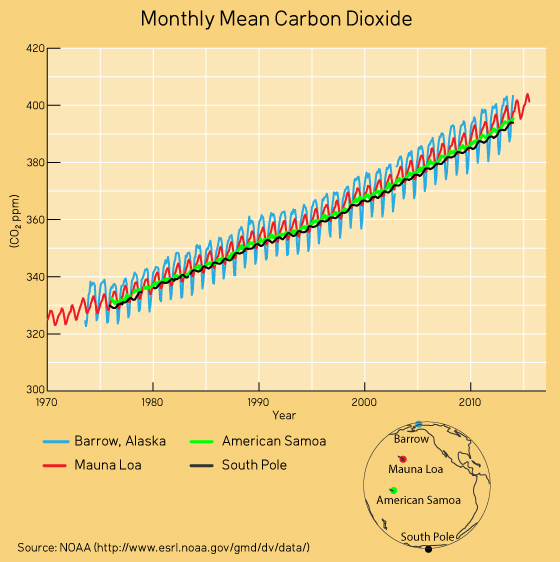
(Chart updated 9/5/2015)
We note a much larger annual cycle in the northern hemisphere (Barrow and Mauna Loa) than in the southern hemisphere (Samoa and South Pole). Also, the cycle is larger at Barrow than at Mauna Loa. It is due to the seasonal cycle of land vegetation and reflects the amount of land in the respective hemispheres (northern vs southern) and the proximity to the source (Barrow vs Mauna Loa). But the overall trends, from the southern to the northern hemisphere and from the poles to the equator, are pretty consistent. Apparently people at NOAA know what they are doing. It's not by chance that the Mauna Loa CO2 record is considered one of the best records in climate science.
Last updated on 6 September 2015 by Riccardo. View Archives


Climate Myth...