Global ice melt is accelerating
What the science says...
| Select a level... |
 Basic
Basic
|
 Intermediate
| |||
|
Ice mass loss is occuring at an accelerated rate in Greenland, Antarctica and globally from inland glaciers. Arctic sea ice is also falling at an accelerated rate. The exception to this ice loss is Antarctic sea ice which has been growing despite the warming Southern Ocean. This is due to local factors unique to the area. |
|||||
Climate Myth...
Ice isn't melting
Thanks to a rapid rebound in recent months, global sea ice levels now equal those seen 29 years ago, when the year 1979 also drew to a close. In fact, the rate of increase from September onward is the fastest rate of change on record, either upwards or downwards. The data is being reported by the University of Illinois's Arctic Climate Research Center, and is derived from satellite observations of the Northern and Southern hemisphere polar regions (Daily Tech).
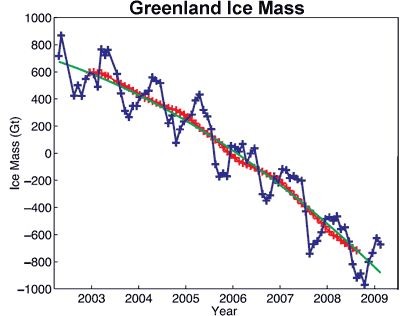
Figure 1 shows gravity satellite measurements of Greenland ice mass from April 2002 to February 2009 (Velicogna 2009). The blue line/crosses show monthly values of ice mass. The red crosses have seasonal variability removed. The green line is the best fitting quadratic trend. The best fitting trend finds that Greenland ice loss is accelerating at a rate of 30 Gigatonnes/yr2. Greenland's mass loss doubled over the 9 year period. More on Greenland...

Figure 2: Time series of ice mass changes for the Greenland ice sheet estimated from GRACE monthly mass solutions for the period from April 2002 to February 2009. Unfiltered data are blue crosses. Data filtered for the seasonal dependence using a 13-month window are shown as red crosses. The best-fitting quadratic trend is shown (green line). (Velicogna 2009)
Figure 2 shows gravity measurements of land ice mass changes in Antarctica for the period April 2002 to February 2009 (Velicogna 2009) . The blue line/crosses show the unfiltered, monthly values. The red crosses have seasonal variability removed. The green line is the best fitting trend. Ice loss is accelerating at a rate of 26 Gigatonnes/yr2. The Antarctic ice sheet plays an important role in the total contribution to sea level. That contribution is continuously and rapidly growing.

Figure 2: Ice mass changes for the Antarctic ice sheet from April 2002 to February 2009. Unfiltered data are blue crosses. Data filtered for the seasonal dependence are red crosses. The best-fitting quadratic trend is shown as the green line (Velicogna 2009).
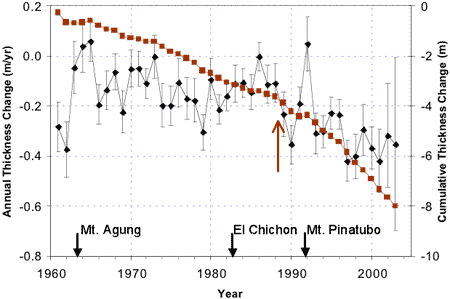
Globally, glaciers are shrinking in area and thickness and the melt rate has accelerated dramatically since the mid-1990s. The National Snow and Ice Data Center have calculated global change in glacier volume - their results show glaciers are shrinking at an alarming rate. More on glaciers...

Figure 3: Annual change in global glacier thickness (left axis, meters of water equivalent, m/yr) and cumulative value (right axis, m), based on surface area-weighted mass balance observations. Dates of major volcanic eruptions are shown, since stratospheric aerosols have a cooling effect on climate. Red arrow highlights volume rate change (source: NSIDC) .
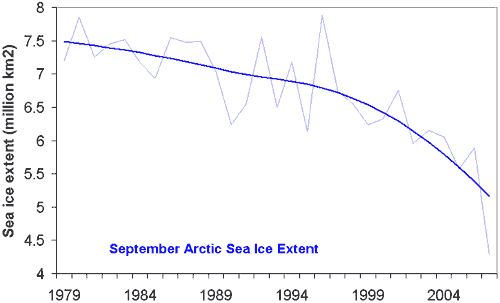
Global warming has a clearly observed, long term effect on Arctic sea ice. In fact, although climate models predict that Arctic sea ice will decline in response to greenhouse gas increases, the current pace of retreat at the end of the melt season is exceeding the models’ forecasts by around a factor of 3 (Stroeve 2007). More on Arctic ice...

Figure 4: September Arctic Sea Ice Extent (thin, light blue) with long term trend (thick, dark blue). Sea ice extent is defined as the surface area enclosed by the sea ice edge (where sea ice concentration falls below 15%).
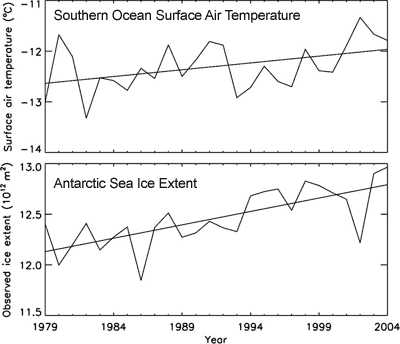
The one exception to this pattern of accelerating ice loss is Antarctic sea ice which has shown long term growth since satellites began measurements in 1979. This is despite the fact that the Southern Ocean has been warming faster than the rest of the world's oceans. Globally from 1955 to 1995, ocean have been warming at 0.1°C per decade. In contrast, the Southern Ocean has been warming at 0.17°C per decade. Not only is the Southern Ocean warming, it is warming faster than the global trend.
If the Southern Ocean is warming, why is Antarctic sea ice increasing? There are several contributing factors. The hole in the ozone layer above the South Pole strengthens cyclonic winds that circle the Antarctic continent. The wind pushes sea ice around, creating areas of open water known as polynyas. More polynyas leads to increased sea ice production. Another contributor is changes in ocean circulation which cause less heat is transported upwards from the deeper, warmer layer. Hence less sea ice is melted.

Figure 5: Surface air temperature over the ice-covered areas of the Southern Ocean (top). Sea ice extent, observed by satellite (bottom). (Zhang 2007)
Intermediate rebuttal written by John Cook
Update July 2015:
Here is a related lecture-video from Denial101x - Making Sense of Climate Science Denial
Last updated on 13 July 2015 by MichaelK. View Archives


 Arguments


Does anyone track global snow/ice extent and relate it to albedo? I read in http://en.wikipedia.org/wiki/Stefan-Boltzmann_law#Temperature_of_the_Earth that the earth's albedo is 0.3. This means we can multiply the energy coming in by 0.7.
Could increase in air temperature be accurately predicted by the decrease in albedo?
SB, I don't know of anyone tracking it, but tamino did a post a few years ago on it, and SoD has a variety of posts on it.
Would all the melted glacier ice dumping into the oceans artificially slow the temperature elevation of the ocean? Like a glass of ice tea in the sun, will the temp rise of the ocean accelerate after all the ice melts?
Lawrence Tenkman @11,
The Ocean Heat Content measured down to 2000m is increasing at a rate in excess of 10Zj/year due to AGW. The global loss of ice mass is subject to a lot of variation year-to-year but to put some numbers down:-
Sea Ice Arctic Sea Ice loss (from PIOMAS) averages 350Gt/y since 2007. Antarctic Sea Ice Volume is poorly assess but probably insignificant. (The small Antarctic areal increase to 2004 graphed in the OP was very minor. It became more pronounced for a while 2014-16 before plunging negative where it remains. The graph here is from NSIDC.)
Land Ice The dramatic acceleration of polar land ice in the OP graphs has not been maintained. With GRACE-FO beginning to give results (graph of Greenland mass balance), the recent combined rate of loss of global land ice has been assessed as something like 650Gt/year.
So the global ice loss is roughly 1,000Gt/year.
In terms of the energy to warm the resulting melt water up to average ocean temperatures, something like +4ºC, would require 0.015Zj/year, significantly less than the 10Zj/year annual increase in OHC. Energy to warm melt-water is also significanlty less than the energy required to convert that amount of ice into the melt-water (0.30Zj/year) but ocean-wise that would only affect icebergs melting out while bobbing on the briny sea.
Where all this melt water will play more of a role in global climate is it being fresh water and not briny. Note that the Greenland rate of gross ice loss is probably five-times greater than the rate of net ice loss and there is a lot of other fresh water entering the oceans from rivers and also the annual sea ice melts, but fresh water is more buoyant than ocean water and increases in the discharge of fresh water into the oceans can disrupt deep ocean currents, the AMOC (which brings warmth to the high Atlantic) being of particular concern.
MA Rodger,
I really liked your link on 650 GT/yr ice loss. It was informative and easy to read.
Per Velicogna et al 2020 - Continuity of ice sheet mass loss in Greenland and Antarctica from the GRACE and GRACE Follow‐On missions:
Both the Greenland and the Antarctic Ice Sheets continue to lose ice mass from April 2002 through September 2019.
Greenland Ice Sheet average mass loss:
Antarctic Ice Sheet average mass loss:
https://agupubs.onlinelibrary.wiley.com/doi/abs/10.1029/2020GL087291