Climate Science Glossary

Term Lookup

Enter a term in the search box to find its definition.

Settings

Use the controls in the far right panel to increase or decrease the number of terms automatically displayed (or to completely turn that feature off).

Term Lookup

Settings


All IPCC definitions taken from Climate Change 2007: The Physical Science Basis. Working Group I Contribution to the Fourth Assessment Report of the Intergovernmental Panel on Climate Change, Annex I, Glossary, pp. 941-954. Cambridge University Press.

Home Arguments Software Resources Comments The Consensus Project Translations About Support

Twitter Facebook YouTube Mastodon MeWe

RSS Posts RSS Comments Email Subscribe


Climate's changed before
It's the sun
It's not bad
There is no consensus
It's cooling
Models are unreliable
Temp record is unreliable
Animals and plants can adapt
It hasn't warmed since 1998
Antarctica is gaining ice
View All Arguments...


Username
Password
New? Register here
Forgot your password?

Latest Posts

Archives

September 2010 Arctic Ice Extent Handicapping Via ARCUS

Posted on 24 June 2010 by Doug Bostrom

Guest post by Doug Bostrom

Unusually low ice cover in 2007 galvanized public attention on Arctic sea ice extent and ever since, discussion at climate-related web sites has raged back and forth on what portends for future Arctic ice behavior. While the trend of sea ice extent seems clear and meanwhile attention has swerved increasingly to ice volume as a better diagnostic of Arctic ice status, all the same everybody's fascinated with weather and what's going to happen next and this year's ice behavior is no exception. The SEARCH division of the Arctic Research Consortium of the U.S. (ARCUS) has gathered and released an informal set of prognostications on the fast-approaching Arctic sea ice minimum for this year.

In all, SEARCH mustered 16 opinions and predictions about this upcoming September's results, spanning the gamut of authors from interested laypersons to the highly expert. SEARCH summarizes:

”The June Outlook for arctic sea ice in September 2010 shows reasonable arguments for either a modest increase or decrease in September 2010 sea ice extent compared to the last two years (5.4 million square kilometers in 2009 and 4.7 million square kilometers in 2008). However, it is important to note that the June 2010 Outlook indicates a continuation of the overall trend in long-term loss of summer arctic sea ice, with no indication that a return to historical levels of the 1980s/1990s will occur.

Reasoning for an increase in sea ice extent from recent years assumes that the current presence of extensive second- and third-year sea ice that we saw in winter 2009/2010 indicates a build-up of multi-year sea ice and a more stable ice pack. Reasoning for a decrease in sea ice extent from recent years, perhaps approaching new record-low minimum, focuses on the below-normal sea ice thickness overall, the thinning of sea ice in coastal seas, rotting of old multi-year sea ice, warm temperatures in April and May 2010, and the rapid loss of sea ice area seen during May.”

Presented graphically, the distribution of predictions:

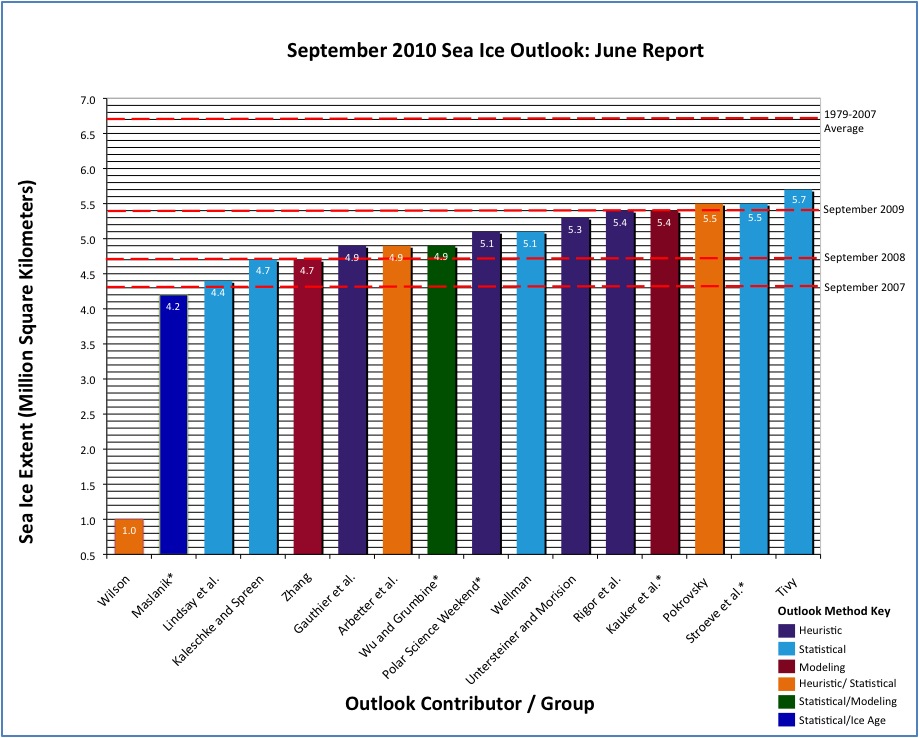
Quite a reasonable clustering on the whole, although on the left side you can see a lonely outlier. SEARCH welcomes unsolicited submissions to this report if they meet certain easily satisfied requirements, a nice gesture of inclusiveness. That dramatically low estimate is from such a participant, a prediction we hopefully and most likely won't see verified come September.

The other prediction of particular interest for us typically average folks is that of the “Polar Science Weekend “ sponsored by the University of Washington and Seattle's Pacific Science Center. Members of the lay public visiting an exhibit on the polar regions back in February were invited to make predictions after learning some basics of Arctic sea ice and participating in a discussion. PSW describes the results:

We had a total of N = 60 guesses from about six hours of discussions. The mean was 5.1 million square kilometers and the standard deviation was 2.15 million sq km. The mean is quite near that predicted by the trend line (5.15 +/- 0.57 million sq km), but the spread is greater.

Good job, Public!

Full details on the philosophies and methods behind all the predictions as well as affiliations of contributors may be found here (pdf).

0 0

Printable Version  |  Link to this page

Comments

Prev  1  2  

Comments 51 to 80 out of 80:

  1. CBDunkerson (#46), Is that temperature anomaly map based on satellite or ground station data?
    0 0
  2. a_yeeles "Precisely. Which is why, as AMSU-A shows global temperatures continuing to track well above average, an exceptional arctic ice season may well be in prospect." People talk about weather patterns and melt because water is a much more effective melter of sea ice than warm air. The warmer temps are going to accelerate melting, of course, but for a truly exciting melt season we need more than that. We need ice being pushed down from the arctic basin into the (relatively) balmy narrows of the Nares Strait, or the ocean south of the Fram Strait. At least, that's what the 2007 season told us. If it stays super-warm up there over the next three months, as it is currently doing, maybe that will have a bigger effect on extent and area of coverage and the movement of ice into warmer waters won't be so important. Each day that passes leads me to believe we might, as you say, have a very low minimum extent. The next four weeks will tell us a lot.
    0 0
  3. dhogaza: "There are problems with melt ponds on top of the ice fooling the various ice measurement algorithms, but year-to-year comparisons should still be apple-to-apple." This isn't quite true. If surface temperatures are warmer than normal, you could see more melt ponds, which would tend to cause an underestimation of ice area. At the same time, you could have colder sea temperatures keeping the ice from melting through. Given arctic temperatures this year, it's likely that at least the first part of this is happening. If the second part is also happening, we'll likely see a recovery in ice volume (from the straight down trajectory PIOMAS is currently showing), and ice area, once the freezing starts again. But it's unlikely to move the ice volume back to anywhere near the 1979-2009 trend line. That looks broken for good. In any event, the existence of abnormally extensive melt ponds is in itself an important observation. Either way, things are warming up in the arctic.
    0 0
  4. gallopingcamel, does it matter? Given that the satellite and ground temperature records match other than minor variations, as even the UAH satellite team acknowledges, what's the difference? That said, the anomaly map in question was compiled by NASA from ground station data.
    0 0
  5. 25 Neven "I've also written a piece on the Cryosphere Today archive data and the discrepancy with the daily ice concentration map on the front page. No conclusions, unfortunately, but the archive maps look fishy to me." They are not fishy, they just use a different colour scale compared to the images on the front. I don't understand why they don't bother to be consistent.
    0 0
  6. 29 doug_bostrom at 16:19 PM on 25 June, 2010 "Further to HR's thoughts about psychological influences on predictions" No psychological angle from me, are you referring to my use of the word bias? If so what I meant is that the very low 2007 extent is in someway playing through the different methods used to make the prediction. The most likely thing is because so much ice disappeared in 2007 we have very little multi year ice, this effect will continue until next year. I suspect the methods give too much value to this lost ice.
    0 0
  7. 35 CBW at 01:27 AM on 26 June, 2010 "I find all of these predictions interesting, but not particularly helpful to the discussion of AGW" I have to disagree with this because one thing it does tell us is just how good our understanding of arctic sea ice is. These are the best arctic scientists. Its good to know just how good they are given so much rides on what they are telling us. It's a good complement to peer-review.
    0 0
  8. HumanityRules at 03:47 AM on 27 June, 2010 I have to agree with CBW here. We may understand Arctic sea ice quite well, but that doesn't mean that our single year predictions will necessarily be accurate. Predictions should encompass both the essential scientific understanding of sea ice response to warming and its seasonal progression (likely increasingly good) and the inherent uncertainty that results from stochastic variability (aka "weather" in this context). Sea ice response to global warming should increasingly be predictable in relation to the longer term trend that averages stochastic variability. Prediction of yearly levels is fun for the peanut gallery, but doesn't say a huge amount about our understanding of Arctic sea ice unless we (i.e. those that study this) have a good handle on the predictability of weather-related influences. My prediction is lots of blogospheric hot air to come!
    0 0
  9. One of the SEARCH predictions might be spot-on this year but that's not going to tell us much about the skill of the method employed. Although we ought to be happy that skills change and improve over time, from another perspective it would indeed be interesting to see the exact methods chosen by each group using a reproducible system applied over several years' time, maybe a decade. Short of that one year is going to teach us very little about the validity of any system of prediction against the other. As Chris suggests this is at the level of a spectator sport for us, or maybe watching tournament poker. It's fun (maybe in a morbid fashion) but shouldn't be taken too seriously. Trends are what we should be paying attention to from a more serious perspective.
    0 0
  10. "I have to disagree with this because one thing it does tell us is just how good our understanding of arctic sea ice is. These are the best arctic scientists. Its good to know just how good they are given so much rides on what they are telling us. It's a good complement to peer-review." What they know is arctic sea ice predictions will always be less reliable than long-range weather forecasts, because the variability between years depends so much on weather. If weather forecasters were able to tell arctic sea ice experts what wind patterns (and the partially dependent water circulation patterns), temp anomalies, etc lie in store between now and the third week of September, sea ice forecasting would be far more accurate. But the weather people can't, and therefore sea ice minimum forecasts are guaranteed to be a crapshoot.
    0 0
  11. It's just another aspect of the old 'we cannot predict the weather so we cannot predict climate' fallacy. No, we can't precisely predict the minimum sea ice extent in any given year... but that doesn't change the fact that the long term trend is clearly in sharp decline and we CAN predict eventual complete melt of the Arctic sea ice in Summer. That said, sea ice predictions are constantly improving and have now entered the realm of having some practical usability... specifically they've now got a good enough grasp on some of the dynamics to provide estimates of coastal sea ice stability about a week in advance. This is similar to weather prediction or volcano monitoring... so long as the prediction is limited to situations we have a good handle on they have some viable utility. There is a good article on the subject here.
    0 0
  12. CBDunkerson (#54), No big deal. When one is looking at the poles satellite data would be more convincing. Somewhere on another thread it was shown that there are only a handful of high latitude ground stations in the NASA and NOAA data bases. Perhaps you or Berenyi Peter can say how many ground stations there are above 66 degrees latitude. I suspect that the number is too small to justify the fine grained contours seen on NASA anomaly maps.
    0 0
    Moderator Response: There's no specific thread (yet) for discussion of polar temperature measurement and interpolation so for the time being please continue discussing the polar instrumental temperature record on the Temperature Record Is Unreliable thread. Thanks!
  13. John Cook, My apologies for getting "Off Topic" in #69. I am impressed by the fact that nobody on this blog is panic stricken by the prospect that north pole ice sheet may be smaller in September 2010 than it was in 2007.
    0 0
  14. Oops! I meant #62!
    0 0
  15. gallopingcamel, #63, why would anyone be "panic stricken" about the eventual melting of arctic sea ice when it is simply another consequence of a process we've been witnessing for twenty years or more? And why does it "impress" you that we're not panic stricken? You appear to be insulting us with a backhanded compliment embedded in an "apology." And, for the record, the north pole doesn't have an "ice sheet." An ice sheet exists on land. The north pole has sea ice.
    0 0
  16. Neven #25, those are pretty pictures of the pole. (Neven has links on his site to the two cameras. Check them a couple of times a day to see the changing skies (and melting ice.)) Does anyone know if this is a common occurrence at the pole, and does it usually happen this early in the summer? Are those yellow things buoys?
    0 0
  17. How amazing and marvelous that we're able to drop remote sensing equipment like that at the N. Pole. Little chance of theft, either. Years ago I was involved with a project to attach radio-equipped digital imagers to outdoor analog instruments, reporting to data concentrator boxes. One of our camera gizmos was stolen but managed to send a final picture before going out of range, showing the interior of a pickup truck bed. No mug shot of the perp, unfortunately.
    0 0
  18. D'oh, never mind my questions in #66. Neven's site has a link that shows some history. The answer is that it varies a lot year to year (big surprise in the arctic), and those yellow things are, indeed, buoys. Doug, I agree, it's amazing what cheap technology allows you to do. Have a look at the pictures in the link, above. Fascinating stuff. The only problem is that when it gets really interesting, the camera tends to die.
    0 0
  19. Excellent Professor David Barber lecture on the current state of the Arctic Ice. Forward the video to 12:00 to skip the intros. Dr. David Barber
    0 0
  20. 58 chris this seems a little unfair. SEARCH is organised by mainstream arctic scientists and seems to garner participation from many mainstream arctic science groups. If it's little more than a game (no doubt generating headlines) then maybe these serious scientists shouldn't be participating. If we want less blogospheric hot air we should insist that scientist stick to what we (i.e. they) know.
    0 0
  21. SEARCH seems proud of the headlines it can generate.
    0 0
  22. HumanityRules: One way that scientists show what they know is by making predictions of what they think will happen. If those predictions consistantly show skill then they understand the material. If they have poor predictions that means they have a ways to go to understand the material. The predictions on arctic ice have a big spread and low skill. This shows the rest of us that they have more to learn. We can compare to past predictions (like the 2007 IPCC report) and see that the date of an ice free arctic keeps getting moved forward. Even WUWT now predicts an ice free arctic before the 2007 IPCC report!! That shows the scientists have been much too conservative in the past. What does that suggest about their predictions of ice melt in Greenland? Are they more likely conservative or alarmist? As the years go by the predictions will converge. When they do we will have more confidence in those predictions. I note that none of the estimates predict a return to the ice levels of the 1990's. This tells us something and is a firm prediction.
    0 0
  23. I recommend the latest post from Steven Goddard 28/06/1910 (WUWT) - for me it is very comprehensive and shows that the Arctic ice surface is not what so fascinated. For me, the most effective there is this quote: The New York Times, 1969: "From the 9th century to the 13th century almost no ice was reported there. This was the period- of Norse colonization of' Iceland and Greenland. Then, conditions worsened and the Norse colonies declined. After the Little Ice Age of 1650 to 1840 the ice began to vanish near Iceland and had almost disappeared when the trend re versed, disastrously crippling Icelandic fisheries last year." At SH (http://arctic.atmos.uiuc.edu/cryosphere/IMAGES/seaice.anomaly.antarctic.png) the record probably will fall (as they say the forecast) but otherwise ...
    0 0
  24. Arkadiusz Semczyszak at 22:26 PM on 29 June, 2010 Goddard states: "You will also note that most of the world’s sea ice is located in the Antarctic" Antarctic: around 19 Million square km max extent at approx 0.87m thick average. Arctic: around 15 million square km max extent (limited by surrounding land masses) at average approx 2m thick. Which has more sea ice (at least for now)? I'll dig out references as this is from memory, but about right. I'll read the next paragraph now...
    0 0
  25. Arkadiusz Semczyszak wrote : "I recommend the latest post from Steven Goddard 28/06/1910 (WUWT)..." That's funny, but I recommend his post of 26 June (Latest Barrow Ice Breakup On Record?). There are many people on there showing him the error of his ways. The day after Steven Goddard wrote that post, hoping for the latest coast ice break up in Barrow, the ice vanished from the beach. Have a look at it now. Perhaps he was confused because the picture he shows has Barrow shrouded in mist : he couldn't see the ice but just assumed (hoped/prayed) it was there. It actually looks as if the ice broke off the day before Goddard wrote his post. Join in the laughter at Deltoid
    0 0
  26. There is a very good new article on Cryosat-2 showing some of the first data released here. The Arctic scan included in the article shows situations where previous instrumentation (e.g. PIPS) would have reported a large area of thick ice for what was really just a few large chunks. They're still calibrating data (after moving the satellite into a new orbit), but expect to start releasing results in a few months. Thus they should be able to tell us what the minimum ice volume for this year was, but it may be a couple of months after the event.
    0 0
  27. Those still following this topic may be interested to read a very informative post by Dirk Notz, here at RealClimate. For me it was interesting to see my intuition seconded by somebody with some expertise: Because of the very low thickness of much of the Arctic sea ice, it wasn’t too surprising that at the end of the winter, sea-ice extent decreased rapidly. This rapid loss lead up to the lowest June sea-ice extent since the beginning of reliable observations. After this rapid loss of the very thin ice that had formed late in winter, the retreat slowed down substantially but the ice extent remained well below the long-term mean. Currently, the ice covers an area that is slightly larger than the extent in late July of the record year 2007. However, this does not really allow for any reliable projections regarding the future evolution of Arctic sea ice in the weeks to come. The reason for this is mostly that sea ice in the Arctic has become very thin. Hence, in contrast to the much thicker ice of past decades, the ice now reacts very quickly and very sensitively to the weather patterns that are predominant during a certain summer. This currently limits the predictability of sea-ice extent significantly. For example, in 2007 a relatively stable high-pressure system formed above the Beaufort sea, towards the north of North America, leading to rapid melting of sea ice there. If again such stable high pressure system forms in the Arctic throughout the coming weeks, we might well experience a sea-ice minimum that is below the record minimum as observed in 2007. However, if the summer should turn out to be colder than during the previous years, a sea-ice minimum similar to that observed in 2009 would not be too surprising. Hence, at the moment all that remains is to wait – and to check again and again the latest data of Arctic sea-ice extent. Emphasis mine. Probably what many of us suspected.
    0 0
  28. Yep, extent can fluctuate wildly for any given volume / area of sea ice. The comment about this variability being greater now due to the ice being thinner is a very good point. Also, they've put up the July predictions; 
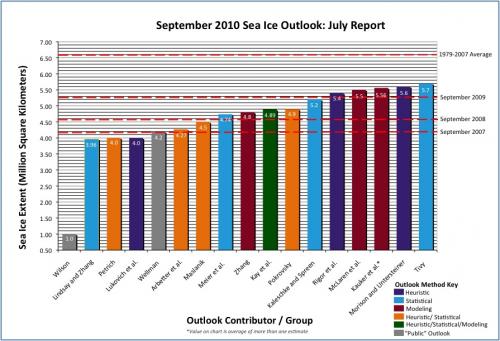
Interestingly, the accompanying writeup states that some of these went up due to the slower rate of decline at the start of July... indicating that they include data past the end of June though not exactly how much. In any case, many predictions also went down and several now show a possible new record minimum. Interestingly, PIPS is now showing ice thickness and concentration both greatly below their 2007 values, but the extent is decreasing slightly more slowly. This again emphasizes the point about weather being such an important factor in determining extent. Even when the volume is significantly lower the extent can still be higher. Thus, it is really only a useful indicator on a decadal scale. Right now it looks likely to come out a little higher than the 2008 (second lowest) value, but could theoretically still beat 2007. It doesn't seem likely that it'll be higher than the 2009 (third lowest) value, but some extreme weather shift could still cause that.
    0 0
  29. Tamino teases the tea leaves, looking at variances between years w/regard to extent versus area versus phasing of changes. Lovely arcana. Also a prediction is ventured, with methods.
    0 0
  30. The final word: year mo data_type region extent area 2010 9 NRTSI-G N 4.90 3.02 via NSIDC
    0 0

Prev  1  2  

You need to be logged in to post a comment. Login via the left margin or if you're new, register here.


The Consensus Project Website

THE ESCALATOR

(free to republish)


© Copyright 2024 John Cook
Home | Translations | About Us | Privacy | Contact Us