Climate Science Glossary

Term Lookup

Enter a term in the search box to find its definition.

Settings

Use the controls in the far right panel to increase or decrease the number of terms automatically displayed (or to completely turn that feature off).

Term Lookup

Settings


All IPCC definitions taken from Climate Change 2007: The Physical Science Basis. Working Group I Contribution to the Fourth Assessment Report of the Intergovernmental Panel on Climate Change, Annex I, Glossary, pp. 941-954. Cambridge University Press.

Home Arguments Software Resources Comments The Consensus Project Translations About Support

Twitter Facebook YouTube Mastodon MeWe

RSS Posts RSS Comments Email Subscribe


Climate's changed before
It's the sun
It's not bad
There is no consensus
It's cooling
Models are unreliable
Temp record is unreliable
Animals and plants can adapt
It hasn't warmed since 1998
Antarctica is gaining ice
View All Arguments...


Username
Password
New? Register here
Forgot your password?

Latest Posts

Archives

Continued Lower Atmosphere Warming

Posted on 14 October 2011 by dana1981

We recently discussed Santer et al. (2011), which compared the observed trends in the temperature of the lower troposphere (TLT) with those predicted by climate models.  The paper also examined claims by John Christy in testimony to US Congress that TLT is warming at just one-third the rate predicted by climate models, and found that he had greatly exaggerated the model-data discrepancy.

Santer et al. also examined what models have to say about short-term trends, and concluded as follows:

"Because of the pronounced effect of interannual noise on decadal trends, a multi-model ensemble of anthropogenically-forced simulations displays many 10-year periods with little warming.  A single decade of observational TLT data is therefore inadequate for identifying a slowly evolving anthropogenic warming signal.  Our results show that temperature records of at least 17 years in length are required for identifying human effects on global-mean tropospheric temperature."

So there are two key findings here.  Firstly, even with man-made global warming taken into account, because of the short-term noise due to the internal variability in the climate system, climate models predict that there will be decades where natural cycles dampen the man-made warming trend. 

Secondly, in order to identify the human influence on global temperatures, we must examine at least 17 years' worth of data (unless we first filter out the natural noise).  This finding undermines the many "skeptic" claims that global warming stopped in 1995 or 1998 or 2001 or 2005, etc. etc.

Pielke's Criticism

Roger Pielke Sr. weighed in on Santer et al. (2011) on his blog, and he did concede the first key finding above:

"I agree with Santer et al that “[m]inimal warming over a single decade does not disprove the existence of a slowly-evolving anthropogenic warming signal.”

Unfortunately, Dr. Pielke seems to have neglected the second key finding above, as he proceeds to examine 13 years of TLT data.

"they did not recognize that the global average temperature trend in the lower troposphere has been nearly flat  as shown, for example, in the figure below from the RSS MSU data...There has been NO long-term trend since the large El Nino in 1998.  That’s 13 years."

So why examine 13 years' worth of data?  That seems like a rather arbitrary figure - it's larger than 10, but smaller than the 17 year timeframe which Santer et al. concluded is necessary to evaluate the human influence on global temperatures.  Dr. Pielke recently answered this question:

"I did not start in 1998 because it was the warmest in the record. I started after that when the MSU LT became ~flat."

However, part of the reason the TLT data is "~flat" over that period is that 1998 was an anomalously hot year.  As Dr. Pielke notes in the quote above, 1998 was a "large El Niño year."  In fact, not just a large El Niño; 1997-1998 saw one of the strongest El Niños on record.  And the TLT data are more sensitive to ENSO events than surface temperature data (Figure 1).

UAH vs RSS vs GISS

Figure 1: RSS (blue), UAH (green), and GISTEMP (red) 12-month running averages since 1979.

The El Niño peak in 1998 and La Niña trough in 2008 in particular are much more evident in the satellite data sets than in the surface temperature record.

Tamino has also previously performed a multiple regression of temperature on various short-term effects, including the Multivariate ENSO Index (MEI), and confirms that TLT data are much more sensitive to ENSO than surface temperature data (Figure 2).


tamino MEI

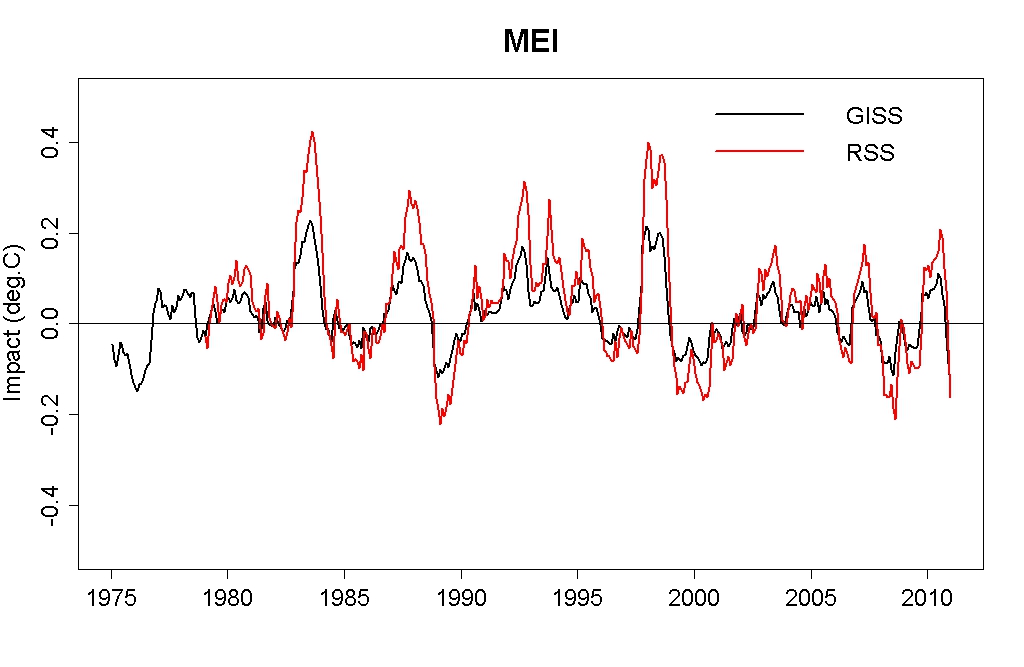
Figure 2:  Impact of MEI on RSS TLT and NASA GISS surface temperature (Source: Open Mind)

In short, 1998 was an anomalously warm year due to the record strong El Niño that year, especially in the satellite TLT data.  Therefore, choosing 1998 as the starting year will result in minimizing the short-term temperature trend.

To further illustrate the point, if we choose a timeframe of 14 years of RSS TLT data, there is a positive trend.  If we choose 12 years, it's even more positive.  Dr. Pielke has said he chose the RSS data in his critique because it's "the same data that is used in the Santer et al study."  However, Santer et al. examined both UAH and RSS data.

If we examine UAH data (which Dr. Pielke has said this is an "outstanding" data set) starting in 1998, even the 13-year TLT trend is positive.  The start data also makes a big difference in the short-term trend.  The UAH trend is 0.10°C per decade since 1997, 0.06°C per decade since 1998, and 0.18°C per decade since 1999. Note that changing the starting date by a single year from 1998 to 1999 triples the UAH TLT trend.

If we heed the findings of Santer et al. and examine at least 17 years worth of data, the trend over that period is positive in both UAH (0.14°C per decade) and RSS (0.07°C per decade).  Dr. Pielke subsequently criticized the application of a linear trend to this data:

"My view, is that focusing on a linear trend with respect to a actual nonlinear signal is a substantial oversimplication of how we should expect the climate sytstem to behave both naturally, and in response to the diversity of human climate forcings."

However, over such a short timescale, the forcings are not significantly non-linear, and thus calculating the linear trend is appropriate.  In fact, it's an approach that Dr. Pielke himself frequently implements (i.e. here and here and here and here).  When asked for evidence that the short-term forcing is significantly non-linear, Dr. Pielke responded that a linear trend does not explain all of the "ups and downs" in the data.  However, the ups and downs in the short-term are due to natural variability, and are the reason why Santer et al. concluded that we must examine at least 17 years worth of data to identify the human signal.  While the longer-term trend might not accurately be evaluated with a linear fit, in the short-term, it's a reasonable approximation.

Selective Vision

The animation below illustrates the problem with focusing on such short timespans.  The first frame shows the data Dr. Pielke has focused on - RSS data since 1998  (plus the linear trend) in blue.  The following frame shows what the data looks like if we instead choose UAH data since 1999 (in green).  Note that we are not advocating this choice, but simply showing what a large difference such a small change in start date can make.  The third frame shows the entire UAH and RSS record.

MSU cherries

Even Shorter Timeframes

Dr. Pielke has more recently suggested examining the TLT data since 2002:

"I suggest that the hypothesis be that

"The lower tropospheric global annual average temperature trend (TLT) from 2002 until now cannot distinguished from a zero trend."

...and the trends during this time period are different than the trends earlier in the time period. "

However, as Dikran noted in response, it's entirely possible that over such a short timeframe, short-term noise such as ENSO and solar cycles may have masked the continuing long-term global warming trend.  Thus testing whether the trend since 2002 can be distinguished from zero:

"is not a particularly interesting hypothesis for the simple reason that the statistical power of the test is very low because the timespan over which the trend is computed is too short."

The signal-to-noise ratio is even less from 2002 to Present than 1998 to Present.  Dr. Pielke is moving in the wrong direction, examining less data rather than more.

There are going to be short-term periods in which the noise dampens the underlying long-term signal, and periods when the noise amplifies it.  If we're going to examine such short periods of data, we at least must filter out the effects which cause short-term noise. 

Removing Exogeneous Factors

Tamino has attempted this analysis by removing a number of exogeneous factors (ENSO, volanic, solar).  He found that the long-term warming trend continues in both UAH and RSS, which have been temporarily dampened by those short-term effects over the past ~decade (Figure 4).

tamino analysis

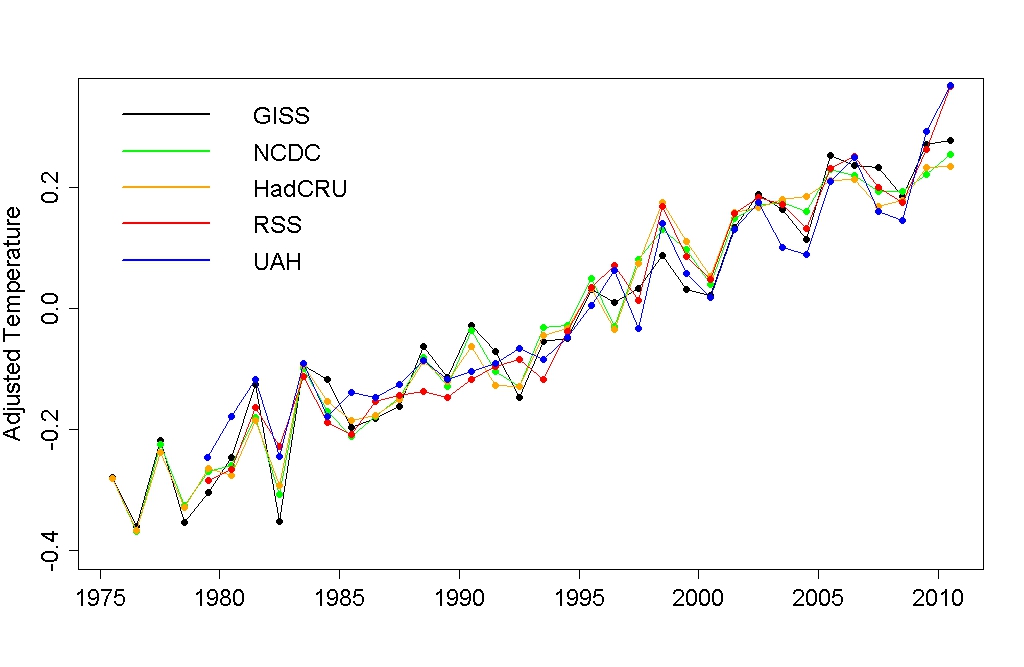
Figure 4: TLT and surface temperature data sets with exogeneous factors removed by tamino

Summary

In his blog post, both the data set and start date Dr. Pielke chose minimized the short-term TLT trend.  Pielke was well aware of the strong El Niño in 1998, noting it in his post, and yet he chose this year as the start date of his analysis anyway.

It's also unclear why Dr. Pielke chose to make this 'no trend in 13 years' argument in a post commenting on Santer et al. (2011) to begin with, since the paper demonstrates that at least 17 years of data are necessary to evaluate the human influence on the TLT trend.  Dr. Pielke also didn't examine why the short-term TLT trend has slowed over the past decade, as was done in Kaufmann (2011), for example. 

The main take-home point here is that analysing short periods of data is fraught with challenges due to the short-term noise.  It's entirely expected that over periods on the order of a decade, there will be times of little warming in surface temperatures, as Santer et al. (2011) demonstrated.  We are currently in the midst of one of those periods.  Over the past decade, solar activity has been low, anthropogenic aerosol emissions have risen, and ENSO has been primarily in its negative phase.  Thus it's not unexpected that surface temperature warming has slowed, and when we account for these factors, we see that the underlying long-term warming trend continues.  As tamino noted when analysing all the main surface temperature and TLT data sets (emphasis added):

"None of the [most recent] 10-year trends is “statistically significant” but that’s only because the uncertainties are so large — 10 years isn’t long enough to determine the warming trend with sufficient precision. Note that for each data set, the full-sample (about 30 years) trend is within the confidence interval of the 10-year trend — so there’s no evidence, from any of the data sets, that the trend over the last decade is different from the modern global warming trend."

0 0

Printable Version  |  Link to this page

Comments

Prev  1  2  

Comments 51 to 82 out of 82:

  1. Dr Pielke, we are not going in circles, you are. I am joining Paul Tremblay on his questions. If the result of a discussion is going to be "it's not that important and we should move on" why do you raise the question in the first place? I believe that some of these were given some attention on your blog, so at the time you must have thought they did have some importance, what has changed? Paul made a summary of various different points that have been given that treatment, I am as eager to know about why they are now unimportant as he is. Perusing through your posts on the threads on which you have participated, I found both that "policy makers have been misled to think that warming should be monotonous year after year" and extreme attention on your part on time periods during which no trend can be established with significance by any statistical means. This latter emphasis on short time "trends" is exactly why policy makers would come to expect that change be monotonous if they read your blog or other "skeptic" outlets. I admit it is rather surprising and confusing. If you're concerned about policy makers' perception of the trend, should you not only focus on trends that are statistically significant?
    0 0
  2. With a climate system obeying a more or less chaotic model,is the type of statistics applied the correct one? I have the impression that all models used are equilibrium models, on which a kind of perbutration theory is applied, which is assumed to be Gaussian in nature. All the methods in deriving general parameters are based on those assumptions known to hold for stable, equilibrium models. Just saying that one can battle for years to come over a method which is not applicable in this case. What does stand is that CO2 has rissen sharply and sure it will end up into a different environment, probably not one we or any other higher life form can adapt to so quickly (I give the simple single cell forms a good chance to survive)
    0 0
  3. Like others, I feel disappointed by this discussion with Dr. Pielke. We all have been taught that if the data are not sufficient to come to any conclusion we should look for more, not just stay there. The reason why one should stubbornly stick to a non statistical significant trend disgregarding the great part of the data (which we have) is beyond me.
    0 0
  4. With this thread seemingly coming to a close, with the next installment shortly, I would like to thank all the participants for the way in which this has been conducted. It is uncommon that 'on-line' debates actually have anything but a marginal relationship to the true principle of debating. The civility of the tone here is in welcome contrasts to the majority of the AGW Blogosphere. That said, I would like to make a general philosophical observation that is related to this topic in a broad sense. Climate models make predictions of future temperature changes based on assumed GH gas concentration changes. These predictions contain error bands for the predictions which reflect the various uncertainties in the estimate. In particular the limitations that models have had (at least up to now) in predicting variability, sub-decadal changes etc. Climate variability of +/- 0.2 C/decade is typical and since this is also within the range of estimates for underlying trend, certainly decade or less time scales are inappropriate for comparing observations with projections, particularly with reference to atmospheric temps alone, TLT or SAT. So observed temps to date are entirely consistent with expectations of an underlying trend with an overlaid variability. If such a hiatus period persisted for several decades that would be cause for re-evaluation. The statement I made above however is what I would expect any reasonable person in professional person in Climate Science to reasonably agree with, as well as technically educated and well-numerate lay observers/enthusiasts of Climate Science. Such would be the circle of Authors here at SkS and many of the regular posters. However, that does not include 99.99% of the human race. Most people don't have technical educations that let them easily evaluate the sort of information presented her at SkS, Dr Pielke's Blog, RC or even the IPCC. Being able to evaluate the difference or significance between a 10 year trend and a 17 or 30 year trend, let alone a model based trend with 'error bars'; To those familiar with science, an error bar is a margin of accuracy. To most people, an error is something that is incorrect. So when discussing the sorts of issues put here, everyone needs to be aware that the discussion is being carried out in front of an audience of others with wildly varying degrees of technical and numeric literacy. And that is before we delve into the world of those individuals who want, need, to believe that AGW is all wrong. To the commenters here discussion of the 'it hasn't warmed much since xxxx has significance yyyy' variety is a reasonable technical discussion. To many of the lay-public this sounds like someone saying 'It hasn't warmed since xxxx therefore WARMING HAS STOPPED! So much for these AGW theories!' The point I am trying to make is that in puting up comments in a technical discussion, participants need to be aware that their conversation is being read by others who may not 'process' their comments in the way intended by the author. So there is a continuous, demanding requirement to express ideas in ways that cannot be mis-construed by a less technical audience. Our comments can easily mislead just because we do not allow for the knowledge-base of our audience. So when authors here at SkS defend the use of longer time-scales as a basis for looking at trends, they are not simply attempting to ignore the shorter timescale details that may have a relevence in considering the dynamics of short term climate variability questions - a technical discussion. They are also trying to defend against a less technical audience drawing inaccurate conclusions from the comments because they do not understand the numerical details, or because they have an entrenched position where they want to find grounds to reject AGW in-toto and simply want ammunition. Look at the example of Al Gore and his movie. This was aimed at a mass audience who know diddly-squat about climate science. So he shows the Ice Core data with CO2 & Temps tracking each other pretty much in synch but he doesn't highlight the 800 year time-lag. He was aiming this at a mass audience trying to give a generalised, simplified over-view perspective. Then the fact that he didn't highlight the Temp/CO2 time lag (or the Methane signature, Ice Sheet change time lags, variations in dust levels, changes in vegetation patterns, ocean circulation patterns etc) has been taken by some as being evidence of a deception. When in fact it was simply a simplification for general consumption. It is a reality in the hyper-charged world of AGW Politics/Science that there are some groups and individuals who WANT to show AGW as false - hence the D-word applied to them. And they will commonly take comments & statements, whether from the IPCC or a simple blog-post and try to build ammunition from it to distort and mislead others and defend their 'needed' position. This is in contrast to those who may be truely skeptical - with the critical open-mindedness this implies. However the D'ers are all to eager to cloak themselves in the rainment of 'skeptics'. So as a general comment/plea to all participants here. Ask yourself: 'Who is my intended target audience when I make this comment?'. And more importantly, 'Who will be the ACTUAL audience for my comment, intended or otherwise?'. When making a point on a technical issue of statistics or thermodynamics, will my comment be something that can easily be miscontrued by the uninformed, or worse, misrpresented by the malicious well informed. In this technical debate is important. But care and precision with semantics and language is vitally important when the debate is public. And this is the Internet. EVERYTHING is public.
    0 0
  5. ssn tsi, correlate somewhat http://woodfortrees.org/plot/pmod/normalise/mean:30/plot/sidc-ssn/from:1970/normalise/mean:30
    0 0
  6. Following on from Glen's excellent comment, I'm going to have a go at explaining to a non-technical audience what I was asking for when I asked Prof. Pielke for the statistical power of the test of the hypothesis. Hopefully this will help explain why Prof. Pielke's assertiones relating to short term trends are potentially deeply misleading. This is likely to be quite a long post, so I may have to make it in installments. Statistical Hypotheis Testing Statistical hypothesis testing is a confusing issue to many, so I will start by running through a simple example. The first step is to form an hypothesis. Lets say I have a coin, and you want to determine if the coin is fair (equally likely to fall as heads as it is as tails), or biased (more likely to fall on one side than the other). Let P be the probability of the coin falling as a head. We first construct the alternative hypothesis (H1), which is usually the thing we want to prove (though not in Prof. Pielke's case as we shall see later), which we can write as H1: P is not equal to 1/2 We also need a null hypothesis, H0, which is normally a statement of what we want to disprove. This is usually the opposite of the alternative hypothesis, H0: P is equal to 1/2 The way statistical hypothesis testing works is to observe some data, and then to see how unlikely it is to observe a set of data as "extreme" or "more extreme" than that we actually observed, if the null hypothesis is true. We call this value the p-value. If the p-value is less than some threshold, α, then we conclude that the null hypothesis is unlikely to be true, so we say "we reject the null hypothesis at the 1-α level of significance". Scientists traditionally set α=0.05, which gives the usual "95% level of significance" that people often talk about. If the p-value is higher than α then we conclude that we can't rule out the possibility that the null hypothesis is true, so we say "we fail to reject the null hypothesis at the 1-α level of significance". At this point, I want to make some observations:
    • If we are able to reject H0, that doesn't prove that H1 is true. We haven't evaluated the probability of the observations if we assume that the H1 is true, and that probability might also be very small!
    • If we can't reject H0, that doesn't mean that H1 is false, it just means that we can't rule H0 out, and if we can't rule H0 out, we can hardly claim that H1 is true.
    • The test is not symmetrical, the outcome of the test only depends on H0, H1 doesn't come into the calculation at all. So if we repeat the test and exchange H0 and H1, we won't necessarily obtain the opposite result.
    O.K., so lets have a practical example, say we flip the coin eight times and it comes down heads each time (this ought to make us rather suspicious!). If we assume that the coin is fair, then the probability of observing a head on each flip is 1/2 and as each flip is independent the p-value is given by p = ½ ×½ ×½ ×½ ×½ ×½ ×½ ×½ = 1/256 This is less than α = 0.05, so we say that "the null hypothesis (the coin is fair) is rejected at the 95% level of statistical significance", which is in accord with out expectations. Lets now consider what happens when we only observe one flip of the coin. Our intuition should tell us that in this case there clearly isn't enough data to data to determine whether the coin is fair or not, so lets see what the test tells us. This time, computing the p-value, we get p = ½ This is much greater than α=0.05, so we say that "we fail to reject the null hypothesis at the 95% level of statistical significance". This example demonstrates that a failure to reject H0 does not necessarily imply that H1 is false, it may just be the case that there simply isn't enough evidence to reject H0, and both H0 and H1 remain plausible given what we have observed. So, how can we distinguish between the situation where H0 is true and the situation where H0 is false, but we just don't have enough data to demonstrate that H0 is likely to be false? One thing we can do is to look at... The Statistical Power of the Test The statistical power of a test is the probability that the test will reject H0 if H0 actually is false. Let us assume that the coin actually has a head on both sides so that P=1, in which case we know for a fact that H0 is false. In this extreme case, we will get a head every time we flip the coin, so if we flip it once the p-value will always be p = ½ and we will always fail to reject the null hypothesis, even though it is false, so the statistical power of the test is zero. If we flip it twice, the p-value is p = ½×½=¼ and again we will always fail to reject H0, even though it is false, so the statistical power of the test is still zero. The fact that the statistical power of the test is zero tells us that even though we weren't able to reject H0, it was probably just the case we didn't have enough data, rather than because H1 was false and H0 was true. If we carry on flipping the coin, when we get to six flips that all come down head, the p-value is p=½×½×½×½×½×½× = 1/64 we have now reached a point where the test always rejects H0 when it is false, so the statistical power of the test is now 1. Now this is an extreme case, where P=1 or P=½. If we could have a less biased coin, say P=0.75, it would take more data to be able to reject the H0 when it was false, because in that case you would see tails in the sequence of flips whether the coin was biased (H1) or not (H0). However, that would make the maths more complicated, but is not necessary to get the basic idea of statistical power. In practice, the statistical power of the test depends on (i) the amount of data available, the more data, generally the higher the power; (ii) the expected size of the observed effect if H1 is true, the larger the expected effect size, the higher the power; (iii) the amount of noise masking the expected effect, the more noise, the lower the power of the test. This makes computing the statistical power of the test rather difficult to evaluate, so most scientists ignore it. This is often O.K., provided you are not trying to base an argument on the fact that we fail to reject the null hypothesis, which is exactly what Prof. Pielke is doing, which is why he is required to show that the statistical power of his test is high enough that the failure to reject H0 is meaningful. I asked Prof. Pielke no less than three times to state the statistical power of the test, and he was either unable or unwilling to answer the question, or even engage in a discussion of the subject. I find this highly disturbing behaviour for an experienced scientist. Just looking at the data and seeing the obvious is not a reliable way to conduct science, if the obvious is not confirmed by statistics, perhaps it isn't as obvious as you think. N.B. Bernard J. is also asking Prof. Pielke for the statistical power of the test, which is often written as (1-β), where β is the false-negative rate of the test (α is the false-positive rate). As Prof. Pielke is making an argument based on a failure to reject a null hypothesis, he needs to address this point if he wants the argument to be taken seriously. His failure to address this point is extemely damaging to his position.
    0 0
  7. 53, Ger,
    I have the impression that all models used are equilibrium models...
    And why exactly would you think that? I suggest you read Climate Models: An Assessment of Strengths and Weaknesses (click the Download PDF link to get the full report).
    0 0
  8. So how could Prof. Pielke estimate the statistical power of the test? There are many ways you could go about this, but this would be my recipe: According to Tamino, temperature time series are well approximated by a linear trend with ARMA(1,1) noise process. The first step would be to detrend the data and estimate the parameters of the ARMA(1,1) noise process (see this article by Tamino and this one). I can then simulate as many synthetic temperature times series as I like, with the expected effect size under the alternative hypothesis (warming has continued at a constant rate throughout the UAH dataset), by adding ARMA(1,1) noise to a linear trend of (IIRC) 0.138 degrees per decade. Next I generate a large number of these, where we know by construction that the null hypothesis is false, and see how often we get a statistically significant trend from 2002-2011. The proportion of trials where we can reject the (false) null hypothesis (zero trend) is an estimate of the statistical power of the test. I very much doubt it will be 0.8 or above, which is the traditional threshold for useful statistical power. Note we should test the significance of the trend assuming ARMA noise, not white noise. We know the data are correlated, so the confidence interval for the OLS trend will be optimistically narrow, which biases the test. This would be my approach, and if Prof. Pielke could demonstrate useful power by an estimate of that nature, then I would be convinced that the "flat trend since 2002" was of genuine scientific interest, rather than just the a random artifact from looking at a noisy signal over too short a period. Unlike me, Tamino is a genuine expert in time series analysis, so he may have a better test, or be able to pick holes in my recipe, I would of course take any critcisim seriously. The ball is in Prof. Pielke's court; if he wants to convince us that the post-2002 trend is interesting, I have set out what he needs to do. If he wants to concede the point and move on, then that also is fine.
    0 0
  9. It seems to me that a good way to determine the significance of a trend in a particular portion of a time series is to perform an analysis on the entire length of the series based on an assumed model. The model will prescribe the length of the series needed. The model is based on theories of various phenomena in the physical system being studied, in this case the atmospheric temperatures and their strong dependence on ocean-atmosphere heat exchange in quasi-cycles, in particular ENSO. When the entire time series is analyzed based on the model, the analysis produces an explanation of the variance in the series which can then be used to determine the statistical significance of a trend in a portion of the series. Here's an example: http://www.atmos.berkeley.edu/~jchiang/Class/Fall08/Geog249/Week13/gv91.pdf
    0 0
  10. Here is another way in which Prof. Pielke could demonstrate that the post-2002 trend is interesting, rather than just a likely artifact from looking at a noisy time series over too short a timespan. Rather than basing the argument on the failure to reject a null hypothesis, he could instead reframe it so that he was arguing for an alternative hypothesis, for instance H1: The rate of warming has diminished since 2002 And then see if he could reject the null hypothesis H0: The rate of warming has remained constant throughout He is then back in the normal statistical hypothesis testing setting, where he has to show that the observed trend is inconsistent with H0. This is straightforward, if you detrend the data, assumung a constant linear trend over the entire time series, H0 can be rejected if the residual trend from 2002-present is statistically negative. Now if we are going to talk about bridge-building, then I would say that I have built my side well over half way. I have listened to Prof. Pielkes argument, but I have seen what I consider to be a fatal flaw. I have pointed out this flaw, and remained patient and civil when my criticism has been repeatedly ignored (which is a rather disprepectful thing to do). I have now explained why the criticism in some detail to show why it is important, and even suggested two ways in which Prof. Pielke could strengthen his argument to the point where I would accept it. The latter certainly goes well beyond duty; the onus was always on Prof. Pielke to test his hypothesis before publicising it, as he himself said. I am deinitely in favour of building bridges with the skeptics, but if the the foundations of the bridge have to be built on the tacit acceptance of scientific arguments that are clearly fundamentally flawed, then the bridge is unlikely to stand for long, even if it can be completed. I doubt any of us here at SkS expect skeptics to accept any argument just because we think it is obvious, and it is not unreasonable to expect the same from the skeptics (a term I view as high praise rather than perjorative).
    0 0
  11. Dikran, that was a great explanation of power!
    0 0
  12. DM#60: "it is not unreasonable to expect the same from the skeptics" There are 'skeptic' circles with a far shallower understanding of the foundations of this bridge. I'll go out on a limb and make a devil's advocate speculation: In those circles, this exchange will be played as 'Dr. P showed that warming really did stop and they couldn't show that to be false.' Of course, the other hypothesis could be that there will be universal acceptance within the 'skeptic' world that it cannot be proven that warming stopped. Anyone care to give odds on which hypothesis will win out?
    0 0
  13. Of course muon, that's the way it will inevitably be represented by some. There is nothing anyone can do about that. The attentive reader who wants to know will notice that Dr P in fact showed nothing. Sure he showed that there is no warming "trend" since 2002 but also readily acknowledged this was meaningless because no trend, or lack thereof, can be establish over that time period. Then when asked by why he would devote so much attention to a meaningless trend, he was rather evasive. I must say I found that whole exchange rather surprising considering Dr P's background. We had countless occurrences on this site of people arguing about meaningless short term "trends", I recall there were threads devoted to the explanations of why short term says really nothing. I do not remember any respectable scientist with a deep understanding of noisy time series making that same argument.
    0 0
  14. #57, Spaerica, did glance over the document, and yes most if not all are equilibrium models on which perturbation is applied to find out how well behaved those are. Equilibrium sensitivity etcetera. But is cloud forming, mainly shape etc. governed by a equilibrium model? Is the change of coastal areas and changing flow patterns governed by an equilibrium model? Are volcano eruptions, earthquakes etc governed by some equilibrium model? One can consider all those as governing conditions to be input to an equilibrium model, but those boundary conditions are rather unpredictable. Clouds, coastal lines etc can be modelled into by chaotic models perhaps. No idea if that will obey normal statistics. Volcanoes etc. are related with radio-active decay so one can assume those will follow a Poison distribution.So to say: any one can pick a starting date, before or after a large change in one of these parameters and "proof" or "disprove" a statement based on the statistics of an equilibrium model. One can have endless debates on the time period to chose whether not to include, exclude those singularities.
    0 0
  15. Ger The models are dynamical systems, forcings can be applied to them to simulate both the transient and equilibrium responses. For example of analysis of transient response, IIRC there were several papers on modelling the transient response to the Pinatubo eruption. However discussions of the workings of the models are clearly off-topic for this thread, as they are not involved in assessing whether there has been a statistically significant change in the observed trends. So please take the discussion to a more appropriate thread, such as "the models are unreliable".
    0 0
  16. I might have given the impression to talk on the workings of the model. Not intended in that sense. Pielke is refering to the models of which he doubts that all effects are taken into account to their proportion. The data-sets collected and checked did make him choose that time frame of a 13 years for his model and he was proven wrong by doing so: should be at least 17 years or more. Now with the doubts on the model set aside, is not the topic here, he gained another 4 years, lets move on. Not answering the statistical significant question indicates more or less the answer; it is not significant what he has found. But who can predict the dataset to come for the next 4 years to verify if the models are still correct?
    0 0
  17. Ger, all we can say is that models so far are doing a very good job of predicting 30 year averages and trends which gives us some confidence that they are capturing the physics adequately. Who can predict if the next probe to Mars will go off-course because models so far have failed to capture some important aspect of gravity? If the facts change, then so will the science, but in planning for the future you have to work with best models of reality possible for the moment rather than depend on some wishful thinking that they are wrong.
    0 0
  18. Climate models have two distinct uses that should not be confused, first they can predict the linear trend over long periods of time, and that can be done with a broad range of models including simple equilibrium models. Or, they can, as Santer showed, include a more comprehensive set of natural cycles to show the variances in the temperature trend over time. One result of the second use of models is a definitive statement about the length of real world time required to show a change in trend. Ger pointed out that the trend changes may depend on factors that are not in the model (but I would also point out that many models add volcanoes) and those factors may or may not change the statistics of temperature trend variances. An alternative to the modeling is, as I pointed out above, looking at a long time sample of temperature measurements to determine the variances of the temperature trend. This sort of analysis has been commonplace for many years, e.g. http://acacia.ucar.edu/cas/jhurrell/Docs/climchange.decvari.pdf It is not difficult for climate models to simulate the variances created by these decadal natural cycles, nor is it that difficult to add typical exogenous events like volcanoes, nor is the chaotic nature of weather a problem for deriving the statistics. Either climate models or long running temperature series can produce the required statistics to determine the period and amplitude of natural factors superimposed on the AGW trend. However, one or the other is necessary to determine the variances in the trend. The answer to the question of period of time for change in trend to be significant (i.e. 13, 17, 20 years) must come from the consideration of the periods of time of natural cycles be they modeled in GCMs or derived from long running temperature measurements.
    0 0
  19. I see you have been busy commeting (and presenting q cartoon) while I was on travel and off of the internet. It seems SkS cannot get away without ridicule. :-) Nonetheless, in this first comment since my return, I want to make sure my perspective on the recent MSU lower tropospheric trends is clear. I keep getting asked in the comments why I do not complete a statistical evaluation of the data. The reason should be rather obvious but seems to still not be clear. So here it is. First, I am NOT saying anything about the effect of the lack of warming in the global-annual average surface temperature since 2002 or 1999 (or whatever start year) on the long term trend. I agree it is too short of a record. However, it is trivial in my view (and does not need any statistical evaluation) to see that the warming has halted, with this being clearly seen in the RSS Figure 7 in http://www.ssmi.com/msu/msu_data_description.html#channels. Whenever I show the RSS MSU data (including the lower stratospheric data which you have ingored in all of the comments), no one has raised the objection stating that the data is not ~flat in recent years. In my talks (and you soon will be able to hear the Waterloo talk if you chose) you will hear me highlight that this lack of warming does not tell us anything about the longer term trend. Your hypothesis that this is just part of the natural variability certain might be correct. It could also mean that the longer terms trend includes a larger natural component than you assume based on the model results. It could mean the other human climate forcings play a larger role than represented in the models. We need to explore each of these issues (and others) rather than being dogmatic and insist the models are faithfully replicating this aspect of the climate system. By ignoring the obvious (which is hardly "meaningless"), plays into the hands of those you call "skeptics". Why not just state that you see this flatness in the data, but have concluded it is part of the natural variability as represented by the climate model predictions. Then we can move on to other issues.
    0 0
    Response:

    [DB] "I see you have been busy commeting (and presenting q cartoon) while I was on travel and off of the internet. It seems SkS cannot get away without ridicule. :-)"

    While it is appreciated that you partake of and enjoy the wide variety of threads available here at Skeptical Science it is recommended that you comment on the threads specific to the core of the above statement. 

    Thus, if you have a probelem with the subject matter of the cartoon in question, it is advised that you take that matter there instead of remonstrating about it here, where it is OT (indeed, please share with us - on the appropriate thread - just specifically how the cartoon in question is ridiculing anyone in specific).  After all, cartoons on blogs are hardly anything new...

    "...it is trivial in my view (and does not need any statistical evaluation) to see that the warming has halted, with this being clearly seen in the RSS Figure..."

    Again you repeat your mantra of the power of visual inspection in lieu of actual analysis.  In that case, I invite you to visually inspect the figures in this comment.

    As someone once said, "You do not need statistics to see the obvious."

  20. Dr. Pielke - "Why not just state that you see this flatness in the data, but have concluded it is part of the natural variability as represented by the climate model predictions" With all due respect, that has been stated multiple times by multiple participants in this discussion, and in fact is a core conclusion of Santer et al. (2011), as linked and quoted in the opening post of this thread: "Because of the pronounced effect of interannual noise on decadal trends, a multi-model ensemble of anthropogenically-forced simulations displays many 10-year periods with little warming. A single decade of observational TLT data is therefore inadequate for identifying a slowly evolving anthropogenic warming signal. Our results show that temperature records of at least 17 years in length are required for identifying human effects on global-mean tropospheric temperature." (emphasis added) To be quite blunt, you are presenting a strawman argument by claiming that others do not recognize the effects of natural variability (they do, which is one of the major points of this discussion), and furthermore contradicting yourself when you "agree it is too short of a record" and then immediately claim "that the warming has halted". I find (IMO) this approach rather disingenuous.
    0 0
  21. Dr. Pielke, several times we have noted that the TLT trend has been essentially flat over recent short periods (which are not statistically significant). We have also discussed that this 'flattening' can be explained by increases in aerosol emissions, decreases in solar activity, and changes in ENSO (the former two of which are not 'natural variability,' but rather are forcings). As for 'ridicule', this is not an activity SkS engages in. And those who live in glass houses should not throw stones.
    0 0
  22. Roger, You seem to be indulging in an abuse of terminology: - When you say, "The warming has halted," that implies that a warming trend has turned around. - But it has already been established quite clearly that no trend can be established over such short time intervals. So such a claim simply has no meaning. - By analogy, one doesn't claim that the local climate has gone into a local cooling period during the last quarter of the year: It's inappropriate to attempt to define a climate trend over such a short period.
    0 0
  23. Dr Pielke, I refer you back to my figure in #5. In 1985 (or 1994), or any of a number of low points in the record, could it honestly be said that "warming had halted", or that the trend was remotely likely to change, based on the available data? You lose a very great deal of credibility by concentrating on the noise rather than the signal.
    0 0
  24. Dana @71, Re "Those who live in glass houses". I do not agree with that assessment of what is going on here as it suggests that SkS was indeed ridiculing Pielke. SkS was not doing so, in fact, John H. has said as much and I believe him. I will post more on that thread soon. As for these statements made by Dr. Pielke's post @69: "Your hypothesis that this is just part of the natural variability certain might be correct. It could also mean that the longer terms trend includes a larger natural component than you assume based on the model results. It could mean the other human climate forcings play a larger role than represented in the models. We need to explore each of these issues (and others) rather than being dogmatic and insist the models are faithfully replicating this aspect of the climate system. Also, "By ignoring the obvious (which is hardly "meaningless"), plays into the hands of those you call "skeptics"." It sadly seems that Dr. Pielke is intent on misrepresenting SkS's position, attributing to us positions that we do not hold and engaging in inflammatory rhetoric rather than objective science (e.g., "dogmatic"). Also, I fail to see how Dr. Pielke could have not seen the "flat" trend in the RSS data for 1998-present shown above. Note that the GISTEMP (NASA) surface data (land and ocean) for 1998-present shows a rate of warming of 0.11 C/decade for 1998-present (and we humans live near at the surface not the lower troposphere near 600 mb/14 000 ft). Although I have not tested the statistical significance of that particular trend-- it is still probably too short a period of time for which to derive a statistically significant trend, even for the GISTEMP data. But it does highlight again that one has to use a very particular dataset and for a very particular short-period of time to make the (very misleading) claim that the warming has 'halted'. Dr. Pielke has noted that we humans live on land and that "with respect to the global average surface temperature trend, the land portion makes up a significant portion of it". Well here is what has been happening at the land surface (from NASA)[we are aware of the limitations of the station data and Dr. Pielke has posted about that so there is no need to rehash them again here please]: [Source] Rather than SkS "ignoring the obvious" as Dr. Pielke falsely claims, I would argue that it is the "skeptics" (some who should know better) who are ignoring the obvious regarding the statistical relevance (and power) of their claims when they calculate trends for statistically insignificant periods of time and then make very definitive statements regarding the implications of that trend. Now while continuing arguing in circles may suite some who wish to create the impression that there is a debate, ignoring and dismissing inconvenient facts about statistical tests (and power) is not open for debate. There is a correct way to calculate a statistically meaningful and robust trends from noisy data. And to be quite candid, it was incorrect for Dr. Pielke to choose 1998, and worse yet 2002, as start dates for which to support the claim that "global warming has halted". There are no shades of gray on this. Had such a calculation and attendant claim that "global warming has halted", been been submitted for review in a reputable journal, that portion of the analysis and text would have received harsh criticism and the author/s would have been told to add a very clear caveat that the trend was not statistically significant, but far more likely they would have been instructed to remove the claim as it was not supported by the data in question.
    0 0
  25. I find it bemusing that Pielke Snr can acknowledge that the post-1998 interval is too short an interval with which to determine (with statistical power) any trend, and then immediately - in the very same sentence, no less - claim that "the warming has halted". This is truly a bizarre stance, and one that implies the action of some sort of cognitive dissonance. Further, Pielke Snr seems to be confabulating planetary warming with perceived plateaux in planetary surface temperature*. The two are separate phenomena, correlated certainly, but not in lock-step. If Pielke Snr has the reference for the work that the planet has in fact not warmed since 1998 (or whenever) I would be most interested to read it. [* I perform a number of polar biology insulation experiments with my students that involve ice baths. These students understand that the ice baths are continuously warming as they sit on a bench, even as the temperature within the baths is not increasing...]
    0 0
  26. ...this 'flattening' can be explained by increases in aerosol emissions, decreases in solar activity, and changes in ENSO (the former two of which are not 'natural variability,' but rather are forcings)... Dana, an even more precise description of those three examples is 1) a mostly anthropogenic, but partly natural (varying) forcing, 2) a naturally varying forcing in several modes and 3) a natural variation mostly resulting in ocean-atmosphere exchange but also some forcing. One could look at this paper ftp://128.95.176.42/pub/breth/CPT/cess_jcl01.pdf and conclude that cloud forcings from ENSO generally cancel so they can be disregarded. But the paper shows that over short periods they don't and that is what I and others would call a naturally varying forcing.
    0 0
  27. Bernard J. - You write "If Pielke Snr has the reference for the work that the planet has in fact not warmed since 1998 (or whenever) I would be most interested to read it." I have never said that. What I have reported on is the limited warming in the upper oceans in recent years (since 2004) which is clearly evident in http://oceans.pmel.noaa.gov/. If you (and the others) want to ignore the obvious you certainly can do that. Even Kevin Trenberth and Jim Hansen have not ignored this observation. The lower troposphere similarly has not warmed in recent years, nor has the lower stratosphere cooled. Stating the obvious should not be a source of disagreement. Your analogy to the ice baths is certainly unclear except I like your connection to heat (Joules) rather than temperature directly. What I presume everyone will agree with is that from 2003 onward, the most appropriate diagnostic to monitor global warming is the ocean heat content changes. If we can agree on that (and since you use the bath tub analogy which involves heat in Joules), than this thread and the others would have been time well spent debating. In terms of this thread, enough has been said. I will be posting my views on the experience on my weblog sometime this week.
    0 0
  28. Dr Pileke says "If you (and the others) want to ignore the obvious [...]" The obvious is not ignored, the point is what that means. It may be important for climate variability or for the warming trend. As apparently you agree that the short term trend is not statisticaly significant, I assume you're talking about variability, which is a completely different beast and as such it should be dealt with. and "I presume everyone will agree with is that from 2003 onward, the most appropriate diagnostic to monitor global warming is the ocean heat content changes." A lot of words has been said on the limitations of our knowledge of ocean heat content and that we need to consider many different metrics together. Why it should be otherwise is not clear to me.
    0 0
  29. Prof. Pielke I am somewhat reluctant to post on this topic again as you are merely repeating assertions that have already been addressed without further elaboration or justification. However I just want to make my position clear. I have already explicitly agreed with you on more than one occasion that the temperature trends in the UAH/RSS lower trophosphere datasets have not been significantly non-zero since 2002, and have been essentially flat. Indeed that is obvious. However, you have not established that this is meaningful, or even surprising. Such periods of little or no warming have occurred before in these datasets and undoubtedly will occurr again, they are also reproduced in model output (although for me this thread is largely about the observations rather than the models). As I have explained, the period is too short to be able to decide whether there has been a change in climate, or whether the flatness of the time-series is an artifact of natural variability. Both hypothesis remain plausible given the data from 2002-present, however there is no statistically significant evidence for a change in climate, and no physical reason has been suggested. So as far as I can see it is of little climatic relevance, but of great interest to those interested in the internal variability. It is interesting to refine our understanding of the redistribution of energy, but it says nothing about AGW. Now if you can demonstrate that there is statistically significant evidence for a change in the climate, or even just that the flatness of the trend is unusual or suprising, then you might generate some interest in your argument, but the onus is on you to demonstrate the evidence. Merely saying again and again that it is obvious is unconvincing when the statistical evidence tells a different story. The ball remains in your court.
    Just as a reminder, Prof. Pielke endorsed the folloing summary of scientific method: 1. Ask a Question 2. Do Background Research 3. Construct a Hypothesis 4. Test Your Hypothesis by Doing an Experiment 5. Analyze Your Data and Draw a Conclusion 6. Communicate Your Results" And he has explicitly stated an hypothesis "the trends during this time period [2002-present] are different than the trends earlier in the time period [1979-2002]." The periods in [] are inferred from the earlier content of that comment. However, as far as I can tell Prof. Pielke has not tested this hypothesis (other than to look at the data and claim that it is obvious), and has steadfastly refused to answer questions relating to statistical significance or the statistical power of the test. Thus he has not followed steps four or five in the summary of scientific method that he himself endorsed.
    0 0
  30. Dikran Marsupial - Perhaps this will clarify, change "the trends during this time period [2002-present] are different than the trends earlier in the time period [1979-2002]." to "the 9 YEAR TREND during this time period [2002-present] IS different than the TREND FOR the time period [1979-2002]. THIS SHORT TERM TREND DIFFERENCE IS NOT LONG ENOUGH TO CONCLUDE THAT THE LONGER TERM TREND HAS BEEN CHANGED. HOWEVER, IT DOES PROVIDE US WITH A METRIC TO FOLLOW IN ORDER TO SEE HOW LONG THIS DIFFERENT TREND WOULD HAVE TO CONTINUE BEFORE WE CAN CONCLUDE THE LONGER TERM TREND HAS CHANGED IN TERMS OF STATISTICAL SIGNIFICANCE." Now, you are more of a statistics expert than I. Please tell us how many more years of the 2002 to 2011 trend would have to continue before one could conclude the long term trend has changed. This would be a diagnostic that both the SkS readers and the "skeptics" would agree on.
    0 0
    Moderator Response: [Albatross] Please avoid using all CAPS. Thanks.
  31. Dikran, would you agree (or disagree) that the period required for statistical significance of a change in trend is shorter for ocean heat content than it is for GAT? IMO, it would be shorter for the reason that OHC is affected by fewer modes of natural variability than GAT, particularly the decadal ocean atmosphere cycles or quasi-cycles.
    0 0
  32. pielkesr The problem with your revised statement is that it is incorrect to assert that one trend IS different from another unless the difference in trends is statistically significant. This is because the trend is a statistic that is only estimated from data, we don't know the true value of the trend, the best we can do is to compute a confidence interval that is indicative of the uncertainty of the estimate (loosely speaking if it is a frequentist confidence interval). So to assert that the trends actually are different you need to establish that the uncertainty in the estimation of the trends is sufficiently small that we can be confident that a difference actually exists. As for how long we need, the estimate of 17 years given by Santer et al sounds reasonable, and is consistent with other studies I have seen, though I haven't performed the calculation myself. In the case of your third hypothesis though, you only need to show that the difference is statistically significant, and don't need to consider the power of the test so much as you are arguing against the null hypothesis (the actual trends are the same). There is a complication due to the choice of the start point, but that is a finer point. We could perhaps agree that there was a difference in the estimated trends from 1979-2002 and 2002-2011, but that the difference was statistically insignificant, but that is a pretty bland statement and couldn't be used to support any statement about the climate.
    0 0
  33. Eric (skeptic) I wouldn't agree or disagree, because without investigating the data I simply don't know. Fortunately there are methods for estimating the statistical power of a test, which can address such issues (although of course you also need to perform the test in collaboration with domain experts so you know what the issues are so the analysis is based on appropriate assumptions).
    0 0
  34. Hello Dr. Pielke @77, "What I have reported on is the limited warming in the upper oceans in recent years (since 2004) which is clearly evident in http://oceans.pmel.noaa.gov/. If you (and the others) want to ignore the obvious you certainly can do that. " This is now getting very annoying Dr. Pielke. You may not realize it but you are making strawmen arguments. Also, I urge you (again) to please stop misrepresenting our position (this time on OHC) and going off topic. Anyone following our discussion with you knows that what you said above about us "ignoring the obvious" is simply not true. Additionally, you initially claimed on your blog that there has been zero accumulation of heat in the upper 700 m of the oceans since the beginning of 2003 (that error is still present on your blog for all to see), not "limited warming" since 2004. I am, sadly, beginning to have serious doubts that you are interesting in discussing the science in good faith.
    0 0
  35. DM#82: "it is incorrect to assert that one trend IS different from another unless the difference in trends is statistically significant." Could not agree more with that statement. This is essentially a signal processing problem, that of extracting meaningful changes in trends from noise. As such, this working definition of statistical significance is relevant: Statistical significance can be considered to be the confidence one has in a given result. In a comparison study, it is dependent on the relative difference between the groups compared, the amount of measurement and the noise associated with the measurement. In other words, the confidence one has in a given result being non-random (i.e. it is not a consequence of chance) depends on the signal-to-noise ratio (SNR) and the sample size. If we cannot establish the significance of the supposed change in trend, then how can we say that we are confident in its existence? And if we are not confident in its existence, how can we base any conclusion on it?
    0 0
  36. Hi Albatross "Additionally, you initially claimed on your blog that there has been zero accumulation of heat in the upper 700 m of the oceans since the beginning of 2003 (that error is still present on your blog for all to see), not "limited warming" since 2004. I am, sadly, beginning to have serious doubts that you are interesting in discussing the science in good faith." You should date when I made these statements. In the figure in Pielke Sr., R.A., 2008: A broader view of the role of humans in the climate system. Physics Today, 61, Vol. 11, 54-55. http://pielkeclimatesci.files.wordpress.com/2009/10/r-334.pdf provided by Josh Willis, there was no warming, averaged over a year using his best estimate of the mean (with uncertainties shown). In 2011, the plot http://www.nodc.noaa.gov/OC5/3M_HEAT_CONTENT/, the plot is still ~flat since ~2003. However, on SkS, data has been shown that has some warming in the upper oceans. In order to be inclusive of your view and that of others at SkS, more recently, I wrote (and presented at my Waterloo talk) that there has been some warming. In any measure, however, it is well below what the models predict in terms of the long term accumulation. I see in the SkS post bt Rob Painting that it is expected to resume at a higher rate. This is a good test of the models and time will tell. In the mean time, can you avoid your nitpicking. :-)
    0 0
  37. In addition to Dikran's description of the Scientific Method in #79, I think it is helpful to keep in mind that when writing about scientific work, it is fundamentally important to distinguish between observation, interpretation, and conclusion. In terms of something statistical, the data are observations, the regression is an interpretation of the data, but to draw conclusions pretty much requires some sort of significance testing. In Dr. Pielke's comment #69, he says
    First, I am NOT saying anything about the effect of the lack of warming in the global-annual average surface temperature since 2002 or 1999 (or whatever start year) on the long term trend. I agree it is too short of a record. However, it is trivial in my view (and does not need any statistical evaluation) to see that the warming has halted,
    ...so that although he admits that the time period is too short for significance testing, he is going to go ahead and draw a conclusion anyway. The phrase "the warming has halted", is not an observation. It is not an interpretation. It is a conclusion. An unjustified (and in this case, unjustifiable) conclusion. Dr. Pielke is trying to say something, and he appears to be wanting to be able to say it even though he knows there is no significance testing to back it up.
    0 0
  38. Bob Loblaw - You can keep seeking to spin, but the data do speak for themselves. If, for example, there are no more Joules in the climate system after one year, the heating (in terms of an annual average) there is no accumulation of heat that time period. It says nothing about the long term trend, but it certainly not "noise" as long as the measurements are robust. Statistical uncertainty can be placed around the actual value, as Josh Willis did. If you cannot agree to this obvious fact, I am sure others who read this weblog will. Time to move on.
    0 0
    Response:

    [DB] "If, for example, there are no more Joules in the climate system after one year"

    Straw man.  In the absence of any significance testing, which you adamently refuse to do, a time series of just one year is meaningless.  Therefore any conclusions (those comments/inferences you persist in making) which follow are also without meaning; a noise in the wind.

    The science moves on to things of substance; your persistence in prosecuting this meme speaks volumes.

  39. Hi Dr. Pielke @86, "In the mean time, can you avoid your nitpicking. :-) " I'm sorry, I was somehow of the understanding that eminent scientists should be held to a higher standard, and that getting the facts right is what we scientists strive to do. Silly me :) Some, not I, might even go so far as to post a picture of Pinnochio in association with someone's name because they were perceived to be in error ;) The nice things about blogs Dr. Pielke, is that it is much easier to make corrections or post updates than it is to get a corrigendum published. I'm sure that readers here are looking forward to seeing you correct the record on your blog regarding 1) The 1998 start date, 2) The relative contribution of CO2 and 3) The claim about OHC. You have posted updates in the past on your blog, so doing so is not without precedent. PS: I have responded to your claims about OHC here.
    0 0
    Moderator Response: fixed link
  40. Bob @87, Excellent points. Despite claims to the contrary, the spin is not coming from you.
    0 0
  41. Dr Pielke @ 88... It seems to me that global warming has stopped before, only to come back again. Below is every 10 year trend in the UAH record. Is there a compelling reason we should expect this time to be different? [Source]
    0 0
  42. Re. Roger Pielke @88. Well, if the data really do speak for themselves, then why do you need to say "the warming has stopped"? And just exactly what "warming" are you refering to? The warming since yesterday? Last week? No, it is the long-term statistically significant trend. If all you want to really say is "there is no accumulation of heat that time period", then say it. By making statements like "the warming has stopped", you are comparing that time period to what has come before, and making a statement about its [perhaps non-statistical] significance. You are attempting to attach importance to the data, and that implied importance is not supported by a proper statistical analysis. Basically, your claim that "the warming has stopped" is just handwaving, and your desire to "move on" appears to me to be a desire to avoid proper scientific scrutiny of your claim. It may be that in other areas of the blogosphere, a statement by Dr. Pielke that "the warming has stopped" will be accepted without skepticism and trumpeted from the rooftops, but from what I've been reading here at SkS over the past few months suggests that this isn't the place to try to get away with that. ...and trying to call it an "obvious fact" or saying "it is trivial" - as if anyone that interprets the data differently from you and comes to a different conclusion is an (-snip-) - does not seem a particularly constructive way of engaging in a dialogue.
    0 0
    Response:

    [DB] I don't believe that Dr. Pielke at any point has characterized anyone with that specific, snipped, term.  Let us not descend to the verbiage used at the website RPSr defends.

  43. Dr Pielke, can you agree with the following statement: "The TLT temperature trend from 2002-present is not statistically significantly different from the TLT trend from 1979-present. We must therefore assume, in the absence of data to the contrary, that the significant trend from 1979 to present continues." Yes or no? Additionally, what fraction of the world's oceans is 0-700m? Why not consider a greater fraction of the world's oceans, as pointed out to you by Albatross on the linked thread? It looks to me like a few Joules of heat are accumulating between 700-2000m.
    0 0
  44. pielkesr#88: "It says nothing about the long term trend, but it certainly not "noise" as long as the measurements are robust." I beg to differ: Robust measurements of a noisy signal may indeed be noise. That's a commonplace problem in seismic exploration. Much effort in geophysics goes to the improvement of SNR through acquisition methods; the noise may be reduced, but it is always there. Look to particle physics for other examples: are those faster-than-light neutrinos signal or noise? Are GCRs 'signal' against a background of solar cosmic ray 'noise'? Both are present in very robust measurements.
    0 0
  45. Adding to muoncounter's reply, since the signal we are interested in is the long term trend, then by definition all the short-term changes are noise interfering with us detecting that signal, even if those short-term changes are measured without error.
    0 0
  46. Prof. Pielke You have put forward the hypothesis that "the 9 year trend during this time period [2002-present] is different than the trend for the time period [1979-2002].". Do you agree that the difference between these trends is not statistically significant, yes or no?
    0 0
  47. Dikran, regarding your question about the statistical significance of the difference in trends 1979-2002 and 2002-present, it depends on the assumptions about the domain (in this case TLT). Could you please point out where those assumptions are described?
    0 0
  48. Eric (skeptics) A nine year trend is so short that the difference is extremely unlikely to be statistically significant for any reasonable set of assumptions. It is Prof. Pielke's hypothesis, and so it is his responsibility to test his hypothesis rather than mine, but if he can provide a plausible set of assumptions under which there is a statistically significant difference in the trends, then that would be a perfectly reasonable answer as far as I am concerned. However, whether the difference in trends is statistically significant or not, I would like Prof. Pielke to give a direct answer to this question. This question can be answered with a "yes" or a "no", the difference either is statistically significant or it isn't, and I don't think it unreasonable to ask an eminent scientist whether his hypothesis has statistically significant support from the observations or not. If you would like to help Prof. Pielke by stating the appropriate set of assumptions and performing the test yourself, that would make a useful contribution to the discussion.
    0 0
  49. Regarding "[DB] "If, for example, there are no more Joules in the climate system after one year" Straw man. In the absence of any significance testing, which you adamently refuse to do, a time series of just one year is meaningless" you do not understand the physics. The heat content of the climate system can be determined on a yearly basis. There is no lag as with the response of the surface temperature trend to heating. Anyway, there has been enough said on this thread for readers to make up their own mind. I will be signing off with this thread here, but will have several questions for SkS in the next day or so on my weblog that I will invite you to discuss on SkS.
    0 0
    Response:

    [DB] "you do not understand the physics."

    Goalpost shift.  When confronted with a question (from Dikran about significance testing by you) you repeatedly and pointedly refuse to answer the question.  In this case, when pointed out that a time series of one year, in the vacuum of any significance hypotheses, is meaningless, you goalpost shift and question the knowledge of the questioner.  And again dodge the real question.

    For all readership by now are painfully aware, the real question is not whether I or they understand the physics.  The real question, whether you understand significance testing, is left patently answered by your utter refusal to properly address the question & continual efforts to change the subject.

    So unless you wish to properly answer Dikran, the answer is that you do not, that there is no significance to your short time series and the conclusions you continually impugn to them and that the time to move on has indeed come.

  50. Prof. Pielke I would implore you not to sign off before giving a direct answer to the question of whether the evidence for your hypothesis that "the 9 year trend during this time period [2002-present] is different than the trend for the time period [1979-2002]." is statistically significant or not. The readers will indeed make up their own minds about what a failure to answer that question means, and I would have thought that they are very likely to conclude that (i) you know that the answer to this question is "no" (ii) you are unable to admit that the answer is "no" and (iii) you view your subjective interpetation of the observations as being more reliable than the objective statistical testing that are a cornerstone of modern scientific method. As it stands you are likely to do substantial harm to your scientific reputation, which is not something I want to see happen. I would rather we continued with a discussion of the science that aimed to uncover the truth, whatever that truth might be.
    0 0

Prev  1  2  

You need to be logged in to post a comment. Login via the left margin or if you're new, register here.


The Consensus Project Website

THE ESCALATOR

(free to republish)


© Copyright 2024 John Cook
Home | Translations | About Us | Privacy | Contact Us