


 Arguments


2018 SkS Weekly Climate Change & Global Warming Digest #51
Posted on 23 December 2018 by John Hartz
Story of the Week... Toon of the Week... Graphic of the Week... Video of the Week... Reports of Note... Coming Soon on SkS... Climate Feedback Reviews... SkS Week in Review... Poster of the Week...
Story of the Week...
The Green New Deal, explained
An insurgent movement is pushing Democrats to back an ambitious climate change solution.
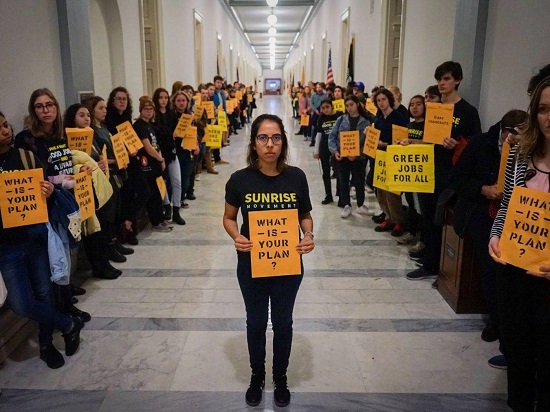
Photo Credit: Sunrise Movement Facebook Page
If the recent report from the Intergovernmental Panel on Climate Change is to be believed, humanity has just over a decade to get carbon emissions under control before catastrophic climate change impacts become unavoidable.
The Republican Party generally ignores or denies that problem. But the Democratic Party claims to accept and understand it.
It is odd, then, that Democrats do not have a plan to address climate change.
Their last big plan — the American Clean Energy and Security Act — passed the House in 2009 but went on to die an unceremonious death before reaching the Senate floor. Since then, there’s been nothing to replace it.
Plenty of Democratic politicians support policies that would reduce climate pollution — renewable energy tax credits, fuel economy standards, and the like — but those policies do not add up to a comprehensive solution, certainly nothing like what the Intergovernmental Panel on Climate Change (IPCC) suggests is necessary.
Young activists, who will be forced to live with the ravages of climate change, find this upsetting. So they have proposed a plan of their own. It’s called the Green New Deal (GND) — a term purposefully reminiscent of Franklin Delano Roosevelt’s original New Deal in the 1930s — and it has become the talk of the town. Here are Google searches from the past few months:
The Green New Deal, explained by David Roberts, Energy & Environment, Vox, Dec 21, 2018
Toon of the Week...
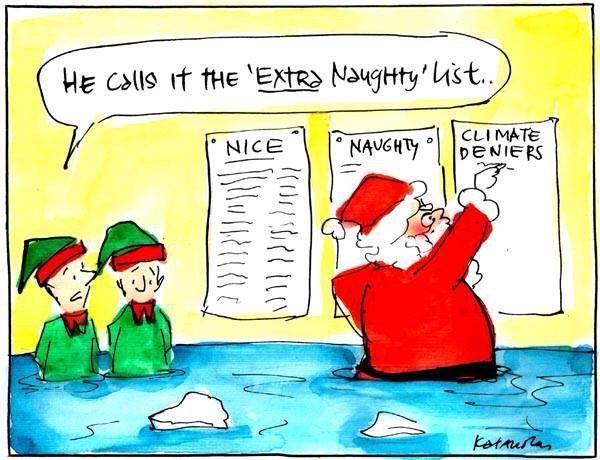
Hat tip to the Stop Climate Science Denial Facebook page.
Graphic of the Week...
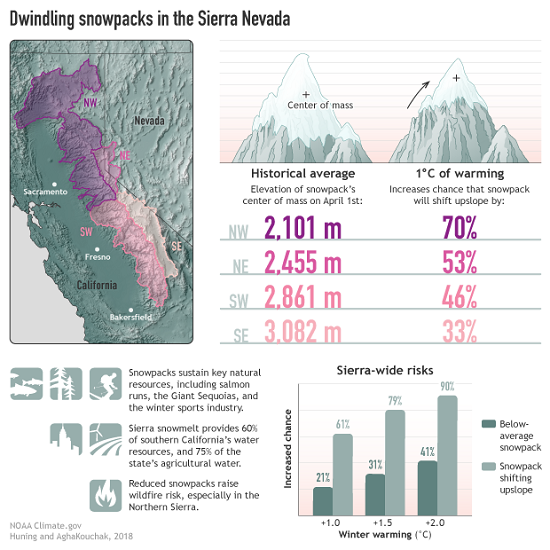
Image Credit: NOAA Climate.gov / Fiona Martin
Alternate Version: Sierra Nevada snowpack infographic (large)
Warming winters and dwindling Sierra Nevada snowpack will squeeze water resources in parts of California by Michon Scott, NOAA's Climate.gov, Dec 19, 2018
Video of the Week...
Reports of Note...

The Bureau of Meteorology and CSIRO play an important role in monitoring, analysing and communicating observed changes in Australia's climate.
This fifth, biennial State of the Climate report draws on the latest monitoring, science and projection information to describe variability and changes in Australia’s climate. Observations and climate modelling paint a consistent picture of ongoing, long term climate change interacting with underlying natural variability.
These changes affect many Australians, particularly the changes associated with increases in the frequency or intensity of heat events, fire weather and drought. Australia will need to plan for and adapt to some level of climate change. This report is a synthesis of the science informing our understanding of climate in Australia and includes new information about Australia’s climate of the past, present and future. The science underpinning this report will help inform a range of economic, environmental and social decision-making and local vulnerability assessments, by government, industry and communities.
Click here to access the State of the Climate: 2018 report.
Coming Soon on SkS...
- 2018 was the hottest La Niña year ever recorded (Dana)
- Merry Christmas (John Cook)
- Global warming ‘hiatus’ is the climate change myth that refuses to die (Kevin Cowtan)
- School strike for climate - save the world by changing the rules (Greta Thunberg)
- New research this week (Ari)
- 2018 SkS Weekly Climate Change & Global Warming News Roundup #52 (John Hartz)
- 2018 SkS Weekly Climate Change & Global Warming Digest #52 (John Hartz)
Climate Feedback Reviews...
Popular “Friends of Science” video promoted by Youtube presents long list of climate myths
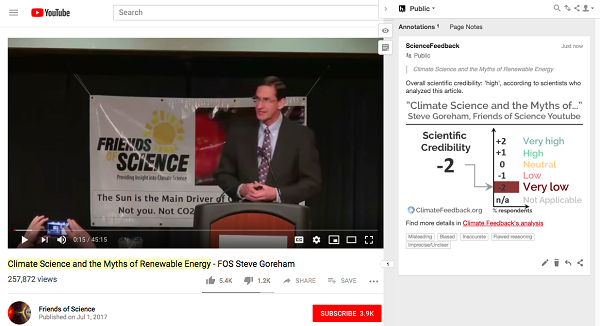
Climate Feedback asked a team of climate scientists to review the popular video, Climate Science and the Myths of Renewable Energy - FOS Steve Goreham posted by Friends of Science on YouTube, July 1 2017.
Six scientists analyzed the article and estimate its overall scientific credibility to be 'very low'.
A majority of reviewers tagged the article as: Biased, Flawed reasoning, Imprecise/Unclear, Inaccurate, and Misleading.
Review Summary
This video of a talk by author and speaker Steve Goreham, posted by the YouTube channel “Friends of Science” has been viewed over 250,000 times and has been widely promoted by Youtube recently. In it, Goreham claims that climate change is not dangerous, and is not caused by humans.
Scientists who reviewed the talk found that it was comprised of a litany of common myths about climate science. Goreham misrepresents global temperature data, the physics of the greenhouse effect, and the factors controlling sea level rise, among many other things, as explained below by scientists.
Popular “Friends of Science” video promoted by Youtube presents long list of climate myths, Edited by Scott Johnson, Climate Feedback, Dec 21, 2018
SkS Week in Review...
- 2018 SkS Weekly Climate Change & Global Warming News Roundup #51 by John Hartz
- New research, December 10-16, 2018 by Ari Jokimäki
- Climate Carbon Bookkeeping by Evan & jg
- Dana on Warm Regards Podcast by Dana Nuccitelli
- Little Ice Age? No. Big Warming Age? Yes. by Dana Nuccitelli (Yale Climate Connections)
- Explainer: Why some US Democrats want a ‘Green New Deal’ to tackle climate change by Zeke Hausfather (Carbon Brief)
- 2018 SkS Weekly Climate Change & Global Warming Digest #50 by John Hartz
Poster of the Week...
Hat tip to the Stop Climate Science Denial Facebook page.


If the recent report from the Intergovernmental Panel on Climate Change is to be believed, humanity has just over a decade to get carbon emissions under control before catastrophic climate change impacts become unavoidable.
Why should this report be believed? The IPCC and several climate celebrities have been making these 10-12 year claims for almost 30 years now, and none of it has actually come to pass. How many more failed predictions is it going to take before the climate change community starts to rethink just who the climate experts really are?
[DB] A note to readership:
This user is just one of dozens of fake accounts operated by a serial spammer of this venue. This sock puppet account has been disabled and there is no need for any to reply to it. All future iterations of it will also be disabled/removed.
Thomas Thorne,
I have a strong recollection thinking about the changes from global warming after the IPCC AAR4 was released in 2007. They described many changes that could occur like sea level rise and intensification of storms. At the time I was 49 years old. I remember wondering if I would live long enough to see definitive changes in sea level rise and weather caused by climate change. I thought that if I lived to 85 I might see some effects.
Today I am 60. News reports regularly describe catastrophies caused by climate change. Four record hot years in the past four years, streets regularly flood from sea level rise, record damage from weather, Arctic sea ice has collapsed. Extraordinary rainfall causes floods around the world. Record drought grips Australia. I note that you do not specify a single prediction scientists have incorrectly made. What evidence do you need to become alarmed?
I still have 25 years left before I turn 85. Scientists have been way off in their calculations: they have underestimated the danger. Pray that recent reports of tipping points past that cause the Earth to continue heating regardless of what humans do are incorrect.
We have no choice but to try our hardest to minimize the damage caused by fossil fuels.
Perhaps I missed some Thomas.
CO2 is the control know and the H2O content is controlled by the CO2 concentration, not the other way around.
Take a look at the following plot and tell me that CO2 and temperature rise are not correlated.
Then take a look at measured CO2 concentrations for the last 60 years and see where they're headed. These two plots show the problem. Ice melts when it gets warm, and just because New York is still above water does not mean it will remain above water. It takes a long time to heat a pot of water the size of the oceans.
[DB] Reduced widths of images and linked to full size versions.
Moderator, sorry about the oversized graphs. I copy and pasted the links without realizing they would not be rescaled. My mistake.
There was a second comment from Thomas Thorne that has been disappeared. It did try to provide some evidential basis for the assertions being made @1. It wasn't particularly exact in doing this. There was an alleged "UN in 1989" talking about catastrophe by 2000 and also a reference to Al Gore and catestrophic sea level rise. It seems both these 'predictions' concern SLR. The 1989 UN 'prediction' came from a 'Noel Brown, director of the New York office of the U.N. Environment Program, or UNEP.' Now bear in mind that this is coincidental with Montreal and the threat from CFC-caused AGW was as big as was CO2 back then. Even so, the predicted 1 to 7 degree in 30 years temperature increase (Fahrenheit) has happened. The "by 2000" comment was about SLR - "entire nations could be wiped off the face of the Earth by rising sea levels if the global warming trend is not reversed by the year 2000." They are, of course small low-lying nations and I would ahve thought the warming by 1989 was probably enough to do the job without a further 10-years of AGW.
Myself, I have been bashing on about AGW since 1995. The requirement for CO2 back then was a reduction of 50% by 2050. That has since become 80% and now 100%. The need for action prior to that was always expressed as a need to see CO2 emissions peak by 2020. I don't think that has ever changed. So from my memory the idea that "the IPCC ... have been making these 10-12 year claims for almost 30 years now," is a gross misrepresentation. The IPCC has been tightening the requirement, not the opposite which would have been the case if allowing deadlines to float along, always 10 years in the future.
[DB] The user ThomasThorne is one of dozens of fake account sock puppets operated by a serial spammer of this venue. Its posting privileges have been rescinded, as will those of all future iterations of this spammer. There is no need to respond to it anymore.
MA Roder@5, great points. My view of the current focus on 2030 as the make-or-break date is not that the science really supports that (this is just my view from all that I've read), as much as the point that scientists will never say "We've past the point of no return." CO2 is 410 ppm now, 400 ppm CO2 is the approximate threshold for locking in 1.5C warming if we assume 3C warming/doubling CO2, and yet we're still talking about staying below 1.5 warming. The real problem as I see it is CO2 concentrations accelerating upwards combined with a 30-year delay between cause (CO2 emissions) and effect (warming). The scientists are warning of this, but it is beyond the comprehension of most people to appreciate what this means. In Minnesota people look outside and see weather that feels pretty much the same as it has all their lives. There is no sense of the impending doom that climate scientists are proclaiming. So they tune out.
But I also see no alternative to the path that scientists are charting. Continue warning people, improving out understanding through good science, and trying to help people connect the dots. What else can we do? At some point as Climate Change gets sufficient severe to a sufficient number of people we will begin to win the messaging campaign. Let's hope it's soon enough.
Evan @6,
For myself, I do not reckon we are past the point where keeping AGW below +1.5ºC becomes impossible. But we are cutting it mighty fine.
You 'assume' ECS=3ºC but it could be higher. The one saving grace in there still being a possibility of an ECS significantly above 3ºC is that the additional warming resultant from higher ECS appears later, most of the addition a full century after the forcing is applied. So the ECS=3ºC assumption isn't entirely foolhardy in ignoring the possibility of it being higher.
The 400ppm of CO2 gives a little over half the forcing of double CO2. There are of course other significant positive climate forcings as well as negative ones, but for CO2 the atmospheric concentrations will drop once we stop the emissions. The general view has been that once you stop emissions, the falling CO2 forcing would balance with the warming from the remaining un-balanced forcing leaving a roughly constant global temperature, even a cooling. For instance, IPCC FAR projections (graphic annotated here) to 2100 includes 'zero CO2 emissions' and that results in significant cooling. With other GHGs and a pile of negative forcings to handle, that 'cooling' factor would be required - as we nudge upwards and that +1.5ºC of AGW grows ever closer, we need all the help we can get.
And given Greenland goes into melt-down somewhere between +1ºC and +2ºC, I can imagine the target of staying below +1.5ºC will be replaced by a target of reducing the warming back down to +1ºC or 350ppm CO2.
I would add that I have always given the message that once AGW has become severe enough for building-dwelling people to notice, it will be a little too late to scrap all the gas-guzzling cars and convert the smog-works to run on sunbeams. We do need to act more quickly than that. Happily there are signs of that action beginning.
MA Rodger@7 I agree with and note the technical merit of your points. It is not my intention to get into fine points, because I agree technically with what you're saying.
However, the idea that the world will respond in a manner to cause CO2 to naturally start decreasing I see as wishful thinking (no offense meant). I am not trying to be argumentative, just noting that reversing an upward acceleration, first requires we stop the acceleration and just move to a constant increase, which itself is really bad. Then we must decrease from there.
So whereas I agree with the technical points you're making, and whereas I agree that we need to pull out all the stops and communicate as fervently as we can, to me the upward acceleration of the Keeling Curve at a point where 400 ppm is behind us, and when the temperature anomalies are tracking very well at 3C/doubling CO2 with a 30-year offset, personally I am preparing myself for a 2+C world, while working with you and others to try to not make that a reality.
I just can't figure out the right words to use to get through to people the urgency of this issue.
"I just can't figure out the right words to use to get through to people the urgency of this issue."
I feel the same way, but I wonder if its partly because we all all talk so much about 1.5 degrees and climate impacts this century. People don't care about 1.5 degrees, because it sounds harmless, (it isn't, but one can easily understand why they react this way), but if we go on burning fossil fuels, its possible the world could warm about 12 degress celsius by year 2300 according to the IPCC.
12 degrees has a different "feel" to it psychologically and will get peoples attention, and is obviously genuinely catastrophic. It is also not hyperbole and speculation, there is science behind it.
People might say we have plenty of time to do something about that because it seems distant, but deep down they will instinctively know we have to start now and urgently. Passing 1.5 and 2 degree tipping points also helps lock in such a 12 degree scenario.
We have to get the big picture across better.
nigelj@9 Agree with your assessment.
There is another aspect that I think is being overlooked. I think that the big guns like Richard Alley and Eric Rignot and others expect that we will trigger major sea level rise within the next few decades. Some console themselves that sea level rise will happen over millenia, so it is slow and we can manage it. After all, a snail can outrun sea level rise. But, buildings, houses, and roads move slower than snails.
Also, sea level rise will come in spurts, some being a foot or more in a decade, some decades slower. And this will go on for hundreds of years. How do city planners cope with that? Although it may be difficult to convince people that a warming climate will be bad for agriculture, heat, floods, wild fires, stronger storms, etc., I think it is an easy argument to make that a warmer world will bring with it sea level rise that will be very difficult to cope with. That argument alone, and the very long time frame it implies, may be sufficient to bring some of the doubters on board.
It's also possible that I am temporarily afflicted by a case of optimism, but it feels good to find an optimistic argument to try out.
Evan @10, agreed. I also think people look at impacts of climate change such as general warming, and impacts on crops and think it will be slow and we will adapt and genetic engineering will 'solve it' for example. Firstly they underestimate the costs of even slow adaptation, and the slowness lulls people into a false sense of security, because some elements of climate change wont be slow, and it only takes one rapid element of change to be a huge problem. As you say it's important to focus on the possibility we could see short periods of rapid sea level rise of a foot or more a decade interspersed with more sluggish periods.
Its speed of transitions like this that would be very difficult to adapt to. Buildings are designed to last about 100 years, so its possible to design for a world with a known quantity of sea level rise over multi centuries, by hopping inland in an orderly way. Costly, but manageable. But theres a possibility of erratic spurts of sea level rise of several metres per century or less and it's impossible to plan for this, and infrastructure will have to be abandoned before its use by date, over and over again.
I think the IPCC do a good job of discussing the risks, possibly they are on the conservative side a bit but overall its good. What I think might have gone wrong is how the mainstream media interpret and communicate the issues. The focus seems to swing from the usual risks of more storms, reduced agricultual issues, multi century sea level rise, and general warming on the one hand, and more scaremongering claims that are stated in such general ways as to be useless and easily refuted. They miss the key problems and more specific quantifiable problems of a world of 5 - 10 degrees having inolerable heatwaves, the possibility of short periods of rapid sea level rise,and so on. Some media have covered this, but not enough.
Evan @8,
You say:-
I do note you continue by describing "reversing an upward acceleration, ... move to a constant increase, ... Then we must decrease from there," so in some manner we do speak at cross-purposes.
Just to be clear, my talk of this natural process reducing CO2 levels: this year draws to a close and we will have emitted some 11.4Gt(C) of CO2 into the atmosphere over the year. Yet the atmospheric CO2 levels do not increase by 11.4/2.13=5.4ppm over the year. The levels of annual rise in CO2 are wobbly but there is on average 55% of our emissions disappeared, into the oceans & biosphere. This 11.4*0.55=6.27Gt(C) of drawdown is a response not only to this year's emissions but to previous years. The drawdown continues when "you stop emissions" eventually resulting in 80% of our emissions being disappeared over a millenia. (See Archer et al (2009) 'Atmospheric Lifetime of Fossil Fuel Carbon Dioxide') This is the process I describe @5, "once you stop emissions, the falling CO2 forcing would balance with the warming from the remaining un-balanced forcing leaving a roughly constant global temperature, even a cooling."
I could continue by pointing out that the global CO2 emissions calculated for recent years show little or zero increase, perhaps a sign that "upward acceleration" has ended, but some find this difficult to accept so I won't press the point.
MA Rodger@12 When I say upward acceleration, I am not referring to emissions. I am referring to CO2 accumulating in the atmosphere. I'm sure you agree that it really does not matter if we stabilize emissions if atmospheric CO2 concentrations continue to accelerate upwards, and they are. Atmospheric CO2 concentrations are what we should be focusing on to evaluate how well we're doing, because that gives us the net effect of everything, including changing re-absorption rates by the biosphere and positive feedbacks. Isn't it concerning if emission rates have stabilized but atmospheric CO2 concentrations continue to accelerate upwards? Or am I missing something? I realize the only thing we can write policies for are emissions, but unfortunately the climate only cares about atmospheric CO2 concentrations. I am not trying to be argumentative, just trying to understand the relationship between emissions and accumulating CO2, and where we should be placing our focus. Thanks for your detailed responses.
Evan @13,
It is good that we have clarified your meaning. And to be entirely accurate, with this talk of "acceleration," you are evidently not talking "emissions" but man-made "emissions."
Sadly it does beg the question as to what is causing this "acceleration" in atmospheric CO2 given you say "atmospheric CO2 concentrations continue to accelerate upwards." Or indeed whether there is any evidence of "atmospheric CO2 concentrations continu(ing) to accelerate upwards." Myself, I do not see it. And it is not as though I have not looked. (I am happy to share what this 'looking' has shown me.)
MA Rodger@14, please see figure 2 in Evan@3. This is the Keeling Curve (gray dots) with a quadratic function fitted. The quadratic function fits with R2 = 0.99 for the period 1960 to present. If you use just the last 20 years the curve is steeper! The fact that the second derivative of the Keeling curve is positive means that CO2 concentrations are accelerating upwards.
For whatever it's worth, Ralph Keeling (son of Charles David Keeling) says the same thing (that CO2 concentrations are accelerating upwards) in the Nova program "Decoding the Weather Machine."
I would love for somebody to shoot a hole in my argument, but the CO2 measurements represent one of the most solid data sets we have, and include the balance of all sources and sinks, but natural and human.
I'm trying to figue out what you guys mean. I look at a graph of the Mauna loa data here, and I see by eye a gentle curve over the period 1960 - 2018 so a mild acceleration over the full period. Is that what you mean Evan?
But eye balling the last ten years I dont see an obvious acceleration in this acceleration.
I think the decrease in emissions over the last few years is real, but the exact numbers would be approximate. But would a couple of years slowdown in actual emissions even show up in the mauna loa trend? I think you would need something more substantial wouldn't you?
So there is actually a recent acceleration in the acceleration. so much for my eyeballing.
nigelj @16&17, great question. Here is a look at the Keeling curve that uses the following data fits.
1958-2017
1988-2017
1998-2017
2008-2017
What is interesting is that fitting the data for 1988-2017 and 1998-2017 give almost the same trends. But, during the 90's three things happened. The USSR was collapsing and reducing their energy usage, Britain was converting from coal to gas, and France was finishing their conversion to nuclear. After the 90's things started to increase.
There are two scary things in the following plot. Using all of the data from 1958-2017 shows that CO2 concentration is accelerating upwards, But looking at how the curves get steeper and steeper as you use only the most recent data suggests that the acceleration is accelerating.
However, I am not ready to publish that in a blog article, because whereas 60 years of data gives a long-term solid trend, something like 10-20 years of data may not stand statistical rigor. But still, the point is that CO2 concentrations are accelerating upwards.
If you divide the increases by the population in each year, you can attribute have of the increase to increasing population and half the increase to the rise of affluence.
Evan @15,
Indeed you are correct in putting the MLO measurements of atmospheric CO2 levels as the prime data and to say that it shows there has undoubtedly been an acceleration in the CO2 rise since 1960. Back then, the rise was averaging some 0,7ppm/yr and it is now averaging some 2.4ppm/yr, suggesting an acceleration of roughly 2% per year over the period. And over that same period, the CO2 emissions from all anthropogenic sources have also risen at a rate of roughly 2% per year. This does suggest that the Keeling Curve is driven by anthropogenic emissions, and nothing else.
So if in recent years (since 2014), if anthropogenic sources have shown no rise, would this suggest that the acceleration may have been halted (at least for the years 2014-17 as we still await the 2018 figure for total emissions)?
Now, the MLO data does show a lot of wobble, much of it based on the ENSO cycle. If the ENSO cycle is accounted using MEI (shifted by 8 months which gives he best fit to the CO2 wobble) and correlated against the CO2 Airborne Fraction (as per the Global Carbon Project numbers), the MLO data does appear to show an end to the acceleration (abet still noisy), or at least no reason to suggest that there is any significant non-anthropogenic source of CO2 emissions impacting the atmospheric levels.
With no increase in anthropogenic emissions, I would suggest that any notion of continued acceleration through recent years requires a non-anthropogenic source. (This of course does not mean a return to accelerating anthrpogenic emissions can be guaranteed.) I have not ever found evidence to support the existence of any significant non-anthropogenic emissions as the source of acceleration. (This of course does not mean there has not been such accelerating emissions, either now or future.)
So is there some reason to consider such analysis invalid?
MA Rodger@19 Please see the curve and analysis in Evan@18.
I like to think of a thick branch that has a bend in it. How easy is it to bend the branch opposite its natural bend? The reverse bend occurs slowly. If there are temporary reductions due to a cool summer that reduces the air conditioning load in a country and leads to a reduction of CO2 emissions from coal plants, such temporary cool summers are bound to not be often repeated.
I have not done the detailed analysis that you are doing, but rather have chosen to base my analysis on the 60-year data trend indicated by the Keeling curve, combined with the fact that with global population is continuing to rise, and no international agreements are yet enacted for serious reductions in emissions. I see any temporary blip in the data as inconsequential to the overall trend. In other words, in the same way that we correct climate deniers for focusing on "pauses" and not looking at the long-term data, I also tend to focus on the long-term Keeling curve and not get excited by short-terrm blips.
But I appreciate all the points you make and you've given me a lot more food for thought. Thanks.
Evan @20,
Perhaps then some further food on the subject.
I don't think "cool summers" (or warm winters) will have much impact on the Keeling Curve. They are quite local phenomena and the proportion of our emissions resulting from space heating (& cooling) is small - some 16% in UK.
Population as a factor in AGW is a poor measure. A better factor is the size of the world economy but this has a varrying 'carbon intensity', the graphic below from here. The steepness of the downward trajectory is a useful measure of how well we are doing, although with a growing world economy 'carbon intensity' must drop quicker than economic growth rises. So the big big question is whether we have truly decoupled carbon emissions from economic growth, and in how many sectors and how many countries, and are doing it in time to prevent too much damage from AGW.
MA Rodger@21 I understand these curves, and my point remains the same. Even if carbon intensity falls, if total CO2 continues to rise as the Keeling curve shows that it is, none of these other metrics will ever matter. The only value of these other metrics is that they give hope that we might solve the problem. In the meantime, atmospheric CO2 concentrations continue to accelerate upwards. If we focus on the graph that you show, we give people hope that we are getting on top of this problem and that we can relax. In other words, I see talk after talk that show graphs bending downwards, giving hope that we are winning, when all the while the Keeping curve is accelerating upwards. In the end analysis, it is the atmospheric CO2 concentration that will matter.
Can you explain why CO2 concentrations are increasing at such a rapid rate when carbon intensity is decreasing? If we were to continue to burn fossil fuels at the same rate we are now, but simply get the growing energy we need from renewables, we could continue to grow GDP without increasing carbon emissions. But even though carbon intensity would drop (i.e., GDP going up due to use of renewables and carbon emissions held constant), if renewables don't displace fossil fuels but merely add on top of them, then although carbon intensity will drop, CO2 will continue to rise. Or am I missing something?
MAR @19,
Can you clarify something briefly. I gather you have looked at the last 20 years of atmospheric emissions trends (which are accelerating) and found a slowing in the acceleration of these over about the last 5 years by pulling out el nino and la nina years? Looks convincing approach to me, my maths is too rusty for the details. But they are rather short time frames arent they?. Give it a couple more years of data you should publicise your views more widely. You may be onto something novel because I havent seen anyone else articulate this.
You also said that you found no compelling evidence for an increase recently in non anthropogenic emissions. But haven't we seen some evidence of more release of methane from the tundra and tropics?
Nigelj @23,
You say the last 20 years of atmospheric emissions trends "are accelerating" but also that I have attempted to account for the ENSO cycle. I have elsewhere been quite strong in pointing out that "emissions" data show no increase for the period 2014-17 which would suggest no acceleration woud result within the rise of atmospheric CO2 levels (eg MLO data) for those years. This would contrast with the record since 1960 when an acceleration is evident.
I have also attempted to adjust MLO CO2 data for MEI. Just as ENSO wobbles global temperature, it also wobbles the CO2 increase, the latter with an 8-month lag (with some complications that I ignore). Using MEI as a measure of ENSO, I found that the Airborne Fraction (the amount of extra CO2 in the atmosphere as a proportion of the amount of anthropogenic CO2 emitted) is boosted/reduced by 11% for a unit increase/decrease in MEI. The adjusted airborne fraction can then be used to adjust the CO2 increase, this reducing the noise within the MLO data by 50%. (Also a base MEI value of +0.1 is assumed.)
I have pondered how to best present this data, whether a simple table or with added analysis of some form. Perhaps the best presentation would be graphically with an OLS for each of the measured/adjusted data. A graph has been duly uploaded here (usually two clicks to 'download your attachment'). You may draw your own conclusions as to whether the adjusted data shows acceleration (an increase in ppm/yr) over recent years, or indeed what should constitute "recent years" in any statistically-significant analysis.
MAR @24 thank's for the information. Yes emissions stopped 2014 - 2017. I meant to say atmospheric "CO2 levels" have shown an acceleration in recent decades, - at first glance.
But it looks like you might be onto something and have found some decrease in the rate of acceleration. I love graphs because a picture paints 1000 words. Sorry my university math is too rusty and forgotten to add anything on the technical details, but I'm just really interested and trying to figure out where you and Mike are coming from, I think maybe his grasp of it is a bit off somewhere but he means well.
I have a question about linking to IPCC reports but don't know where to put it to be on topic. Could someone advise?
[PS] Just make your comment here and someone will advise.
OK, does anyone know of a way to directly link to a particular page in an IPCC report? It'd be useful when presenting an argument if you could provide a direct link to evidence. Right now, I've been linking to the IPCC report page, then describing which chapter to download and which page to go to. That's less than ideal. Previous reports were online but you couldn't link to a page, and now it appears that the reports are download only. I've tried everything I could think of with no luck.
Sorry Wayne, we share your pain. I haven't found a solution.
Thanks. That'll save me more futile effort. It just seems odd, first, that the IPCC wouldn't provide it as a way to better get the word out, and second, that failing in that, someone else hasn't been able to create a website for this specific purpose. Maybe there are copyright issues in doing the latter.
WayneK@27,
This page gives good advice on linking to a specific PDF page. Thus this link should take you to the final page of IPCC AR5 WG1 Chapter 1 'Introduction'.
MA Rodger@30,
1) I've seen that page before when I was trying to figure out how to link to pages inside my own PDF's. Couldn't get it to work. In any case, you have to have an online PDF to link to, which we don't have (as far as I know).
2) Your link doesn't take you to a page online. It's a download link for the whole Introduction.
I'm still working on this and will post again if I find something helpful. I've found one report displayed online in .php, which is a start, but still there's no way to link to a particular page.
I think I succeeded in creating a direct link to pages in a report (bear with me since this is my first try to link properly): <a href="https://issuu.com/unipcc/docs/syr_ar5_final_full_wcover/24"> 2014 Synthesis, pp 7-8</a>
Click on "full screen" in the lower right, then use the zoom bar in the same area to enlarge the view as needed. To link to another page, click on "share" in the upper right and copy the link that comes up.
2nd try at doing the link correctly: <a href="https://issuu.com/unipcc/docs/syr_ar5_final_full_wcover/24"> 2014 Synthesis, pp 7-8</a>