


 Arguments


2018 SkS Weekly Climate Change & Global Warming News Roundup #18
Posted on 5 May 2018 by John Hartz
Editor's Pick
Earth’s atmosphere just crossed another troubling climate change threshold
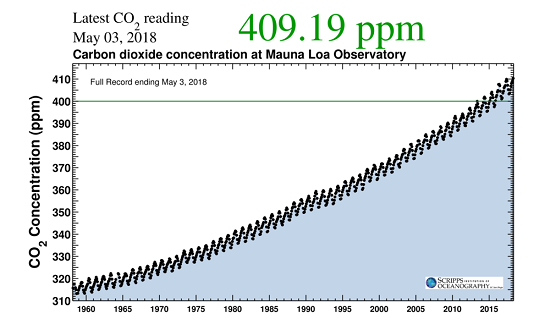
Recent CO2 measurements at Mauna Loa Observatory in Hawaii. (Scripps Institution of Oceanography)
For the first time since humans have been monitoring, atmospheric concentrations of carbon dioxide have exceeded 410 parts per million averaged across an entire month, a threshold that pushes the planet ever closer to warming beyond levels that scientists and the international community have deemed “safe.”
The reading from the Mauna Loa Observatory in Hawaii finds that concentrations of the climate-warming gas averaged above 410 parts per million throughout April. The first time readings crossed 410 at all occurred on April 18, 2017, or just about a year ago.
Carbon dioxide concentrations — whose “greenhouse gas effect” traps heat and drives climate change — were around 280 parts per million circa 1880, at the dawn of the industrial revolution. They’re now 46 percent higher.
As you can see in the famed “saw-toothed curve” graph above, more formally known as the Keeling Curve, concentrations have ticked upward in an unbroken progression for many decades. But they also go up and down on an annual cycle that’s controlled by the patterns and seasonality of plant growth around the planet.
Earth’s atmosphere just crossed another troubling climate change threshold by Chris Mooney, Energy & Environment, Washington Post, May 3, 2018
Links posted on Facebook
Sun Apr 29, 2018
- The Australian’s coverage of Great Barrier Reef study creates perception that scientists are divided by Scott Johnson, Climate Feedback, Apr 22, 2018
- Low-lying atolls could become ‘uninhabitable’ earlier than thought by Robert McSweeney, Carbon Brief, Apr 25, 2018
- The Carbon Brief Interview: Prof Stephen Belcher by Leo Hickman, Carbon Brief, Apr 26, 2018
- A Hawaiian island got about 50 inches of rain in 24 hours. Scientists warn it's a sign of the future by Heidi Chang, Los Angeles Times, Apr 28, 2018
- February and March madness: How winds miles above the Arctic may have brought wintry weather to mid-latitudes by Amy H Butler, NOAA's Climate.gov, Apr 27, 2018
- Desperate farmers left high and dry as federal relief funding runs out before drought does by Dominique Schwartz, ABC News (Australia), Apr 28, 2018
- Climate change: Australia's position is unconscionable for a wealthy country, Opinion by David Shearman, ABC News (Australia), Apr 28, 2018
- Cars Are Ruining Our Cities, Opinion by Justin Gillis & Hal Harvey, New York Times, Apr 25, 2018
Mon Apr 30, 2018
- China Installs Nearly 10 Gigawatts Of Solar In First Quarter, Up 22% by Joshua S Hill, Clean Technica, Apr 24, 2018
- Battling climate change with little resources: The fight of Mozambique's coastal cities by Katharina Wecker, Deutsche Welle, Apr 24, 2018
- Governments Meet in Bonn To Step Up Climate Action Critical to the implementation of Paris Agreement, UN Climate Press Release, Apr 28, 2018
- Trump administration drafts plan to unravel Obama-era fuel-efficiency rules, challenge California by Chris Mooney, Dino Grandoni & Juliet Eilperin, Energy & Environment, Washington Post, Apr 27, 2018
- Boaty McBoatface leads £20m mission to melting Antarctic glacier by Fiona Harvey, Environment, Guardian, Apr 30, 2018
- Republicans have so corrupted EPA, Americans can only save it in the voting booth by Dana Nuccitelli, Climate Conseunsus - the 97%, Envioronment, Guardian, Apr 30, 2018
- It’s time to think seriously about cutting off the supply of fossil fuels by David Roberts, Energy & Environment, Vox, Apr 29, 2018
- Growing Pressure for Lobbying Transparency in Climate Talks by Mike Small, DeSmog UK, Apr 30, 2018
Tue May 1, 2018
- Through Talanoa Dialogue, New Paths for Enhanced Action on Climate Change Are Emerging by Eliza Northrop & Nathan Cogswell, World Resouces Institute (WRI), Apr 27, 2018
- Climate-Linked Spending Set to Rise to a Quarter of EU Budget by Ewa Krukowska, Bloomberg News, Apr 30, 2018
- Texas Court OKs Exxon Attempt to Challenge California Climate Plaintiffs by Karen Savage, Climate Liability News, Apr 30, 2018
- Record heat for Australia in driest April for 21 years by Peter Hannam, Environment, Sydney Morning Herald, May 1, 2018
- State of the climate: Warm start to 2018 despite La Niña conditions by Zeke Hausfather, Carbon Brief, May 1, 2018
- Bonn morning brief: ‘We simply don’t have any time to waste’ by Karl Mathiesen, Megan Darby & Soila Apparicio, Climate Home, May 1, 2018
- Rising levels of 'frustration' at UN climate stalemate by Matt McGrath, Science, BBC News, May 1, 2018
- Industry Sway Over EPA Is Stronger Now Than Under Reagan, Study Says by Neela Banerjee, InsideClimate News, May 1, 2018
Wed May 2, 2018
- Former Exxon executive calls on oil industry to clean up its climate act by Bill Hafner, CNBC, Apr 30, 2018
- Mapped: African heatwaves could increase ‘five-fold’ with 3C of global warming by Daisy Dunne, Carbon Brief, Apr 27, 2018
- 11 key themes as countries take stock of Paris Agreement progress by Megan Darby, Climate Home, May 1, 2018
- Umbrella in a hurricane': U.N. says climate funding far too low by Alister Doyle & Laurie Goering, Reuters, May 2, 2018
- Shock and Thaw—Alaskan Sea Ice Just Took a Steep, Unprecedented Dive by Andrea Thompson, Scientific American, May 2, 2018
- Recent Australian droughts may be the worst in 800 years by Mandy Freund, Ben Henley, Kathryn Allen & Patrick Baker, The Conversation AU, May 2, 2018
- Mosquito season could get longer and more hazardous to your health — especially in Miami by Alex Harris, Health Care, Miami Herald, May 1, 2018
Thu May 3, 2018
- Mormon environmentalist conveys ecological message through fiction, Opinion by Jana Ries, Religious News Service (RNS), Apr 30, 2018
- Paris agreement: “Don’t water it down”, Lutheran World Federation, May 1, 2018
- Pakistan May Have Just Set a World Heat Record by Brian Kahn, Science, Earther, May 1, 2018
- The people who’ll be most hurt by climate swings did the least to cause them, study says by Chris Mooney, Energy & Environment, Washington Post, May 2, 2018
- Climate change aid to poor nations lags behind Paris pledges by Fiona Harvey, Environment, Guardian, May 2, 2018
- Carbon Dioxide Has Never Been Higher in Humanity's Existence by Brian Kahn, Science, Earther, May 2, 2018
- In Shadow of Trump's New Foreign Policy Team, U.S. Climate Negotiators Walk a Fine Line by Marianne Lavelle, InsideClimate News, May 3, 2018
- Caribbean Island Nations Cite U.S. Report at Climate Change Talks by Jean Chemnick, E&E News/Scientific American, May 3, 2018
Fri May 4, 2018
- Powerful Investors Push Big Companies to Plan for Climate Change by David S Rauf, Policy & Ethics, Scientific American, May 3, 2018
- Plants Find a New Way to Fight Climate Change?—?Nap by Marlene Cimons, Nexus News Media, May 2, 2018
- World Is Not on Track to Meet UN’s 2030 Sustainable Energy Goal by Georgina Gustin, InsideClimate News, May 3, 2018
- SkS Analogy 11 - Cabinets, airplanes, and frame of reference by Evan & jg, Skeptical Science, May 4, 2018
- Greenhouse gas concentrations hit highest level in human history by Andrew Freedman, Science, Mashable, May 3, 2018
- Kids Challenge Alaska’s Climate Paradox: Relying on Oil Production as Global Warming Wreaks Havoc by Sabrina Shankman, InsideClimate News, May 4, 2018
- The 1970s Global Cooling Zombie Myth and the Tricks Some People Use to Keep it Alive, Part I by David Kirtley, Skeptical Science, May 3, 2018
- ‘Sunny day flooding’ worsens at NC beaches — a sign sea rise is decades too soon, studies say by Abbie Bennett, The News & Observer (Raleigh, North Carolina), May 3, 2018
Sat May 5, 2018
- New research, April 23-29, 2018 by Ari Jokimäki, Skeptical Science, May 4, 2018
- Future sailors: what will ships look like in 30 years? by Fred Pearce, Environment, Guardian, May 3, 2018
- ‘Foehn winds’ causing Antarctica’s Larsen C ice shelf to melt in winter by Daisy Dunne, Carbon Brief, May 2, 2018
- ‘Manels’: Male speakers outnumber women two to one at UN climate talks by Soila Apparicio & Megan Darby, Climate Home, May 3, 2018
- Earth’s atmosphere just crossed another troubling climate change threshold by Chris Mooney, Energy & Environment, Washington Post, May 3, 2018
- Beneath a Melting Glacier, a Peruvian Town Prepares For the Worst by Daniel Setiawan, Justice, Eather, May 3, 2018
- Scott Pruitt wants to freeze fuel economy standards. Here’s what that would do. by David Roberts, Energy & Environment, Vox, May 5, 2018
- Oil Companies Ask Judge to Kill NYC's Global Warming Lawsuit by Bob Van Voris, Bloomberg News, May 4, 2018


Comments