


 Arguments


2018 SkS Weekly Climate Change & Global Warming News Roundup #48
Posted on 1 December 2018 by John Hartz
Editor's Pick
Climate change signals and impacts continue in 2018
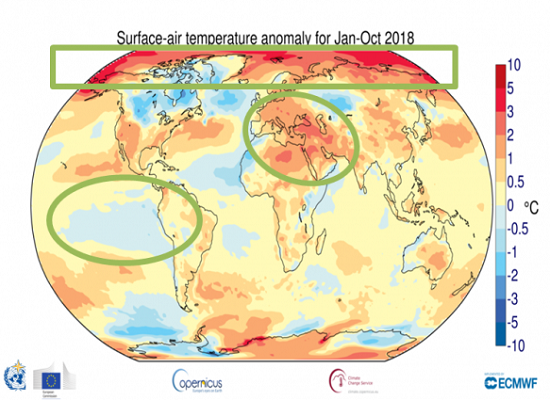
The long-term warming trend has continued in 2018, with the average global temperature set to be the fourth highest on record. The 20 warmest years on record have been in the past 22 years, with the top four in the past four years, according to the World Meteorological Organization (WMO).
Other tell-tale signs of climate change, including sea level rise, ocean heat and acidification and sea-ice and glacier melt continue, whilst extreme weather left a trail of devastation on all continents, according to the WMO provisional Statement on the State of the Climate in 2018. It includes details of impacts of climate change based on contributions from a wide range of United Nations partners.
The report shows that the global average temperature for the first ten months of the year was nearly 1°C above the pre-industrial baseline (1850-1900). This is based on five independently maintained global temperature data sets.
“We are not on track to meet climate change targets and rein in temperature increases,” said WMO Secretary-General Petteri Taalas. “Greenhouse gas concentrations are once again at record levels and if the current trend continues we may see temperature increases 3-5°C by the end of the century. If we exploit all known fossil fuel resources, the temperature rise will be considerably higher,” he said.
“It is worth repeating once again that we are the first generation to fully understand climate change and the last generation to be able to do something about it,” said Mr Taalas.
The Intergovernmental Panel on Climate Change (IPCC) special report on Global Warming of 1.5°C reported that the average global temperature for the decade 2006-2015 was 0.86°C above the pre-industrial baseline. The average increase above the same baseline for the most recent decade 2009-2018 was about 0.93°C and for the past five years, 2014-2018, was 1.04°C above the pre-industrial baseline.
“These are more than just numbers,” said WMO Deputy Secretary-General Elena Manaenkova.
“Every fraction of a degree of warming makes a difference to human health and access to food and fresh water, to the extinction of animals and plants, to the survival of coral reefs and marine life. It makes a difference to economic productivity, food security, and to the resilience of our infrastructure and cities. It makes a difference to the speed of glacier melt and water supplies, and the future of low-lying islands and coastal communities. Every extra bit matters,” said Ms Manaenkova.
The WMO report adds to the authoritative scientific evidence that will inform UN climate change negotiations from 2-14 December in Katowice, Poland. The key objective of the meeting is to adopt the implementation guidelines of the Paris Agreement on Climate Change, which aims to hold the global average temperature increase to as close as possible to 1.5°C.
The IPCC report on Global Warming of 1.5°C said that this target was physically possible but would require unprecedented changes in our lifestyle, energy and transport systems. It showed how keeping temperature increases below 2°C would reduce the risks to human well-being, ecosystems and sustainable development.
National meteorological and hydrological services have been contributing to national climate assessments. A new U.S. federal report detailed how climate change is affecting the environment, agriculture, energy, land and water resources, transportation, and human health and welfare, with a risk that it will lead to growing losses to American infrastructure and property and impede the rate of economic growth over this century.
A UK assessment published 26 November warned summer temperatures could be up to 5.4°C hotter and summer rainfall could decrease by up to 47% by 2070, and sea levels in London could rise by 1.15m by 2100. A Swiss report on climate scenarios released on 13 November said that Switzerland is becoming hotter and drier, but will also struggle with heavier rainfall in the future and its famed ski resorts will have less snow.
“The WMO community is enhancing the translation of science into services. This will support countries in generating national climate scenarios and predictions and developing tailored climate services to reduce risks associated with climate change and increasingly extreme weather. WMO is also working to develop integrated tools to monitor and manage greenhouse gas emissions and carbon sinks,” said WMO Chief Scientist and Research Director Pavel Kabat.
Highlights of the provisional statement on the state of the climate
Temperatures: 2018 started with a weak La Niña event, which continued until March. By October, however, sea-surface temperatures in the eastern Tropical Pacific were showing signs of a return to El Niño conditions, although the atmosphere as yet shows little response. If El Niño develops, 2019 is likely to be warmer than 2018.
Greenhouse gases: In 2017, carbon dioxide, methane and nitrous oxide concentrations reached new highs, according to WMO Greenhouse Gas Bulletin. Data from a number of locations, including Mauna Loa (Hawaii) and Cape Grim (Tasmania) indicate that they continued to increase in 2018.
Oceans: The oceans absorb more than 90% of the energy trapped by greenhouse gases and 25% of anthropogenic CO2 emissions, making them warmer and more acidic. For each 3-month period until September 2018, ocean heat content was the highest or second highest on record. Global Mean Sea Level from January to July 2018 was around 2 to 3 mm higher than the same period in 2017.
Sea ice: Arctic sea-ice extent was well below average throughout 2018 with record-low levels in the first two months of the year. The annual maximum occurred in mid-March and was the third lowest on record. The minimum extent in September was the 6th smallest on record, meaning that all 12 smallest September extents have been in the past 12 years. Antarctic sea-ice extent was also well below average throughout 2018. The annual minimum extent occurred in late February and was ranked as one of the two lowest extents.
Extreme Weather
Tropical Storms: The number of tropical cyclones was above average in all four Northern Hemisphere basins, with 70 reported by 20 November, compared to the long-term average of 53, leading to many casualties. The Northeast Pacific basin was especially active, with an Accumulated Cyclone Energy that was the highest since reliable satellite records began.
Two of the strongest tropical cyclones were Mangkhut, which impacted the Philippines, Hong Kong SAR and China, and Yutu, which brought devastation in the Mariana Islands. Jebi was the strongest typhoon to hit Japan since 1993, Son-Tinh caused flooding in Viet Nam and Laos, whilst Soulik contributed to flooding on the Korean peninsula. Hurricanes Florence and Michael were associated with huge economic damage and considerable loss of life in the United States. Gita, in the South Pacific, was the most intense and most expensive cyclone to ever hit Tonga.
Floods and rainfall: In August, the southwest Indian state of Kerala suffered the worst flooding since the 1920s, displacing more than 1.4 million people from their homes and affecting more than 5.4 million. Large parts of western Japan experienced destructive flooding in late June and early July, killing at least 230 people and destroying thousands of homes. Flooding affected many parts of east Africa in March and April. This included Kenya and Somalia, which had previously been suffering from severe drought, as well as Ethiopia and northern and central Tanzania. An intense low-pressure system in the Mediterranean Sea in late October brought flooding, high winds and loss of life.
Heatwaves and drought: Large parts of Europe experienced exceptional heat and drought through the late spring and summer of 2018, leading to wildfires in Scandinavia. In July and August, there were numerous record high temperatures north of the Arctic Circle, and record long runs of warm temperatures., including 25 consecutive days above 25 °C in Helsinki (Finland). Parts of Germany had a long spell of days above 30°C, whilst a heatwave in France was associated with a number of deaths. It was also an exceptionally warm and dry period in the United Kingdom and Ireland. A short but intense heatwave affected Spain and Portugal in early August.
Dry conditions were especially persistent in Germany, the Czech Republic, western Poland, the Netherlands, Belgium and parts of France. The Rhine approached record low flows by mid-October, seriously disrupting river transport.
Eastern Australia experienced significant drought during 2018, especially New South Wales and southern Queensland, with much of the region receiving less than half its average rainfall for the period from January to September. Severe drought affected Uruguay, and northern and central Argentina, in late 2017 and early 2018, leading to heavy agricultural losses.
Both Japan and the Republic of Korea saw new national heat records (41.1 °C and 41.0°C respectively.)
Oman reported one of the highest known minimum overnight temperature of 42.6 °C in June. Algeria saw a new national of 51.3 °C in July.
Cold and snow: One of the most significant cold outbreaks of recent years affected Europe in late February and early March.
Wildfires: Major wildfires affected Athens (Greece) on 23 July, with many fatalities. British Columbia in Canada broke its record for the most area burned in a fire season for the second successive year. California suffered devastating wildfires, with November’s Camp Fire being the deadliest fire in over a century for the U.S.A.
Other Impacts
The provisional statement contained details of impacts of climate change, based on contributions from the Food and Agriculture Organization (FAO), International Organization for Migration (IOM), UN Environment Programme (UNEP), UNESCO’s Intergovernmental Oceanographic Commission (IOC), UN High Commission for Refugees UNHCR) and World Food Programme (WFP). This section will be expanded in the final statement, to be released in March 2019.
Exposure of agriculture sectors to climate extremes is threatening to reverse gains made in ending malnutrition. New evidence shows a rise in world hunger after a prolonged decline. In 2017, the number of undernourished people was estimated to have increased to 821 million, according The State of Food Security and Nutrition in the World 2018, by to FAO, WFP, the International Fund for Agricultural Development, the UN Children’s Fund and the World Health Organization. Africa is the region where climate events had the biggest impact on acute food insecurity and malnutrition in 2017, affecting 59 million people in 24 countries and requiring urgent humanitarian action. Much of the vulnerability to climate variability is associated with the dryland farming and pastoral rangeland systems supporting 70–80% of the continent’s rural population.
Out of the 17.7 million Internally Displaced Persons tracked by the IOM, 2.3 million people were displaced due to disasters linked to weather and climate events as of September 2018. In Somalia, some 642 000 new internal displacements were recorded between January and July 2018 by UNHCR, with flooding the primary reason for displacement (43%), followed by drought (29%), and conflict (26%).
UN agencies including UNESCO-IOC and UNEP are tracking environmental impacts associated with climate change include coral bleaching, reduced levels of oxygen in the oceans, loss of “Blue Carbon” associated with coastal ecosystems such as mangroves and salt marshes. Climate change also exposes peatlands currently protected by permafrost to thawing and possible increased methane emissions and loss of carbon, and the associated sea-level rise increases the risks of coastal erosion and salination of freshwater peatlands.
Climate change signals and impacts continue in 2018, Press Release, World Meteorological Organization (WM0), Nov 29, 2018
Notes for Editors
Information used in this report is sourced from a large number of National Meteorological and Hydrological Services (NMHSs) and associated institutions, as well as Regional Climate Centres, the World Climate Research Programme (WCRP), the Global Atmosphere Watch (GAW) and Global Cryosphere Watch. Information has also been supplied by a number of other United Nations agencies, including the Food and Agriculture Organization (FAO), the World Food Programme (WFP), the United Nations High Commissioner for Refugees (UNHCR), the International Organization for Migration (IOM), the Intergovernmental Oceanographic Commission of UNESCO (IOC-UNESCO) and UN Environment
WMO uses datasets (based on monthly climatological data from observing sites) from the United States National Oceanic and Atmospheric Administration, NASA’s Goddard Institute for Space Studies, and the United Kingdom’s Met Office Hadley Centre and the University of East Anglia’s Climatic Research Unit in the United Kingdom.
It also uses reanalysis datasets from the European Centre for Medium Range Weather Forecasts and its Copernicus Climate Change Service, and the Japan Meteorological Agency. This method combines millions of meteorological and marine observations, including from satellites, with models to produce a complete reanalysis of the atmosphere. The combination of observations with models makes it possible to estimate temperatures at any time and in any place across the globe, even in data-sparse areas such as the polar regions.
Story map featuring the Climate statement
Weather and Climate events 2018 interactive map
See also: Key Climate Indicators table
Links posted on Facebook
Sun Nov 25, 2018
- New research November 12-18, 2018 by Ari Jokimäki, Skeptical Science, Nov 23, 2018
- Poland calls for planting more forests worldwide to improve carbon capture by Agnieszka Barteczko, Reuters, Nov 22, 2018
- Why aren't they doing anything?: Students strike to give climate lesson by Peter Hannam, Environment, Sydney Morning Herald, Nov 25, 2018
- 3 Reasons Your Uncle Might Think Cold Days Disprove Global Warming by Marshall Shepard, Forbes, Nov 23, 2018
- The warming may be global, but adaptation will need to be local, Opinion by Lauren E Oakes, Los Angeles Times, Nov 25, 2018
- How to talk climate change with skeptical relatives during the holidays by Cody Nelson & Paul Huttner, MPR News, Nov 21, 2018
- Climate cash for developing world set to meet U.N. 2020 goal by Megan Rowling, Thompson Reuter Foundation, Nov 23, 2018
- The Beginning of the End of America’s Best Idea, Opinion by Timothy Egan, New York Times, Nov 23, 2018
Mon Nov 26, 2018
- Rising CO2 levels in the ocean could benefit toxic algae, study says by Daisy Dunne, Carbon Brief, Nov 19, 2018
- False claims of a coming ice age spread through ecosystem of unreliable news sites, blogs, and social media accounts by Emmanuel M Vincent, Insights, Climate Feedback, Nov 21, 2018
- The World Needs to Quit Coal. Why Is It So Hard? by Somini Sengupta, Climate, New York Times, Nov 24, 2018
- Trump Administration’s Strategy on Climate: Try to Bury Its Own Scientific Report, News Analysis by Coral Davenport, Climate, New York Times, Nov 25, 2018
- In Mount Everest Region, World's Highest Glaciers Are Melting, Receding. Photo Essay by Kunda Dixit, Nepali Times/InsideClimate News, Nov 26, 2018
- Climate Change Already Reshaping U.S., Says National Climate Assessment by Chelsea Harvey, E&E News/Scientific American, Nov 26, 2018
- Five Big Ways the United States Will Need to Adapt to Climate Change by Brad Plumer, Climate, New York Times, Nov 26, 2018
- Draft G20 statement waters down Paris climate commitment by Karl Mathiesen, Climate Home, Nov 26, 2018
Tue Nov 27, 2018
- Sydney to collect a month's rainfall in half a day as big low builds by Peter Hannam, Environment, Sydney Morning Herald, Nov 27, 2018
- Queensland bushfires: Evacuations amid 'highly unusual' conditions, BBC News, Nov 26, 2018
- Here’s what the climate change report says will happen to the economy if temperatures get hotter. Trump doesn’t ‘believe it’ by Steve Goldstein, MarketWatch, N0v 26, 2018
- How Trump Is Ensuring That Greenhouse Gas Emissions Will Rise by Coral Davenport & Lisa Friedman, Climate, New York Times, Nov 27, 2018
- World must triple efforts or face catastrophic climate change, says UN by Fiona Harvey, Environment, Guardian, Nov 27, 2018
- 10 ways to accelerate progress against climate change by Eliza Barclay & Umair Irfan, Energy & Environment, Vox, Nov 26, 2018
- The Depravity of Climate-Change Denial, Opinion by Paul Krugman, New York Times, Nov 26, 2018
- A political blockade is colliding with the evidence on climate change, Analysis by Ronald Brownstein, CNN, Nov 27, 2018
Wed Nov 28, 2018
- Oil kingdom and a 'high priest' stall action for 30 years by Jean Chemnick, E&E News, Oct 29, 2018
- Rebuffing Prime Minister's Order to Stay in Class, Australian Students Forge Ahead With #ClimateStrike Walkouts by Julia Conley, Common Dreams, Nov 27, 2018
- Rejecting climate report, Trump makes clear his indifference to evidence by Steve Benen, Rachel Maddow Show/MSNBC, Nov 27, 2018
- Bipartisan group of lawmakers propose landmark carbon tax by Timothy Cama & Miranda Green, The Hill, Nov 27, 2018
- Countries vowed to cut carbon emissions. They aren’t even close to their goals, U.N. report finds by Chris Mooney, Energy & Environment, Washington Post, Nov 27, 2018
- Trump on climate change: ‘People like myself, we have very high levels of intelligence but we’re not necessarily such believers.’ by Josh Dawsey, Philip Rucker, Brady Dennis & Chris Mooney, Politics, Washington Post, Nov 27, 2018
- Fact-checking the White House push back on climate assessment by Ellie Kaufman & Brandon Miller, CNN, Nov 28, 2018
Thu Nov 29, 2018
- Britain eyes large-scale CO2 capture and use by mid 2020s by Susanna Twidale, Reuters, Nov 28, 2018
- The Arctic is turning brown because of weird weather – and it could accelerate climate change by Rachael Treharne, The Conversation UK, Nov 26, 2018
- It's Not Just America: Climate Policies Are Stumbling Worldwide by Robinson Meyer, Science, The Atlantic, Nov 27, 2018
- Discussing climate change on the net by BaerbelW, Skeptical Science, Nov 29, 2018
- Indisputable Facts On Climate Change by Robert Rapier, Forbes, Nov 29, 2018
- Climate change already a health emergency, say experts by Damian Carrington, Environment, Guardian, Nov 28, 2018
Fri Nov 30, 2018
- A Simple Guide To All The Scary And Depressing Climate Change News At The Moment by Michael Marshall, Forbes, Nov 29, 2018
- A Major National Climate Report Came Out. Then the Deniers Got on TV. by Joe McCarthy, The Weather Channel, Nov 29, 2018
- UNEP: Limiting warming to 1.5C requires ‘fivefold’ increase in climate commitments by Zeke Hausfather, Carbon Brief, Nov 27, 2018
- Unable to Bury Climate Report, Trump & Deniers Launch Assault on the Science by Marianne Lavelle, InsideClimate News, Nov 30, 2018
- The Energy 202: Trump's EPA chief said there was 'no political review' of climate report. by Dino Grandoni, PowerPost, Washington Post, Nov 29, 2018
Sat Dec 1, 2018
- Climate Change Is Killing Canadians, Say Doctors, Canadian Press/HuffPost CA, Nov 29, 2018
- What You Need To Know About the UN Climate Talks in Poland by Chloe Farand and Mat Hope, DeSmog UK, Nov 28, 2018
- Striking students defy PM to protest at inaction on climate change by Josh Dye, Sydney Morning Herald, Nov 30, 2018
- Queensland's 'abnormal' bushfires linked to climate change by Kate Doyle & Lucy Murray, ABC News (Australia), Dec 1, 2018
- Climate change signals and impacts continue in 2018, Press Release, World Meteorological Organization, Nov 29, 2018
- AP FACT CHECK: 11 Trump climate goofs and 1 correct claim by Seth Borenstein, AP News, Nov 30, 2018
- But their Emails! by David Kirtley, Skeptical Science, Nov 30, 2018
-
Climate Scientist Michael Mann Releases Emails Ahead of University of Arizona Response to E&E Legal, Guest Post by Michael Mann, DeSmog, Nov 30, 2018


Comments