


 Arguments


Has Earth warmed as much as expected?
What the science says...
Climate Myth...
Earth hasn't warmed as much as expected
"According to the UN’s Intergovernmental Panel on Climate Change, the greenhouse forcing from man made greenhouse gases is already about 86% of what one expects from a doubling of CO2 (with about half coming from methane, nitrous oxide, freons and ozone), and alarming predictions depend on models for which the sensitivity to a doubling for CO2 is greater than 2C which implies that we should already have seen much more warming than we have seen thus far, even if all the warming we have seen so far were due to man." (Richard Lindzen)
The argument that "Earth hasn't warmed as much as expected" is a favorite of Dr. Richard Lindzen. Lindzen seems to have first made this argument in a 2002 letter to his local mayor in Newton, Massachusetts.
"the impact on the heat budget of the Earth due to the increases in CO2 and other man influenced greenhouse substances has already reached about 75% of what one expects from a doubling of CO2, and the temperature rise seen so far is much less (by a factor of 2-3) than models predict"
In 2005, Lindzen made the same argument in testimony to the UK Parliament House of Lords Economic Affairs Committee. He later repeated the argument on National Public Radio (NPR) in 2006, again on NPR in 2007 in a public debate which included Gavin Schmidt and Michael Crichton, in an Energy&Environment-published paper in 2007, in an article in 2008, another article in 2009, and of course the 2011 article examined in the Case Study and re-published uncritically at WattsUpWithThat and many other "skeptic" media sources. Suffice it to say, Lindzen makes this argument frequently.
Lindzen's argument has also been rebutted several times, including by Coby Beck in 2006 and Stefan Rahmstorf in 2008. Let's examine the errors that these rebuttals have uncovered in Lindzen's arguments.
Thermal Inertia
Due to the fact that much of the Earth is covered in oceans, and it takes a long time to heat water, there is a lag before we see the full warming effects of an increase in atmospheric greenhouse gases (this is also known as "thermal inertia"). In fact, we know there remains unrealized warming from the greenhouse gases we've already emitted because there is a global energy imbalance. The amount of unrealized warming is dependent upon the amount of CO2 in the atmosphere (or other radiative forcing causing the energy imbalance) and the thermal inertia of the oceans (which causes a lag before the warming is realized). Lindzen does briefly acknowledge thermal inertia in his UK Parliament testimony:
"the observed warming is too small compared to what models suggest. Even the fact that the oceans' heat capacity leads to a delay in the response of the surface does not alter this conclusion."
Unfortunately, Lindzen does not substantiate this claim, or provide any references to support it. However, Stefan Rahmstorf does attempt to quantify the thermal inertia effect in his rebuttal:
"Data from about 1 million ocean temperature profiles show that the ocean has been taking up heat at a rate of 0.6 W/m2 (averaged over the full surface of the Earth) for the period 1993–2003 [21]. This rate must be subtracted from the greenhouse gas forcing of 2.6 W/m2, as actual warming must reflect the net change in heat balance, including the heat flow into the ocean."
Rahmstorf references Willis et al. (2004), which found an oceanic warming rate of 0.86 ± 0.12 watts per square meter of ocean. Given that approximately 70% of the Earth's surface is ocean, this becomes approximately 0.6 ± 0.07 watts per square meter (W/m2) of overall ocean heat uptake. Schwartz et al. (2010) put the value at 0.37 ± 0.12 W/m2. For our purposes, we'll put the figure at 0.25 to 0.67 with a most likely value of 0.4 W/m2. Let's keep these numbers in our back pocket and move on to the second neglected factor.
Aerosols and Other Cooling Effects
Lindzen briefly addresses aerosols in his most recent article:
"Modelers defend this situation...by arguing that aerosols have cancelled [sic] much of the warming (viz Schwartz et al, 2010)...However, a recent paper (Ramanathan, 2007) points out that aerosols can warm as well as cool"
In short, Lindzen's argument is that the radiative forcing from aerosols is highly uncertain with large error bars, and that they have both cooling (mainly by scattering sunlight and seeding clouds) and warming (mainly by black carbon darkening the Earth's surface and reducing its reflectivity) effects. These points are both accurate.
However, neglecting aerosols in calculating how much the planet should have warmed does not account for their uncertainty. On the contrary, this is treating aerosols as if they have zero forcing with zero uncertainty. It's true that aerosols have both cooling and warming effects, but which is larger?
In his argument, Lindzen refers us to Ramanathan et al. (2007). This study examined the warming effects of the Asian Brown Cloud and concluded that "atmospheric brown clouds enhanced lower atmospheric solar heating by about 50 per cent." The study also noted that, consistent with Lindzen's claims about the aerosol forcing uncertainty, there is "at least a fourfold uncertainty in the aerosol forcing effect." However, this study focused on the warming effects of black carbon, and did not compare them to the cooling effects of atmospheric aerosols.
Ramanathan and Carmichael (2008), on the other hand, examined both the warming and cooling effects of aerosols. This study found that black carbon has a warming effect of approximately 0.9 W/m2, while aerosol cooling effects account for approximately -2.3 W/m2. Thus Ramanathan and Carmichael find that the net radiative forcing from aerosols + black carbon is approximately -1.4 W/m2. This is broadly consistent with the IPCC net aerosol + black carbon forcing most likely value of -1.1 W/m2:
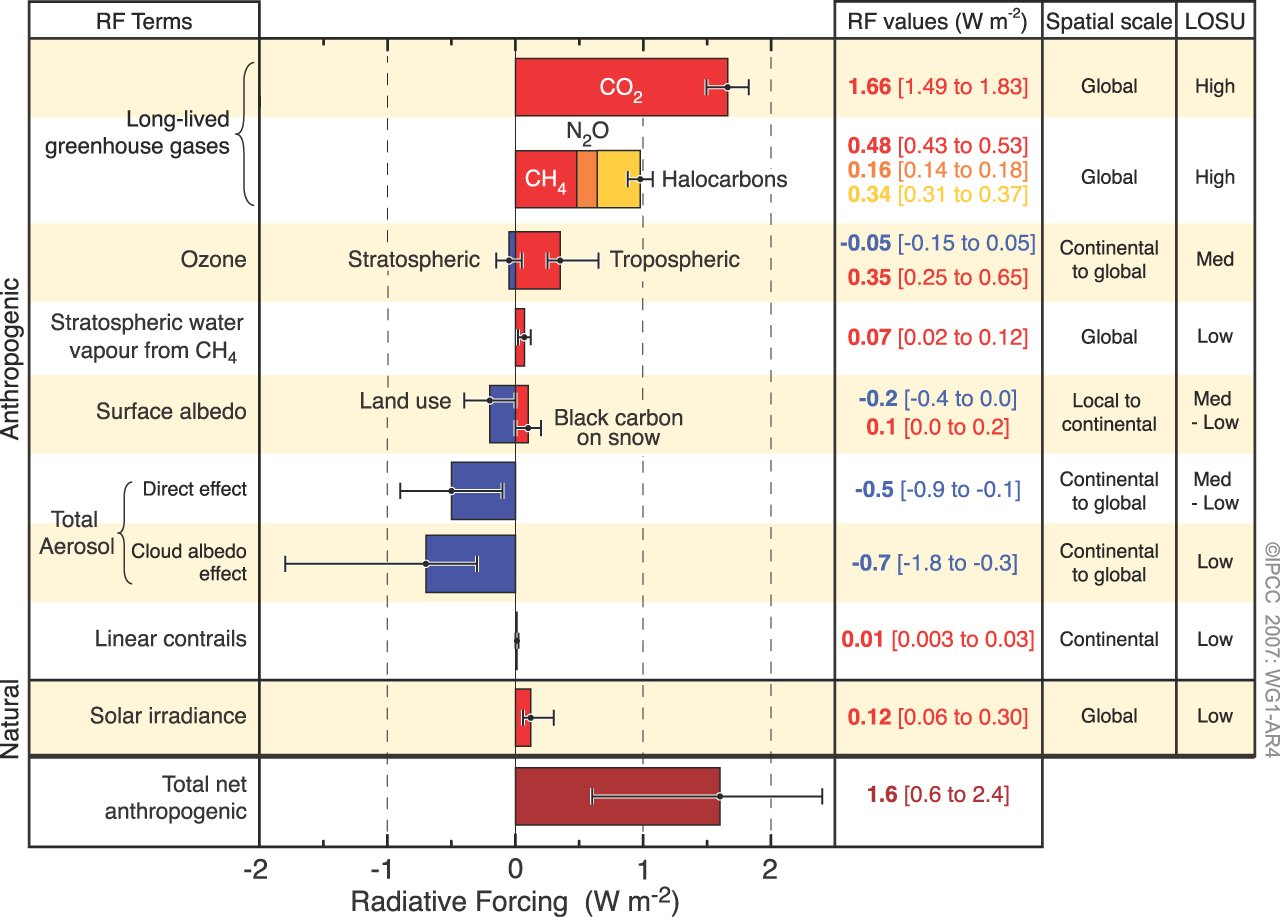
Figure 1: Global average radiative forcing in 2005 (best estimates and 5 to 95% uncertainty ranges) with respect to 1750. Source (IPCC AR4).
Note that Lindzen's assumed zero net aerosol + black carbon forcing is outside of this confidence range; therefore, neglecting its effect cannot be justified. However, since the IPCC provides us with the 95% confidence range of the total net anthropogenic forcing in Figure 1, we can account for the uncertainties which concern Lindzen, and evaluate how much warming we "should have seen" by now.
Expected Forcing Effects on Temperature Thus Far
In fact, this is a simple calculation. The IPCC 95% confidence range puts the total net anthropogenic forcing at 0.6 to 2.4 W/m2 (Figure 1). On top of that, as discussed above, ocean heat uptake accounts for between 0.25 and 0.67 W/m2. Therefore, subtracting the ocean heat uptake, the total net anthropogenic forcing over this period is somewhere between -0.07 and 2.15 W/m2, with a most likely value of 1.1 W/m2.
A doubling of atmospheric CO2 corresponds to a radiative forcing of 3.7 W/m2, according to the IPCC. Therefore, the net anthropogenic radiative forcing thus far is between approximately 0% and 58% of the forcing associated with a doubling of atmospheric CO2, with a most likely value of 30%.
In order to be thorough, we can also include the natural radiative forcings. Most have had approximately zero net effect since 1750, with the exception of the Sun, which has had a forcing of 0.06 to 0.30 W/m2 with a most likely value of 0.12 W/m2 over this period (Figure 1). Therefore, net forcing since 1750 is approximately 0 to 2.45 W/m2, with a most likely value of 1.25 W/m2. Thus the total net forcing thus far is between 0% and 66% of the forcing associated with a doubling of atmospheric CO2, with a most likely value of 34%.
What Does This Tell Us About Climate Sensitivity?
So far, global surface air temperatures have increased approximately 0.8°C in response to these radiative forcings. Since we're 0% to 66% of the way to the radiative forcing associated with a doubling of atmospheric CO2 (most likely value of 34%), the amount we should expect the planet to warm if CO2 doubles (also known as "climate sensitivity") has a most likely value of 2.4°C, with a minimum of 1.2°C (because of the large aerosol cooling effect uncertainty and the fact that we may only be 0% of the way to the doubled CO2 forcing, we can't place an upper limit on the climate sensivity parameter with this calculation). Using a much wider range of evidence, the IPCC puts the likely climate sensitivity range to a doubling of CO2 at 2 to 4.5°C with a most likely value of 3°C. Our calculation is consistent with IPCC the most likely value.
How Much Warming Should We Have Seen?
We can also flip the calculation backwards, assuming the IPCC most likely climate sensitivity of 3°C for a doubling of atmospheric CO2 and using the numbers above. In this case, we should have seen from 0% to 66% of 3°C, or about 0 to 2.0°C. Clearly the amount of warming we have seen so far is well within this range. Additionally, the most likely amount of warming is 34% of 3°C, which is 1.0°C. In other words, we have seen very close to the amount of warming that we "should have" seen, according to the IPCC.
Warming is Consistent with What We Expect
In short, contrary to Lindzen's claims, the amount of surface warming thus far (0.8°C) is consistent with what we "should have seen" based on the IPCC numbers. Moreover, this calculation puts the most likely climate sensitivity parameter value within the IPCC's stated range, whereas the much lower value claimed in Lindzen and Choi (2009) (less than 1°C for CO2 doubling) is inconsistent even with our calculated climate sensitivity lower bound (1.2°C). For additional discussion of the errors with Lindzen and Choi (2009), see here.
When we actually account for thermal inertia and negative forcings, we find that the amount of warming we have seen is consistent with what the IPCC would expect, but inconsistent with Lindzen and Choi 2009. Thus the correct conclusion is that if Lindzen is correct about low climate sensitivity, we should already have seen much less warming than we have seen thus far.
Last updated on 5 February 2011 by dana1981.


scaddenp at 09:52 AM on 12 August, 2011 "but since 2003 there has been some cooling." There has? Please see here especially Von Schuckmann and La Treon. muoncounter at 10:57 AM on 12 August, 2011 scaddenp#15, This particular meme needs to be aggressively rejected. Trends are 0.14 C/decade (UAH) and 0.17 C/decade (GIStemp); there is no such cooling. Tamino is far better at this; it would be nice if he updated his graph.
Tell it to the IPCC:
IPCC AR4 Chapter 5 Executive Summary
[DB] The moderator deleted the comment due to insinuations of academic fraud:
"The ARGO floats initially reported some cooling. Since then the raw data has been adjusted and now shows warming. I am skeptical of the validity of all that."
If you wish to wish to re-post the comment sans offending phrase (or restructure it to comply with the Comments Policy), then please do so.
Note that recent literature examines Argo data & finds coverage since 2005 to be the most robust.
[DB] I originally deleted this due to just being an off-topic drive-by link, but so many of you responded I'm reinstating it.
It is considered good form, Steve, to provide more explicative commentary when linking.
Please also note that this is waaay off-topic for this thread.
[DB] Please do continue to engage Steve as long as he stays on-topic, but please do so on one of the more appropriate threads dealing with denial (you know the drill).
Thanks!