


 Arguments


SkS Analogy 11 - Cabinets, airplanes, and frame of reference
Posted on 2 May 2018 by Evan, jg
Tag Line
The elevation of an airplane landing on a runway is only useful if measured relative to the ground (i.e., height), and not to sea level (i.e., altitude).
Elevator Statement
While determining the optimum height for kitchen cabinets, an industrious husband in Minnesota asks his wife
“Should we move the kitchen cabinets up by 0.1% from the position we originally discussed?”
“Why on earth are you bothering me about such a trivial amount?” came the reply. “Now if you were considering something ridiculous like raising them 1 ft. I would complain.”
In fact, the husband was considering raising the kitchen cabinets by 1 ft. His reference to 0.1% used the height above sea level of 1000 ft. as the reference point for making his measurements. A ridiculous analogy you say? Climate-change contrarians and not-so-well-informed skeptics make similar errors, but they are not as obvious. Read on if you want to learn the error that a Nobel Laureate made by miscommunicating in a similar manner as this industrious husband.
Climate Science
Nobel Laureate Ivar Giaever stated the following in a talk he gave on climate science,1
“From ~1880 to 2013 temperature increased from ~288K to 288.8K (0.3%). If this is true, to me it means that the temperature has been amazingly stable.”
A 0.3% increase is kind of like the 0.1% the husband raised the kitchen cabinets. Dr. Giaever was using an absolute temperature scale for his comparison. Unlike the Celsius temperature scale where 0°C is the point where ice melts, 0K on the absolute temperature scale is the point where atoms “melt” and start moving. For comparison, on the temperature scale that Dr. Giaever was using, ice melts at a blisteringly hot 273K.
However, if you live in a coastal city prone to flooding, do you care more about the temperature at which atoms “melt” and start moving (i.e., 0K), or do you care more about the temperature at which ice melts (i.e., 273K = 0°C) and raises sea level, which increases the risk of flooding of your home?
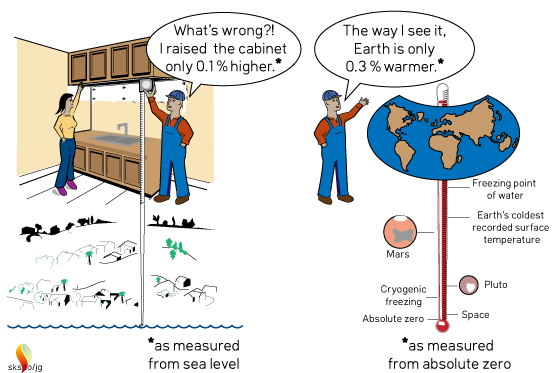
Why did Dr. Giaever choose to use as his reference point the temperature at which atoms “melt” instead of the more useful reference point where ice melts?
For measuring the height of kitchen cabinets the distance to the floor is the most logical and useful reference point.
For airplanes landing on runways, the distance to the ground is the most useful reference point for calculating the height above the runway.
Considering that sea level is one of the most damaging aspects of global warming, the change of temperature relative to the melting point of ice is a more relevant reference point than the melting point of atoms. In this context, the temperature change has not been amazingly stable as Dr. Giaever stated, but in 2013 had already increased by a relatively large 5.3% (i.e., 0.8°C)2, and by now (i.e., 2022) has increased by an even larger 7.3% (i.e., 1.1°C warming)!
Noting that the main target of the Paris Accord is to keep warming to less than 2°C above pre-industrial global average temperature, that is a 13.3% increase with respect to the melting point of ice. Warming of 3°C3 represents a 20% increase!
Coming out of the last ice age Earth warmed about 5°C, which caused sea level to rise about 120 m (about 400 ft.).
Warming of 2 or 3°C within this century is a massive increase!
Footnotes
1. Click here for a description of misleading statements by Dr. Giaever, or click here to watch a video of his talk on global warming. Dr. Giaever's misleading quote about the temperature only changing by 0.3% is taken from a slide he used, which is shown starting at 6:06 in the video.
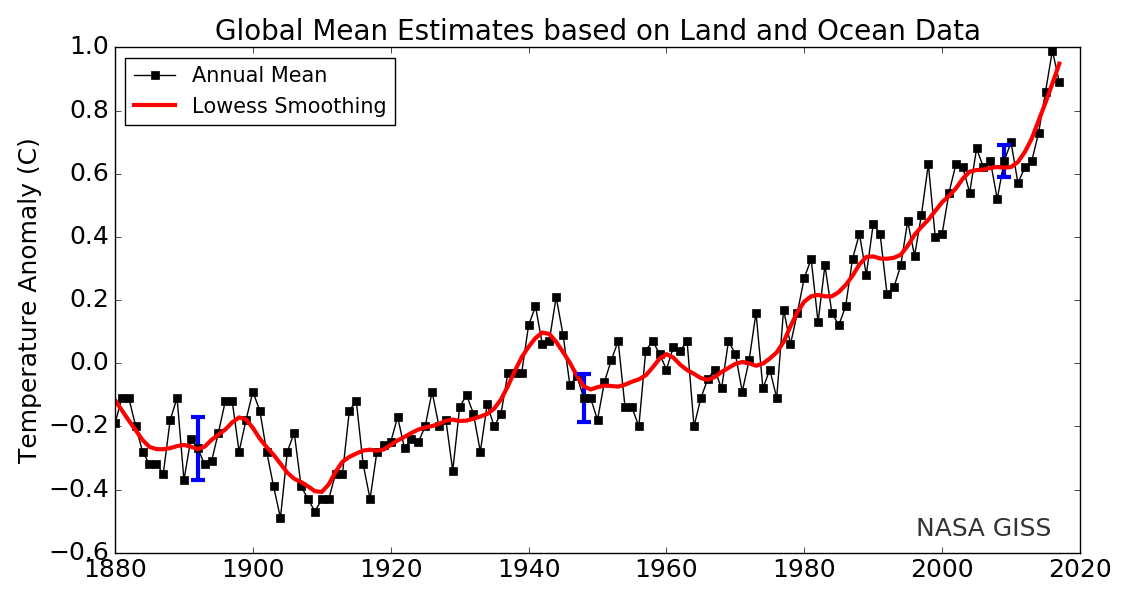
2. The temperature increases referred to here are relative to the temperature in 1880. Figure 1 shows the GISS (Goddard Institute for Space Studies) graph of temperature anomalies since 1880.
3. By some estimates, the INDCs (Intended Nationally Determined Contributions) associated with the Paris Accord would take us to nearly 3°C warming.
Graphics


A friend on facebook forwarded Giaever's talk. I told him it shouldn't take someone 5 minutes of their time to find such a massive mistake. I refer people to this graph of the last 400,000 years of global temperature, CO2, and sea level, point out that the depths of the last ice age was only 3.3 C (6F) cooler than present, and then ask them if having Chicago under a mile of ice was a significantly different climate than present and, if so, why wouldn't 3 C warmer than present also be a difficult adaptation to make?
“From ~1880 to 2013 temperature increased from ~288K to 288.8K (0.3%). If this is true, to me it means that the temperature has been amazingly stable.”
No it hasn't, because that 0.3% change has happened in a very short part of human history so its not stable from humans point of view, and what we are adapted to.
Gaiver must know this, so is being deliberately obtuse probably for political reasons. For proof he does work for the Heartland Institute, and talks in their language.
The analogy is the article is very good.
So you're telling me that sea level at the end of the ice age only increased by a factor of about .00002 (relative to the centre of the earth)? Why would anyone worry about that?
mbryson - love it! Maybe I will buy that beachside holiday house after all :-).
That is an excellent analogy.
>>The altitude of an airplane landing on a runway is only useful if measured relative to the ground, and not to sea level.<<
It behoves someone writing about the interpretation of words to get his own interpretations correct!
"Altitude" in the context of that quote IS actually measured with respect to sea level - the distance between the aircraft and the runway is "height".
(Tongue in nit-picking cheek.)
Thanks Wol for the clarification. I changed "altitude" to "elevation". For those interested, here is a link explaining the different elevations used in aviation.
it always happens - a minute after I hit 'submit' I realized I had garbled some language myself so this correction is to avoid possibly leading anyone else astray or creating unnecessary side-tracks .. I had wrongly referred to "anomaly" as being a change from a baseline whereas I should have said "difference" .. subtle but open for misinterpreation .. also to be fair then I checked Thesausrus provided by Word and sure enough one of the synonyms of "anomaly" it gives is "difference" so maybe it is not such an unusal use of language
I inadvertantly deleted the following post. My apology to John S.
John S at 21:13 PM on 4 May 2018
I recall watching Glaevers talk and being unimpressed by him making fun of climate scientists for supposedly thinking it possible to get an accurate average absolute temperature of the whole globe. It was as if he had never noticed that the vertical axis was labled "tempeature anomaly". Or maybe he didn't understand that it simply means change from a baseline (to be fair it is a bit of an unusual use of that word - different from its use in everyday language). I had previously read an explanation on the NASA website as to why the so-called "temperature anomaly" is used.
However, this posting reminded me of questions I have re the rationale and justification for using combined land and ocean data; first I should reveaL I am a retired engineer struggling to understand the science and know I never will entirely, but I keep on trying, so I'm hoping some compassionate scientist out there will take my questions at face value and provide explanations in layman's language:
1) what does the 2 degree limit of Paris Agreement refer to, land only or land and ocean?
2) isn't combining land and ocean a bit like adding apples and oranges?
3) is the answer to 2) no more than the use of anomalies and the fact that the data in succeeding time intervals always come from the exact same locations, plus the fact it is useful to refer to a single number?
4) is there anything else anyone can say that might me feel better about combined land and ocean data, as it seems a bit weird to me?
Cheers
in my e purpose of me posting this is an enquiry
John @7. I am not any kind of authority on the topic of temperatures, but let me offer my thoughts based on what I've learned.
We are really concerned with the total energy accumulated by the combination of land+oceans. We want to express this total energy as a single temperature difference that gives us a single index. That is, layman like us (I am a chemical engineer, but not a Climate Scientist) can more easily grasp the meaning of temperature than we can energy. But to make this meaningful, the "average temperature change" needs to correlate to what's happening over the entire surface of the earth, and not just one part. So combining land+ocean simply reflects that we live on land but that our energy system is dominated by a water world. The two are linked, and because the oceans strongly control temperature fluctuations, we must include both oceans and land to come up with any kind of meaningful index, such as "average temperature anomaly."
Until you raised this good question, I had never thought about it being meaningful to separate land and ocean temperatures, simply because what we want is a single temperature that gives the average temperature change over the entire earth.
Taking a stab at your questions
1) My understanding is that the 2-degree limit corresponds to combined land+ocean average.
2) No, because land+ocean are a linked energy system. El Ninos transfer lots of energy from the oceans into the air, and La Ninas transfer a lot of energy from the air to the oceans. They really need to be considered as a linked system. Obviously if you live in the Arctic the temperatures there control what happens locally, but for the purpose of creating a global index with a single number, we must look at the entire system.
3) I will pass on this question. Hopefully someone can step in.
4) See above comments.
Now we are waiting for a real Cliamate Scientist to respond. :-)
John @8, have a look at the following link where the GISS methodology is explained. When referring to Land+Ocean, the GISS plot I included is still an air-temperature anomaly, referring to global surface temperature. As such, it is simply tracking an average temperature that is a combination of surface temperature over land and over ocean. It is not, as I understand it, the ocean-water temperature, but rather the average surface temperature over the ocean and land.
Evan @10,
Your graph in the OP is plotting GISS LOTI and that is "Combined Land-Surface Air and Sea-Surface Water Temperature Anomalies," a combined record using GHCNv2 SAT & ERSSTv5 and not as you say @10.
Oh, no! I am yet another engineer. But I will still have a stab at the Qs @8:-
(1) The 2ºC limit is the global land & ocean temperature rise. It does make a difference. GISS LOTI, for instance rose +1.2ºC above the 1880-1900 average in 2016. Yet GHCNv2 SAT rose +1.7ºC, a significant difference.
(2) The relationship between ocean SAT & SST is quite strong although the season, time of day and geographical location will impact that relationship. Beyond those considerations (which are fixed through a temperature record), my understanding is that the variation of the relationship is then mainly down to wind speed (which is not fixed through the record). Note that the Land SAT is the average of Tmax & Tmin which differs from the actual daily average.
So we do have apples and oranges, but that is the only data available if we want a full 20th century record. We are therefore stuck with it.
(3) Anomalies are required to create a global average from point measurements as the anomaly remains constant over a far wider area than an absolute temperature. So we are stuck with anomalies even if we weren't combining SST & SAT.
(4) The idea that the global average temperature anomaly is a simply and cleanly derived quantity (non-weird abet a combination of SST & SAT) does tend to become a difficult idea to sustain when the decisions required in creating the global anomaly begins to be better understood. As an example, take the SST-over-ocean/SAT-over-land situation and consider that each year 10 million sq km of Arctic sea ice and 15 million sq km of Antarctic sea ice melts away being replaced by ocean. Thats 5% of the global area. And with AGW the actual ocean being thus exposed in the Arctic is much different today than it was back in 1900. (Antarctic temperatures are not addressed by GISS LOTI until the second half of the 20th century. It is the same with temperatures in the high Arctic but we can assume they were premanently frozen through those years.) The BEST global temperature record gives two different approaches to tackling the sea ice problem and one way adds roughly +0.15ºC to the warming since 1900 than the other does.
I think the real issue is not the datum whihc is designated as zero, but the implication that small percentages are unimportant. This is patently silly. Would you be concerned if only 0.3% of an Airbus 380 was falling on your head? Or to make it more relevant to the Kelvin scale, consider that a 1% increase in body temperature is the difference between being perfectly healthy and being in the hospital.
The difference between the last glacial maximum when there was mile-deep ice covering much of North America and today is a global temperature change of about 5 K. That is only a change of about 2% according to Giaver's reasoning, but it sure isn't trivial.
MA Rodger @10.
Thanks for the educational tutorial. I'm always sure that if I take stab at it and miss something, that someone like yourself will come along to clarify.
Perhaps I was not clear in my explanation. I understand that surface temperatures over the ocean are cooler than over land. And I understand that the data set is not perfect, and appreciate your detailed explanation of where it is not perfect. My main point (which I think is still valid) is that the only thing that really makes sense to track is the combined land+ocean temperature, because that gives the most consistent picture of how things are changing from year to year.
In any case, thanks for your detailed explanation.
rocketeer @12
Perhaps the other issue is that many simply don't realize how sensitive the atmosphere is. I had an adult tell me, "You mean we humans can affect a planet that has been here for 4.5 billion years?" As if age implied stability (at least it does not in the case of humans), and as if our actions were small. Eat 10% more calories than is recommended (i.e., 2200 instead of 2000/day) and your body can adapt and handle it. And the rate at which you eat the extra calories does not matter too much. But increase the temperature of the Earth by 10% (use whatever baseline you prefer), and the atmosphere and other environments go through a huge readjustment. The atmosphere within which we live is simply a sensitive system, and many people don't get that, because there is a time lag between our actions and the response.
Your reference to small changes in body temperature having big effects is perhaps the best example of a sensitive system to which we can identify.
Regarding temperature anomalies, I've seen it expressed thus: increase your body temperature by two degrees and you don't feel well, but increase it by four degrees and you're dead!
Regarding baselines, as I understand it, the various teams investigating the problem use different baselines. Has there not been a move to get everyone using the same baseline? It would really help if the baseline was close to what is considered to be "pre-industrial".
Digby @15
For an example of just how hard this is, check out the following Scientific American article and the following quote (emphasis mine).
In what’s become a spring tradition like Passover and Easter, carbon dioxide has set a record high each year since measurements began. It stood at 280 ppm when record keeping began at Mauna Loa in 1958. In 2013, it passed 400 ppm. Just four years later, the 400 ppm mark is no longer a novelty. It’s the norm.
Yes, they are saying that when CO2 measurements began in 1959 that we had 280 ppm CO2. Not only is there a problem defining consistent baselines, but there is further confusion about getting simple facts correct.
Dogby Scorgie @15,
The use of a 30-year baseline set before the second half of the 20th century is made difficult as much of the data used to calculate such an early baseline will be of low quality and much entirely absent. The WMO approach used to be to update the baseline used every 30 years but that has become every 10 years as AGW creates significant change while the baseline data will be used by some without consideration of that change. Thus the WMO decided to update baselines every 10 years (so now it is 1980-2010) but to keep 1961-90 "as the historical base period for the sake of supporting long-term climate change assessments." Note baselines will be used for all types of data not just temperature. And for global temperature records,1961-90 is the anomaly base used by HadCRUT but BEST & GISS use 1951-80 and the NOAA 'Climate at a Glance' Global ime Series pages say "Please note, global and hemispheric anomalies are with respect to the 20th century average. Continental anomalies are with respect to the 1910 to 2000 average. Coordinate anomalies are with respect to the 1981 to 2010 average."
MA Rodger @17
Dogby? Well, that's a new one!
I see the problem with baselines, but it seems to me there is a solution: Agree to use, for example, 1961 to 1990 as the historical baseline, and then arbitrarily specify the warming from pre-industrial up to that baseline as equal to some consensus amount. It's like agreeing on the freezing and boiling points of water for the Celsius scale — well, sort-of. Maybe someone can think of a better analogy.
Digby Scrogie @18,
And keeping climatologists to a 1961-90 baseline is a bit like herding cats while the pre-industrial-to-std-baseline warming is only offered with the greatest reluctance, a reluctance absent with the likes of sea level, GHG levels, or even pre-industrial-temps relative to the Early Eocene. As an example, the IPCC AR5 Technical Summary will talk of limiting ΔT to 1.5ºC or 2ºC above "pre-industrial" but resorts to using 19th century temperatures without eplicitly saying 'this is being used as the pre-industrial T' and even then with this being "assumed" rather than set more confidently. Thus AR5.Technical Summary TFE.8 'Climate Targets & Stabalisation':-
(And note the 1986-2005 baseline employed.)
You have to delve into the AR5 Synthesis Report before you find somebody sneaking in explicit use of "relative to pre-industrial" (eg on the y-axis of Figure SMP10b, which is a graphic re-used from Figure SMP5b that does not.) I can understand the reluctance but this "relative to pre-industrial" thing is a nettle that requires being better grasped.
MA Rodger @19
Scrogie? Well, that's another new one!
Anyway, what baffles me about all this is how one can talk about limiting warming to x degrees above pre-industrial (as in Paris-style agreements) if one has not defined what warming has already occurred. The latter would be the warming from pre-industrial to some specified period in the twentieth century when temperature measurements can be considered reliable.
Digby Scorgie @20,
Myself, I think the world will probably end up using that 0.61°C adjustment from HadCRUT4 1850-1900 as being pre-industrial. The scientific debate about revising that value was covered in The Guardian a month ago. I reckon the main problem faced by those wanting to set the baseline period earlier is the difficulty the likes of Hawkins et al (2016) & Schurer et al (2017) in providing a single number rather than a range with all its attendant ambiguity. (Hawkins et al argue for using 1720-1800 as pre-industrial and with it a range of 0.55°C-0.80°C to replace the 0.61°C.)
MA Rodger @21
I'd be happy with that.