Climate Science Glossary

Term Lookup

Enter a term in the search box to find its definition.

Settings

Use the controls in the far right panel to increase or decrease the number of terms automatically displayed (or to completely turn that feature off).

Term Lookup

Settings


All IPCC definitions taken from Climate Change 2007: The Physical Science Basis. Working Group I Contribution to the Fourth Assessment Report of the Intergovernmental Panel on Climate Change, Annex I, Glossary, pp. 941-954. Cambridge University Press.

Home Arguments Software Resources Comments The Consensus Project Translations About Support

Twitter Facebook YouTube Mastodon MeWe

RSS Posts RSS Comments Email Subscribe


Climate's changed before
It's the sun
It's not bad
There is no consensus
It's cooling
Models are unreliable
Temp record is unreliable
Animals and plants can adapt
It hasn't warmed since 1998
Antarctica is gaining ice
View All Arguments...


Username
Password
New? Register here
Forgot your password?

Latest Posts

Archives

A South American hockey stick

Posted on 18 September 2010 by John Cook

A new paper has just been published employing a new technique for reconstructing past temperatures (Kellerhals 2010). It uses Ammonium concentration from an ice core in tropical South America (the eastern Bolivian Andes) as a proxy for temperature. This enables them to build a temperature record going back 1600 years in a region which has had little proxy data available until now. They find a distinguishable Medieval Warm Period and Little Ice Age in the record. Nevertheless, they also find the last few decades show unprecedented warmth over the last 1600 years.


Figure 1: Reconstructed tropical South American temperature anomalies (normalized to the 1961–1990AD average) for the last 1600 years (red curve, smoothed with a 39?year Gaussian filter). The shaded region envelops the ±2 standard deviation uncertainty as derived from the validation period. Poor core quality precluded any chemical analysis for the time interval between 1580 and 1640 AD.

Note that Figure 1 shows only the proxy record from the ice core - no instrumental data is included. Of course, the usual caveat applies when looking at a single proxy record - this is a temperature record for a single location.To get a better feel for past climate, you need to look at proxy records from a range of locations.

When we combine all the various temperature records, we find the same result: modern temperatures are significantly warmer than medieval temperatures. This is demonstrated in Moberg's reconstruction of Northern Hemisphere temperature (which happens to bear a striking resemblance to the South American proxy record).


Figure 2: Northern Hemisphere Temperature Reconstruction by Moberg et al. (2005) shown in blue, Instrumental Northern Hemisphere Temperatures from Hadley shown in Red. Thanks to Robert Way for providing this graph.

0 0

Printable Version  |  Link to this page

Comments

1  2  Next

Comments 1 to 50 out of 55:

  1. Question, is 1600 years enough of a sample in terms of climate cycles to be significant? I am just thinking of some of the wild swings we see in much larger samples, many of which seem to take thousands of years, and I don't quite know how to explain to myself or others why such a small snap shot is significant.
    0 0
  2. @Sealcove: well, there's an easy answer to that, and it's contained in your own examples: "many of which seem to take thousands of years." The current observed change, as can easily bee seen on the above graphs, is quite rapid. Cycles that take thousands of years to complete by definition tend to move much slower than what we're seeing. Thus, it is very unlikely that the current, rapid change is due to such natural cycles.
    0 0
  3. This is really interesting! Thanks for posting it. Unfortunately, it is in a section of Journal of Geophysical Research that I can't get (but maybe at work!).
    0 0
  4. Re: Jeff Freymueller (3) Try here. the Yooper
    0 0
  5. Thanks, Yooper.
    0 0
  6. But are these two 'hockey sticks' strictly the same as the Mann hockey sticks that got everybody so excited? Mann had near perfectly straight down trending shafts with a very obvious blade. Both the figures you show allow for far more natural variability than the contentious Mann hockey stick. It's worth reading the text in the Moburg et al. (2005) link you provide under Fig2 to get a perspective on that. Can we throw away Mann's hockey sticks?
    0 0
  7. Doesn't this research indicate that the MWP was global, or at least not restricted to the northern hemisphere?
    0 0
  8. I think that mann's "hockey sticks" are a contribution to the scientific literature. I think that some individuals (who will remain unnamed) have taken aim at Mann far to much for his previous studies really tried to develop novel techniques and was ripped apart for doing so regardless of the amplitude of millennial to centennial scale changes in the earth's climate cycles even our best measurement techniques show that the greenhouse effect is increasing.
    0 0
  9. Since John seems to approve of fig1 not having the instrument record attached I thought it'd be interesting to see moberg 2005 without it as well (although these are uncalibrated). Moberg 2005 SI
    0 0
  10. I notice that this reconstruction shows a "Medieval Warm Period" from about 1000 to 1200 AD. Does that mean that the MWP was possibly worldwide, not just a Northern Hemisphere or North Atlantic phenomenon?
    0 0
  11. I notice my comment is the same as Lazarus #10 - you have my permission to remove!!!
    0 0
  12. Too many hockey sticks around, it's going to be boring :) Small (irrelevant) typo, Moburg -> Moberg both in the text and in the caption
    0 0
  13. I see your tropical South American hockey stick ( already broken I notice) and raise you one Arctic hockey stick http://newsimg.bbc.co.uk/media/images/46320000/gif/_46320407_arctic_temperatures_466gr.gif
    0 0
  14. @archiesteel: That is helpful, but I still can't help wondering if we can truly say that this recent warming is outside of the range of a normal shift without a larger sample. Do we have any longer range proxy data for South America to compare it against to illustrate that the recent shift is unprecedented?
    0 0
  15. Figure 1, if accurate, seems to take some wind out of AGW as exhibited by the overall extent of natural temperature oscillations. Temperature is seen to change as much on its own (between 1000 AD and 1500 AD), as it does in the subsequent 500 years that follow. While man's activities are surely contributing to recent warming, the perturbance doesnt appear to be that significant given the total amount of fossil fuel that has been consumed in this period. It is also hard to ignore the data that shows global warming is happening in the northern hemisphere faster than in the southern hemisphere. Seems to be loosing about 1 degree on its way south.
    0 0
  16. @Sealcove: if confronted with this, turn the question around, i.e. demand if people have proof of climatic changes that happened as quickly as the current warming without some clear catastrophic event (supervolcano, etc.) associated with it. @RSVP: "Figure 1, if accurate, seems to take some wind out of AGW as exhibited by the overall extent of natural temperature oscillations." Not really. We are already aware of natural temperature oscillations, that's how we know the current one isn't natural. "Temperature is seen to change as much on its own (between 1000 AD and 1500 AD), as it does in the subsequent 500 years that follow." You seem to forget the spike at the end (i.e. the instrumental record), which is *exactly* what AGW is about. So this graph reinforces AGW, not "take some wind" out of it as you would suggest.
    0 0
  17. Oops, the insturmental record is only added to the second graph, but you still see the beginning of the dramatic increase at the end of the first one...
    0 0
  18. #15: "perturbance doesnt appear to be that significant given the total amount of fossil fuel that has been consumed" Can you substantiate that? Are you aware that the annual 2ppm increase in atmospheric CO2 tends to be about 50% of annual CO2 emissions? "global warming is happening in the northern hemisphere faster than in the southern hemisphere." Most of the CO2 sources are in the northern hemisphere. If atmospheric CO2 contributes to warming, one would expect exactly that the northern hemisphere warms more rapidly. Add in the greater thermal inertia of the southern hemisphere (all that water and a big mass of ice) and it would be very surprising if the southern hemisphere was not warming more slowly.
    0 0
  19. I should at least point some of you to here: http://www.skepticalscience.com/medieval-warm-period.htm And have you guys note that although the MWP did affect the Northern Hemisphere distinctly and strongly (far stronger than the Southern Hemisphere) temperatures now are far beyond those achieved during the MWP and also that the mechanisms which explain the MWP are the same mechanisms which likely caused the 20th century warming but that these same mechanisms are not at play now.
    0 0
  20. Muoncounter, CO2 is well mixed, I don't think that where the sources are located is what makes the difference. The much larger proportion of ocean on the Southern hemisphere is more likely to contribute.
    0 0
  21. To add to what Robert Way just said... I don't think anyone should be jumping up and down over a global and pronounced MWP. As Robert said, the same mechanisms are at work today. If we see a strong MWP that would suggest higher climate sensitivity, one of the primary uncertainties discussed by the IPCC. We REALLY don't want to find out climate sensitivity is in the 5C or 6C range. As I understand it that would be a very very unpleasant scenario.
    0 0
  22. #20:"CO2 is well mixed, I don't think that where the sources are located is what makes the difference." I wonder about the degree of mixing. Compare BarrowBarrow to Palmer Station; there are clear differences in seasonal amplitude as well as annual mean value between the hemispheres.
    0 0
  23. Although this graph shows a MWP that does not mean that it is the same as the northern hemishere MWP. Deniers like to look at a single graph, like figure A, and say here is the MWP. The problem is that the timing of this supposed MWP is different at different locations. When Mann adds up all the different graphs, the "Medieval warm periods" and "little ice ages" cancel each other out. This happens because they do not occur at the same time globally. This graph will be added to Mann's data. Its MWP will cancel out like the rest have. Most of the supposed MWP is just a bunch of local effects that occur at different times and are not globally significant. The current warming is Global and significant everywhere.
    0 0
  24. RSVP 15. The reconstructed temperature shown at the time of the MWP is about -0.2C falling by 1500 to about -0.6 C. This is a change of 0.4C This fall is reversed by 1900. The change shown for the last 100 years is then a further more rapid rise of 0.3C. At present GISS indicates the anomaly for South America is between 0.5 and 1.0C. So this proxy with the temperature record indicates that in the last 100 years temperature has risen 0.7 to 1.2 C. This is a larger and faster change than any other indicated by the proxy in the last 1600 years.
    0 0
  25. RSVP #15 "While man's activities are surely contributing to recent warming, the perturbance doesnt appear to be that significant given the total amount of fossil fuel that has been consumed in this period" Please, quantify rather than assert ? How much would you expect recent warming to be given anthropogenic changes ? How much has it been ? (clue: according to climate scientists the two line up rather well...)
    0 0
  26. Not going to mention any names here, but folks who still obsess over Mann's work of a dozen years ago (an eternity in terms of the rapid progress of climate-science) have absolutely no clue about how science really works. Mann was the *first* person to attempt a global temperature reconstruction based on proxy data. As with virtually any scientific *first attempt*, there was plenty of room for improvement. And the improvements did come, it terms of additional reconstructions that built on and refined the techniques pioneered by Mann a climate-science eternity ago. Contrast the situation with Mann vs. McIntyre/McKitrick. Mann's work spawned a bunch of additional research that largely confirmed (and improved on) his original work. Mann's original hockey-stick did not capture low-freq temperature variations adequately, but as a pioneering "first try", it wasn't bad at all. None of the follow-on studies repudiated his work; they improved upon it. This latest paper is just one more example. Now look at the McIntyre/McKitrick paper that was published back in 2005. In the 5+ years since that paper was published, how many follow-up scientific papers did it spawn? How much new scientific investigative work did it inspire? Were followup papers published that improved on M&M's work? Promising new avenues of research always result in new papers being published. How many new papers did M&M's work generate? Mann himself has published a "new and improved" hockey-stick reconstruction, and has been a very productive scientist the past few years. How much new research have M&M published in that past 5 years? To sum up: Mann's original paper inspired a whole new avenue of (ongoing) scientific resarch. M&M's paper, in contrast, just molders away in the "not even wrong" circular file of failed journal papers.
    0 0
  27. caerbannog: good summary
    0 0
  28. Philippe Chantrea@20 "Muoncounter, CO2 is well mixed, I don't think that where the sources are located is what makes the difference. The much larger proportion of ocean on the Southern hemisphere is more likely to contribute." Despite the mixing, here's a NASA global map showing that there are concentrations at certain latitudes: http://www.nasa.gov/multimedia/imagegallery/image_feature_833.html Interesting map! You have higher concentrations in the Northern hemisphere where there is more land mass, basically a double whammy.
    0 0
  29. Re: The Ville (28) To amplify on your NASA map, here's (because you reminded me of it) an animation showing the hemispherical contributions over time, in motion. Kinda cool to watch. The Yooper
    0 0
  30. @ The Ville. Ok, but these variations span about 15-20 ppm. I don't know what kind of a difference in radiative forcing that makes but I'm guessing not that much.
    0 0
  31. 25.VeryTallGuy Please, quantify rather than assert ? About 1/3-1/2 of 20th Century warming is anthropogenic.
    0 0
  32. ...... with nothing "in the pipeline".
    0 0
  33. Re: HumanityRules (31, 32) You waste everyone's time here by voicing opinions contrary to the consensus of knowledge and then fail to provide any source for those opinion. Baseless assertions. Hot air. Wasting time. I thought you were better than that. Disappointing. The Yooper
    0 0
  34. @HumanityRules: why are you responding for RSVP? He's a grown man, he can provide his own answers (hopefully, it'll be better than yours).
    0 0
  35. Mann had near perfectly straight down trending shafts with a very obvious blade.
    I see less variability, but definitely not a straight line. It's also useful to read Mann 99 conclusions.
    "Although NH reconstructions prior to about AD 1400 exhibit expanded uncertainties, several important conclusions are possible, notwithstanding certain caveats. While warmth early in the millennium approaches mean 20th century levels, the late 20th century still appears anomalous: the 1990s are likely the warmest decade, and 1998 the warmest year, in at least a millennium. More widespread high-resolution data which can resolve millennial-scale variability are needed before more con dent conclusions can be reached with regard to the spatial and temporal details of climate change in the past millennium and beyond."
    Both the figures you show allow for far more natural variability than the contentious Mann hockey stick.
    Variability is... variable from study to study. You'd expect more variability at smaller scales - ie, globe v region, region v city etc.
    0 0
  36. @Lazarus
    Doesn't this research indicate that the MWP was global, or at least not restricted to the northern hemisphere?
    There's still a lot of spatial and temporal inhomogeneity, but it does seem by now that 950 - 1250 AD was particularly warm for most of the globe. This old skeptic map is worthwhile pouring over to see that inhomogeneity. Most proxy data indicate an MWP during the classic period, but others show cool temps for that time and warm peaks beyond the MWP. http://pages.science-skeptical.de/MWP/MedievalWarmPeriod.html (You can hover over or the graphs to expand them, and click on them to get more details)
    0 0
  37. "archiesteel at 12:37 PM on 19 September, 2010 @HumanityRules: why are you responding for RSVP? He's a grown man, he can provide his own answers (hopefully, it'll be better than yours)." To HumanityRules: Thanks for pointing out what the graphs clearly indicate. archiesteel I went to the link and could only read the abstract without paying for the actual article. The last sentence in the abstract refers to the detection of "unprecedented" warming in recent times. Imagine if you were in a hotel and expected to pay to hear a fire alarm.
    0 0
  38. 33.Daniel Bailey 34.archiesteel I thought RSVP put forward a good discussion point. VTG wanted to ignore that discussion and instead wanted a definitive answer, I think that's were the silliness started. It's worth discussing natural variability in light of paleo-reconstructions. The discussion around these reconstructions tend to focus narrowly on the rather trivial point of whether todays temp is higher than 800 years ago. My understanding is there is more to be gained than that. I was being slightly flippant with my answer but that doesn't mean I think the numbers would be unrealistic. Jasper Kirkby @ CERN seems to think there is more to this question. Sorry to all concerned ;)
    0 0
  39. Philippe@30: "Ok, but these variations span about 15-20 ppm. I don't know what kind of a difference in radiative forcing that makes but I'm guessing not that much." True! I suspect the differences between the hemispheres are a mixture of things, with some more dominant than others.
    0 0
  40. Daniel Bailey@29: Probably a better animated visualisation? http://youtu.be/l8tPKj20GFo
    0 0
  41. #29 & #40: Why not go right to the source? 
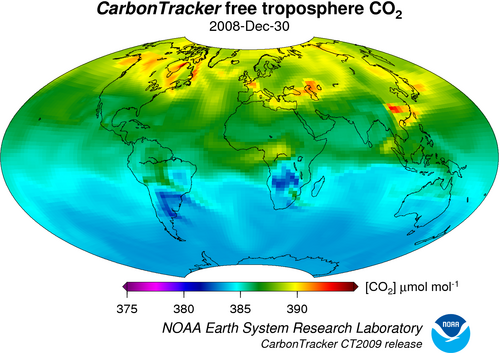
click for full scale at source page Change to 'global' 12-31-08 At the time of that image the N/S total variation was indeed about 15 ppm. In the first image in the global data set, 1/1/01, it was only 8 ppm. So the discrepancy between hemispheres has doubled in 9 years? That's no natural cycle. And 15ppm? At 395ppm, the delta F is 1.84; at 380ppm, delta F is 1.63, a difference of 11%. Seems like a lot.
    0 0
  42. @31 HumanityRules <"I> About 1/3-1/2 of 20th Century warming is anthropogenic". Another assertion with no sources to back it up.
    0 0
  43. Ah, HR brings up the CLOUD experiment again. The source for that is Duplissy et al (2010). Available here: http://www.atmos-chem-phys.net/10/1635/2010/acp-10-1635-2010.pdf The experimental design left some to be desired: "The large observed growth rates indicate the presence of additional trace vapours in the aerosol chamber, whose identity is unknown but for which there is indirect evidence of background organic vapours. The presence of background vapours is also inferred from the observation that small (of order 0.1C) increases of temperature invariably trigger nucleation bursts, which is attributed to the release of unknown vapours from the chamber walls." The conclusion is not very, well, conclusive, as in: "However, during most nucleation events, the contribution of ion processes appeared to be minor" End word:"In summary, the exploratory measurements made with a pilot CLOUD experiment at the CERN Proton Synchrotron have validated the basic concept of the experiment, provided valuable technical input for the CLOUD design and instrumentation,and provided, in some of the experiments, suggestive evidence for ion-induced nucleation or ion-ion recombination as sources of aerosol particles from trace sulphuric acid vapour at typical atmospheric concentrations." Since Svensmark was involved in the paper, it is no surprise these words are found, but in fact there is very little there to hang on. Suggestive evidence. I like to be a skeptic too. Suggestive evidence does not impress me much.
    0 0
  44. I get your point Muoncounter but, still, what matters is how much of a difference in radiative forcing this translates into. These images are also snapshots, how does it average over time? You'd expect concentrations to be slightly higher, as they are observed, near the regions where the most fossil carbon is burned. However, it remains that even very far from these regions the concentrations are not so drastically different that you can't say the CO2 is overall well mixed.
    0 0
  45. Re: RSVP (37)
    "I went to the link and could only read the abstract without paying for the actual article."
    Link to the full source provided in comment 4 above. The Yooper
    0 0
  46. #43:"the CLOUD experiment " Philippe: Thanks for that link. This is wayyy off topic, but since it came up here: Upon reading the paper, there is some lingering confusion over what they are doing: During selected periods, the chamber was exposed to a 3.5 GeV/c positively-charged pion beam from a secondary target. Pions of this energy correspond closely to the characteristic energies and ionisation densities of cosmic ray muons penetrating the lower troposphere. Minor editorial nit pick: GeV/c is a momentum, not an energy; the energy would be 3.5 GeV. We all make typos. Muon energies range from 6 GeV near the top of the atmosphere to 4 at ground, losing energy to ionization - a process that is continuous. Because of the high flux of muons (~1/cm^2 per minute at the surface -- see link above) due to solar cosmic rays, if muons alone were cloud-formers, we'd live in a sea of clouds. Yet the experiment was designed to study galactic cosmic rays: The present results, while suggestive, are insufficient to unambiguously establish an effect of galactic cosmic rays on cloud condensation nuclei, clouds and climate, ... Experiments are planned for the CLOUD facility at CERN to resolve this deficiency. With GCRs, we typically speak of much higher energies and that was the original pitch for enhanced ionization. Here is a very readable blog post on GCRs. I did a very preliminary analysis of online high energy events from the Auger detector; there is a slight increase in frequency during the sunspot minimum of 2009. Anyone note any increased cloudiness during that time?
    0 0
    Moderator Response: Everybody who wants to discuss this further, please do so on the thread of the skeptic argument It's Cosmic Rays".
  47. 43.Philippe Chantreau I actually linked to the video because he spends most of the time presenting data (including paleo) suggesting there is a fair degree of natural variability in the pre-industrial record. As he says he's not presenting answers just raising questions. The intent was to use it to highlight the wider discussion around natural variability not specifically GCR's Maybe you know that Duplissy et al (2010) was the 2009 data from a pilot run. The whole point was to bring to light errors in experimental design. I have no sense of the difficulty involved in these highly complicated physics experiments but I expect its high. Nobody really holds any value to this data, it's more like an update on how this multi-million dollar project is going. As well as Svenmark there are a total of 19 collarborating groups, from 19 separate institutes working on this project. It's laudable that you should suggest that this work is being subverted by deniers. 42.RickG Judith Curry suggests the IPCC has a very low estimate of uncertainty which leads them to the conclusion that late 20th C warming is 5% assigned to uncommitted belief, 67% assigned to anthropogenic forcing, 28% assigned to natural variability. Her own assessment of uncertainty leads her to believe 40% assigned to uncommitted belief, 30% assigned to anthropogenic forcing, 30% assigned to natural variability. This means anthro could be anywhere between 30-70%, but natural could also be 30-70%. I based my own opinion on papers looking at regional natural variability and email exchanges with their authors. But I also hold the opinion that the IPCCs drive to reduce uncertainty is not based on science but on political necessity.
    0 0
  48. HR, Unfortunately, Judith Curry cites no sources for her probability "weighting". She does, however, assert that the colors of the Italian flag can help us figure it all out.
    0 0
  49. Re: HumanityRules (47) You should have a read of this. And ponder on it. The Yooper
    0 0
  50. @HR: quoting Judith Curry doesn't automatically equate providing scientific evidence that supports your arbitrary claims. I'm still waiting to have some valid sources cited to support your claim that 1/3 to half the warming is anthropogenic. Otherwise, we'll have to assume you pulled these figures out of the place where TSI is nil.
    0 0

1  2  Next

You need to be logged in to post a comment. Login via the left margin or if you're new, register here.


The Consensus Project Website

THE ESCALATOR

(free to republish)


© Copyright 2024 John Cook
Home | Translations | About Us | Privacy | Contact Us