Climate Science Glossary

Term Lookup

Enter a term in the search box to find its definition.

Settings

Use the controls in the far right panel to increase or decrease the number of terms automatically displayed (or to completely turn that feature off).

Term Lookup

Settings


All IPCC definitions taken from Climate Change 2007: The Physical Science Basis. Working Group I Contribution to the Fourth Assessment Report of the Intergovernmental Panel on Climate Change, Annex I, Glossary, pp. 941-954. Cambridge University Press.

Home Arguments Software Resources Comments The Consensus Project Translations About Support

Twitter Facebook YouTube Mastodon MeWe

RSS Posts RSS Comments Email Subscribe


Climate's changed before
It's the sun
It's not bad
There is no consensus
It's cooling
Models are unreliable
Temp record is unreliable
Animals and plants can adapt
It hasn't warmed since 1998
Antarctica is gaining ice
View All Arguments...


Username
Password
New? Register here
Forgot your password?

Latest Posts

Archives

Svensmark and Friis-Christensen rebut Lockwood's solar paper

Posted on 8 October 2007 by John Cook

Recently, Henrik Svensmark and Eigil Friis-Christensen published Reply to Lockwood and Fröhlich - The persistent role of the Sun in climate forcing, rebutting Mike Lockwood's Recent oppositely directed trends in solar climate forcings and the global mean surface air temperature. It's a curious paper, in some parts reading more like a skeptic op-ed than scientific literature. In just a few paragraphs, they hint that human CO2 effect is minor compared to natural greenhouse gases, cast doubt on the surface temperature record, claim global warming stopped in 1988 and invoke water vapor as the most powerful greenhouse gas. These are just minor points on the way to their major conclusion that the sun and cosmic rays are the "main forcing agent in global climate change".

They look at tropospheric and ocean temperature data while ignoring surface air temperature which they say doesn't respond to the solar cycle. This is a surprising claim - Camp & Tung 2007 find a strong 11 year solar cycle signal in global surface temperature records. I discuss the significance of Tung's paper in more detail in Solar cycles and global warming.

However, the real eye opener is when they correlate tropospheric temperature with cosmic rays. The figure below features two graphs. The first graph compares tropospheric temperature (blue) to cosmic rays (red). The second graph removes El Nino, volcanoes and a linear warming trend of 0.14°C per decade. With the warming trend and other "confusions" removed, the negative correlation between cosmic rays and temperature is very high.
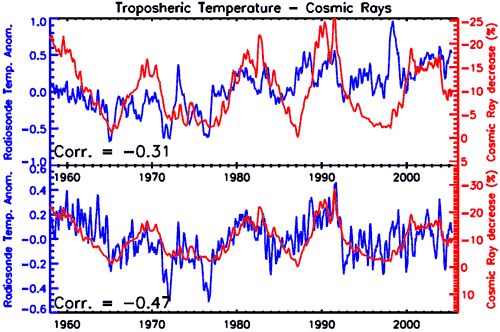
The conclusion is obvious - the warming trend over the past several decades has a source other than cosmic rays. Or another way of looking at it - the long term contribution of cosmic rays to global temperatures has been little to nothing (possibly slightly negative). I'm considering whether to use their graph to further debunk the cosmic rays argument.

Lastly, I fail to understand why most seem to forget Lockwood is only the latest in a long line of studies on the topic. Ammann 2007, Foukal 2006, Scafetta 2006, Usoskin 2005, Haigh 2003, Solanki 2003, Stott 2003, Lean 1999, Waple 1999 and Frolich 1998 all find the sun has contributed minimally to global warming over the last 3 decades (more on the sun). And these are just the studies that focus solely on the sun's role. There are a whole host of detection and attribution studies that factor in solar, volcanic, anthropogenic and other forcings and come to the same conclusion. Those are a topic for a future post.

0 0

Printable Version  |  Link to this page

Comments

Comments 1 to 12:

  1. I can see why you say it reads like an oped but that isn't very distracting. My question is are they wrong? I remember thinking that the Lockwood results seemed strange to me relative to what I knew of the recent history of solar activity.
    0 0
    Response: The oped comment is about as ad hominem as I get (I try to avoid ad hom criticisms which rarely contribute anything useful) - just to register my surprise at the tone of what is meant to be a scientific rebuttal. As for Lockwood, the most controversial element of his paper is that it was even published - generally when you publish a paper, it adds something new to the body of knowledge. Lockwood is covering ground well trod by Ammann 2007, Foukal 2006, Scafetta 2006, Usoskin 2005, Haigh 2003, Solanki 2003, Stott 2003, Lean 1999, Waple 1999 and Frolich 1998 who all find the sun has contributed minimally to global warming over the last 3 decades.
  2. We cannot trust the surface data. Its cherry-picked for the purpose of showing warming and there are so many regions where there is no measurement. The balloon and satelite data correlate with eachother. That means they must be reliable. The satelite data it is. The satelite/balloon data leaves a lot less to explain in terms of divergence from solar activity. The only years to explain anything at all are probably 78 through 2000. The campaign against SO2 could explain some of this. But the real deal to consider is ACCUMULATING AND DECUMULATING energy lodged in the ocean. That solar cycle 23 was not as strong as solar cycle 22 isn't the main point here. For the air temperature to continue to warm solar cycle 23 only had to be strong enough for the ocean to continue to accumulate joules. Plus even if 23 was a tad too weak for accumulation over the long haul (that is to say if that strength of cycle was repeated many times) still the momentum of the oceanic circulation could have kept the ocean (and particularly the Far North) warming for a time before that ocean circulation momentum slowed down. When the solar scientists say that solar irradiance and air temperature move together in lock step.... but then they say that this only worked until 1978 or 1980 it must be remembered that they are not the ones who compiled the tainted surface data. And when they say this you can be pretty sure they are using the tainted surface data and falling over themselves to make a concession to the mob. Such is the pressure in this field. So we can discount this some since the surface record is tainted. In any case while each solar cycle strength is correlated with the air temperature the solar cycle prior is even better correlated. If this was STRICTLY TRUE rather than just a minor observation well then its only natural that the time period FOLLOWING cycle 22 would exhibit the higher air temperature. So it ought not be thought that there is a great deal of an anomaly to explain at all. Even that is not the full story. Its all about accumulating joules in the ocean and the air temperature is only a spin-off of that.
    0 0
  3. "And when they say this you can be pretty sure they are using the tainted surface data and falling over themselves to make a concession to the mob." Yeah, keep using that excuse. Every time quote-mined scientist decides to go on record saying that he _doesn't_ dispute the global warming theory, the denialist immediately claimed he's been threatened in unspecified ways by the Worldwide Satanic Conspiracy headed by Al Gore the Antichrist.
    0 0
  4. Looks like the correlation is somewhat better than for CO2 forcing...so do we throw that out?
    0 0
  5. Mizimi Nothing should be tossed, just put into perspective, the same goes for CO2.
    0 0
  6. Re #4 Mizimi, Perhaps you need to look again and think a bit more carefully. John Cook explains it very straightforwardly in his article and the two graphs of Svensmark and Friis-Christensen rather speak for themselves. i.e. according to Svensmark and Friis-Christensen's analysis presented in the graphs above, changes in the CRF mediated by solar activity have made zero contribution to the warming of the last 30-odd years. If anything the CRF contribution is a slight cooling one.
    0 0
  7. There does not need to be a secular trend in solar activity for solar activity to create warming. It simply has to be high. A constant high level of solar activity (averaged over the 11 yr. cycles) will warm the earth, says 500 million years of the geologic record. This idea that there must be an upward trend in solar activity over a period (like 1975-2004) in order for warming to be explained by solar activity is like saying that you can’t heat a pot of water unless you keep turning the flame up. Having the flame set on high is supposedly not enough. This is a bizarre mistake for people to be making. Have we forgotten that the oceans form a vast heat sink? In terms of climate science, the earth is in effect a big pot of water. For as long as there is reduced cloud cover, if that is the mechanism by which solar-magnetic activity warms the earth, this reduced cloud cover will keep feeding energy into the oceans (both directly, and from air warmed up over the relatively sunny land masses). There does not need to be an ever decreasing level of cloud cover for this to occur. But John is right about one thing. Go look at these papers by supposedly competent scientists and they do indeed look at the wrong derivative. Instead of looking at the zero derivative (level of solar activity) are looking at the first derivative (trend). Here is the last line of Usoskin et. al., 2004:
    Note that the most recent warming trend, since around 1975, has not been considered in the above correlations. During these last 30 years, the solar total irradiance, solar UV irradiance, and cosmic ray flux, has not shown any significant secular trend, so that at least this most recent warming episode must have another source.
    Stupidest thing I ever heard! Well, maybe not given the competition, but it is still up there. The only thing I can figure (other than trying to avoid stepping on AGW toes) is that these eminent scientists somehow forgot that they were talking about a pot of water. Of course a continued high level of GCR/ low-level of cloudiness would continue to feed energy into the oceans. What were they thinking? Well, we know what they were LOOKING AT: the simple correlations, and lagged correlations, between solar activity and temperature. Somehow they let themselves substitute these simple correlations for the physical process itself. Lagged correlation is a little better, but it is still does not model the physical process. It would not be hard to estimate, for each level of global temperature, the level of solar activity that tends to create warming rather than cooling. Then estimate, for each increment of solar activity above this level, how much the rate of warming tends to increase. This could easily be combined with a physical model of the heat storage capacity of the oceans. Fitting such a model to the data would yield a picture over time of the heat store (ocean temperature) and the solar driven additions and subtractions from it. Logically, we would expect to find some periods where solar activity was increasing but the earth was still cooling, because the increase still hadn’t brought the level of solar activity back to the level necessary to create warming. These instances would be misinterpreted as counter-evidence to the sun-temperature link if we were looking at trend instead of level. It’s just obvious that looking at trend is wrong. It doesn’t fit how the world works. We have all the data. It’s just a matter of decomposing it more intelligently. Once we realize that we should be looking at level, not trend, the implications of Svensmark’s graph come into focus. You can see from the close fit between the plot of Galactic Cosmic Radiation and the de-trended temperature curve that there is very little trend in GCR over the second half of the 20th century. The average over the 11 yr cycles was consistently high, what Solanki calls “grand maximum,” or as high as anything seen in the geologic record. That’s why we had warming. The flame was turned up under the pot for sixty years. Why wasn’t warming uniform? The Pacific Decadal Oscillation. Take out the PDO and, as Svensmark’s graph shows, the ups and downs of the 11 yr. solar cycle match the ups and downs in the temperature anomaly. If you want, you can look at Svensmark as graphing de-trended temperature against de-trended GCR (where the GCR trend is essentially zero). What the graph shows is that changes in GCR do a very good job of explaining (statistically) the changes in temperature. From here you can see how John’s interpretation of Svensmark’s graphic is wrong. He thinks that because the ups and downs of GCR perfectly explain de-trended temperature, the trend in temperature must be explained by something else. But the “something else” is the LEVEL of GCR. It’s STILL the cosmic ray flux that is at work. 60 years of relatively cloudless skies kept pumping heat into the oceans (or so the evidence seems to indicate). John has a lot of company in getting this wrong. Usoskin and Solanski got it wrong in their 2004 paper and they are AGW skeptics. Thus apparently this is not a motivated error, but just collective incomprehension of something that ought to be pretty easy to sort out. Dang. Who hasn’t used a stove? My posts here and here, My posts here and here, but they don’t go as far into this particular issue as this comment does.
    0 0
  8. That seems rather illogical to me Alec...it lacks internal consistency and doesn't accord with basic physics. Although the most up to date analyses of solar outputs indicates that variation in solar parameters can have made only rather little contribution to the increase in the earth's temperature anomaly during the last several hundred years, let's assume that the sun has actually been important in the manner that you assert. The major increase in the solar output during the last 100 years was during the period around 1900-1940. We could look at the sunspot numbers as a proxy for solar output: e.g. http://en.wikipedia.org/wiki/Sunspot If we follow the temperature trend, we see that the Earth's temperature trend apparently followed the rise in solar output pretty much immediately: e.g. http://data.giss.nasa.gov/gistemp/graphs/ or: http://www.cru.uea.ac.uk/cru/data/temperature/ So there seems to be rather little "lag" in the response of the Earth's temperature to changes in the solar output. Likewise if one inspects Svensmark and Friis-Christensen's "detrended" solar-cycle-tropospheric temperature comparison (see second panel of John Cook's top article), the detrended tropospheric temperature follows the solar cycle rather faithfully with essentially zero lag (in fact, rather oddly, the temnperature change precedes the solar cycle chnge during the period ~1980-1990!). So there isn't a lag. However you are then proposing a massive lag between a solar contribtion and temperature change to account for the rather large temperature rise since the mid 1970's. However, even in that case your "pot of water" analogy is suspect. If you turn the heat up under a pan of water, the temperature certainly takes a while to reach its new equilibrium (hotter) temperature. However the fastest rate of warming occurs immediately after turning up the heat, and the trend to the new equilibrium temperature follows a hyperbolic time evolution. If you were to stick a thermometer in the pan, you would notice that the temperature doesn't sit unchanged for a long period before starting to rise... So on the one hand you're providing apparent real world evidence for a negligible lag between changing solar output and temperature response (the temperature response to the well-established small increase in solar output between 1900 and 1940-ish), and the (rather dodghy) analysis of Svensmark and Friis-Christensen which also shows essentially zero lag between temperature response to changes in solar output..... ...and on the other hand proposing a physically unrealistic huge lag between a solar change and the onset of a temperature response by reference to a false analogy. Notice btw, that there is pretty much no evidence for a cosmic ray flux (CRF) contribution to persistent changes in the Earth's temperature response. Svensmark and Friis-Christensen present solar cycle contributions...there's no evidence that the effects they purport to display are a consequence of CRF...they are rather more likley to be due to total solar irradiance variations which cycle in perfect (anti) phase with the CRF. Notice also that the link to Shaviv and Veizer is to a rather dodgy hypothetical analysis that is rather horribly flawed. In fact Veizer himself has presented data that essentially fatally sinks the hypothetical relationship between the purported cyclical CRF and temperature, by determining that for a large chunk of supposed CRF cycle, the earth's temperature was varying in the wrong direction and was actually responding in step with the atmospheric CO2 concentration: Came, R.E., J.M. Eiler, J. Veizer et al (2007) Coupling of surface temperatures and atmospheric CO2 concentrations during the Palaeozoic era; Nature 449, 198-202
    0 0
  9. Here... At the page 3 there is a graph with words: “It may be the sun: a strong anti-correlation between intensity and radiosonde temperatures over the past 50 years. Source: Svensmark and Friis-Christensen, 2007.” He only shows the lower part of the graph you have in this page and forgets that the warming trend as well as volcanoes, ENSO and other stuff have been removed. You can even see parts of the numbers of the upper graph since the image is cut without further photoshopping. :D What a douchebag.
    0 0
  10. From http://www.independent.co.uk/environment/climate-change/sun-sets-on-sceptics-case-against-climate-change-1839875.html "Friis-Christensen now accepts that any correlation between sunspots and global warming that he may have identified in the 1991 study has since broken down. There is, he said, a clear "divergence" between the sunspots and global temperatures after 1986, which shows that the present warming period cannot be explained by solar activity alone."
    0 0
    Response: There's more details on how Friis-Christensen came to this conclusion on the Solar Cycle Length page.
  11. I'm new to all this - so still undecided, weighing up the arguments, trying to wrap my head around the science. So help me out here... As i undersatnd it, Svensmark was saying that the Heliosphere has a cycle - it expands and contracts just outside the solar system acting as a filter for cosmic radiation - when it is strong not much CR makes it to the lower atmosphere and when it is weak a lot does make it. this CR acts a cloud seeding catalyst for low level high albedo cloud - which reflects incoming light from the sun back out. so would there be a correlation between cooling and the phases of the heliosphere - and would that be a forcing or is it a feedback? sorry - some of this stuff is confusing for the layman.
    0 0
  12. Mr Cook: Why did you not address the other graphs that were presented in the report (i.e. the sea surface temperature graph and the first tropospheric temperature graph)? Those seemed to have a fairly conclusive correlation as well. In addition, as a side note, the second set of tropospheric graphs was not necessarily created by Svensmark and Friis-Christensen. They are also present in the ISAC (http://www.spacecenter.dk/research/sun-climate/Projects/isac) final report (http://www.spacecenter.dk/research/sun-climate/Projects/resolveuid/6151e93eeb020789ed45ca109ab52346), and that paper does not cite Svensmark and Friis-Christensen's reply to Lockwood and Frohlich.
    0 0

You need to be logged in to post a comment. Login via the left margin or if you're new, register here.


The Consensus Project Website

THE ESCALATOR

(free to republish)


© Copyright 2024 John Cook
Home | Translations | About Us | Privacy | Contact Us