Climate Science Glossary

Term Lookup

Enter a term in the search box to find its definition.

Settings

Use the controls in the far right panel to increase or decrease the number of terms automatically displayed (or to completely turn that feature off).

Term Lookup

Settings


All IPCC definitions taken from Climate Change 2007: The Physical Science Basis. Working Group I Contribution to the Fourth Assessment Report of the Intergovernmental Panel on Climate Change, Annex I, Glossary, pp. 941-954. Cambridge University Press.

Home Arguments Software Resources Comments The Consensus Project Translations About Support

Twitter Facebook YouTube Mastodon MeWe

RSS Posts RSS Comments Email Subscribe


Climate's changed before
It's the sun
It's not bad
There is no consensus
It's cooling
Models are unreliable
Temp record is unreliable
Animals and plants can adapt
It hasn't warmed since 1998
Antarctica is gaining ice
View All Arguments...


Username
Password
New? Register here
Forgot your password?

Latest Posts

Archives

Weather vs Climate: Watch the waves, miss the turning of the tides

Posted on 22 August 2010 by Jim Meador

This post is the Basic version (written by keepingitreal) of the skeptic argument "It's freaking cold".

It's easy to confuse current weather events with long-term climate trends, and hard to understand the difference between weather and climate. It's a bit like being at the beach, trying to figure out if the tide is rising or falling just by watching individual waves roll in and out. The slow change of the tide is masked by the constant churning of the waves.

In a similar way, the normal ups and downs of weather make it hard to see slow changes in climate. To find climate trends you need to look at how weather is changing over a longer time span. Looking at high and low temperature data from recent decades shows that new record highs occur nearly twice as often as new record lows.


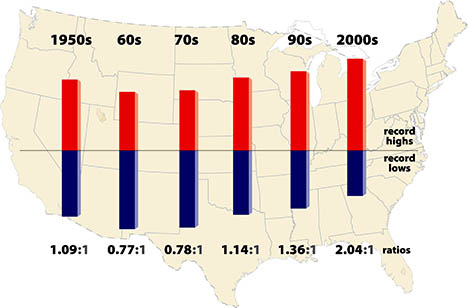
New records for cold weather will continue to be set, but global warming's gradual influence will make them increasingly rare.

Note: we're currently going through the process of writing plain English versions of all the rebuttals to skeptic arguments. It's a big task but many hands make light work. If you're interested in helping with this effort, please contact me.

0 0

Printable Version  |  Link to this page

Comments

Comments 1 to 12:

  1. Now that's a great analogy. I'll definetly use this one.
    0 0
  2. Are those highs and lows for stations worldwide? In the US only? The graphic has a map of the US as its background ... Might be helpful to include a link to the source of the graphic.
    0 0
    Response: It is US only. The paper it comes from is Meehle 2009. It's referenced in the intermediate rebuttal - we're still mulling over how much detail to include in the basic version - whether to include references or just link to the intermediate version for all the nitty gritty details.
  3. You've immediately confused the issue. Firstly you correctly state that to determine trends in climate, the changes in weather needs to be looked at over a long time span, then immediately provide a graph that uses the last 3 decades to support it. Three decades is far from long enough in determining either weather or climate trends when weather cycles have been identified where the rise and fall of the tides in a manner of speaking, takes 6 or 7 decades to complete both phases, in and out as it were, and reconstruction of El-Nino events indicate that perhaps any changes in the "tidal" frequency of them needs to be considered in terms of centuries. However, identifying any trends will always be the easy part, understanding what any trends and cycles mean and why they occur is the hard part. The tide analogy gives opportunity to consider whether the forces that drive the tides that affect even very small bodies of water, has what affect on the moisture suspended in the atmosphere?
    0 0
  4. #3: "Three decades is far from long enough in determining either weather or climate trends" OK, so look at a longer time span: This was made from a recent GISSTemp release going back to 1880. The plateaus represent each time a new high or low (in the temperature anomaly) is set. Hot summers (JJA average) continue getting hotter, but summertime lows don't get any lower; winter (DJF average) record lows don't get any lower than the -0.62 deg C anomaly from 1893.
    0 0
  5. The first problem is that records are usually 5C to 10C or more above normal so are caused by weather, not CO2 warming (1C with WV, 0.2 or so without). The second problem is that the records in the chart above were not adjusted for UHIE (it was not mentioned in the paper). Third problem is the chart is U.S. only, too easily influenced by pacific ocean cycles which can result in extremes.
    0 0
  6. #5: "records are usually 5C to 10C or more above normal so are caused by weather, not CO2 warming" This is a persistent pattern of setting records and hence not weather. Long term trend... increasing CO2? "records in the chart above were not adjusted for UHIE" We've heard that one numerous times. Satellite data show similar temperatures; is there also UHI in satellite data? "too easily influenced by pacific ocean cycles" If ocean cycles were a factor, 1998 would stand out like a sore thumb. Yet it is part of the whole. So that 'problem' won't fly either.
    0 0
  7. Your first point may be valid. ON the second, AFAIK, satellites don't measure record temperatures, just averages. If you have a study showing otherwise, please post it. Averages on the surface are adjusted for UHIE, records are not. On 1998, the state record high temperatures peaked at 19 ( http://hallofrecord.blogspot.com/2007/03/us-extreme-temperatures-update.html) Since state records are often set at smaller stations, they are more immune to UHIE. Hence there are far more standing state records from the 1930's than any other decade.
    0 0
  8. Muoncounter, nice graph. I used the same data to run the numbers for 'hottest winter' and found similar results; New record high Winter anomalies were set in: 1882, 1889, 1901, 1914, 1926, 1944, 1980, 1981, 1983, 1988, 1995, 1998, 2002, and 2007. The data clearly indicate that new global record highs are being set with increasing frequency while there hasn't been a new global record low in nearly a century. As to UHI. No study showing that it has skewed temperature records has ever even been WRITTEN... let alone then stood up to scrutiny. Numerous studies of satellite, proxy, and non-urban temperature records have all shown results consistent with the established temperature series. In short, about the only thing which the UHI argument brings to the table is an easy way to identify people who are willing to take a claim with no substantiating data whatsoever as an excuse to ignore overwhelming evidence to the contrary.
    0 0
  9. The UHI effect on record temperatures is very real, see http://www.hindawi.com/journals/amet/2010/230365.html for example. I read a study a few years ago (unfortunately cannot locate) where the author did consider the UHIE and determined that the upward trend in high temperature records was larger than could be accounted for by UHIE (that made sense to me). My question is to what extent the chart in the head post is affected by UHIE. The author did not mention it in his paper.
    0 0
  10. I remember reading a text on physical climatology a comparison aimed at representing the temporal dimensions of climate and climate change thus conceived: Suppose that the climate is represented by a natural forest and man is an ant. A natural forest is usually composed of areas where the plants are denser and some clearings, then to the edge of the forest clearings are increasingly extended until the wood ceases. Imagine that the ant is on its way through the forest and try to figure out where it ends. Whenever the vegetation thins out and is a grassy bushes or an open space the ant will be led to believe she get to the forest’s end. The same thing would happen to us if we wanted to assess climate change of the Earth with the lifespan we cross and judging the climate change on the basis of our "time meter”
    0 0
  11. Iciattaglia, we all know that. Noone thinks that the earth itself is in danger of expiring. The climate change that concerns us is this climate and its stability. This climate phase has allowed humans to thrive and flourish because it suits the temperature range we can live in comfortably and it suits the kind of plants that sustain life. Our kind of abundant life, not the kind of life that just survives in ice or fire or sitting atop an undersea volcano. Your argument is about geology and time frames of many millions of years. We're concerned about biology and timeframes of centuries or millennia.
    0 0
  12. Adelady,I wanted simply to suggest that our lifespan ( or what we remember of the past) is not the correct meter for interpreting the meteorological episodes as a proof of the climate change…. My post had the intention to support the previous one (posted by keepingitreal) on waves and tides.
    0 0

You need to be logged in to post a comment. Login via the left margin or if you're new, register here.


The Consensus Project Website

THE ESCALATOR

(free to republish)


© Copyright 2024 John Cook
Home | Translations | About Us | Privacy | Contact Us