


 Arguments


Do high levels of CO2 in the past contradict the warming effect of CO2?
What the science says...
| Select a level... |
 Basic
Basic
|
 Intermediate
| |||
|
Climate and CO2 levels have always varied together. During past ice ages CO2 levels were low, and during warm periods CO2 was higher. The rock “weathering thermostat” prevents a runaway climate on very long timescales. |
|||||
Climate Myth...
CO2 was higher in the past
"The killer proof that CO2 does not drive climate is to be found during the Ordovician- Silurian and the Jurassic-Cretaceous periods when CO2 levels were greater than 4000 ppmv (parts per million by volume) and about 2000 ppmv respectively. If the IPCC theory is correct there should have been runaway greenhouse induced global warming during these periods but instead there was glaciation."
(The Lavoisier Group)
Climate closely matches CO2 throughout the geological record
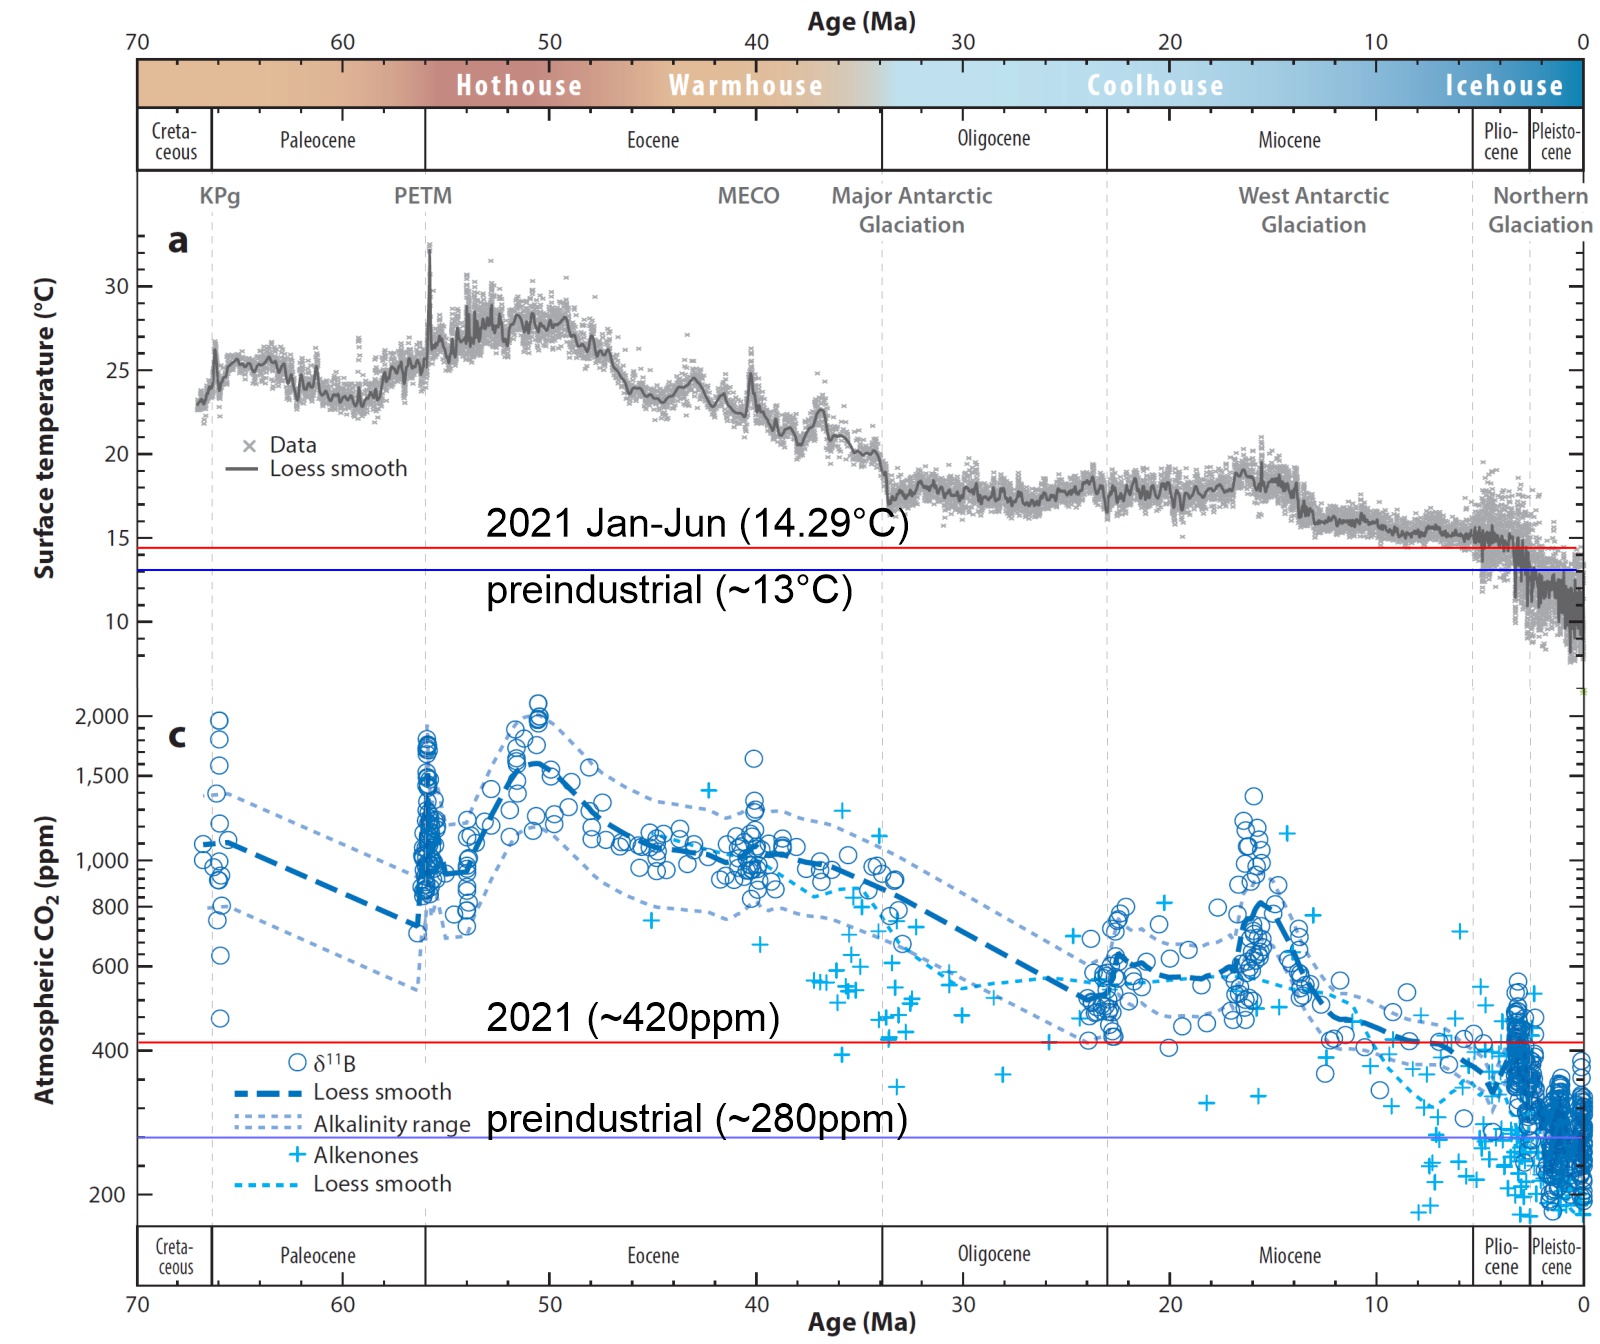
Figure 1: Temperature (top) and CO2 (bottom) for the last 66 million years, showing preindustrial & 2021 temperature & CO2. Ma = million years ago. Redrawn from Rae et al. 2021, with annotations added: 2021 CO2 per CO2.Earth, preindustrial CO2 per climate.gov, 2021 absolute temperature per NOAA Global Climate Report for June 2021 anomaly above 20th century average of 13.5ºC, preindustrial absolute temperature per Berkeley Earth 2020 anomaly of 1.27 above preindustrial.
There is strong correspondence between global temperature and CO2 throughout the geological record, as shown in the figure above for the last 66 million years. For a figure covering the last 420 million years click on the basic tab of this rebuttal.
During ice ages, CO2 levels were low, and during warm periods CO2 was higher. In the Eocene, for example, there were no polar ice caps, temperatures were about 10ºC hotter than the 20th century, and CO2 was about 1,500ppm (Westerhold et al. 2020, Rae et al. 2021). During the last Ice Age, CO2 varied between about 180 and 300ppm as ice sheets waxed and waned with orbital wobbles (Rae et al. 2021, and see this explainer by Hausfather 2020). CO2 was at similar levels during the Paleozoic Ice Age, 340-290 million years ago (Foster et al. 2017).
Early attempts to estimate CO2 for that long ago in Earth’s past were broad-brush and very uncertain (eg Royer 2006), leading to the high CO2 estimates referred to in the myth. New data and refined techniques have since clarified the picture considerably (eg Foster et al. 2017, Cui et al. 2020, Stewart et al. 2020). The 2006 estimates, for example, averaged data across 10-million-year timesteps, the 2017 data reduced the averaging timesteps to 0.5 million years, and the 2021 figure above doesn’t average into timesteps, but instead fits a curve through underlying data at the actual dates the samples formed.
Similarly, the uncertainty in CO2 and temperatures of past climates varies with the technique and the age and condition of the samples, but an increasing menu of techniques, refinements to those techniques, and ever-increasing number of samples through geological time and across the globe now allows these paleoclimate data to be a useful reality check for climate models (Tierney et al. 2020, IPCC 2021). The uncertainty of CO2 in the 2006 compilation, for example, was up to +/- 1800ppm, but in the 2021 compilation in the figure above it is +/- about 300ppm at worst, and temperature data for the last 66 million years are now fine enough to show the temperature oscillations caused by orbital wobbles throughout that time (Westerhold et al. 2020).
Ordovician data are still quite uncertain but they indicate CO2 was about 8 times preindustrial, about 2,400ppm, or perhaps less than that, and then CO2 levels fell below those levels in the Hirnantian Glaciation (Ice Age), 445 million years ago (Pancost et al. 2013). The continents were configured very differently then, and the sun was about 4% less bright, allowing an ice age at higher CO2 levels than possible today (Scotese 2021, Kopp 2016).
The 134 million year time span of the Jurassic and Cretaceous had several hothouse episodes and several cooler episodes, with CO2 varying from about 600ppm to about 1500ppm accordingly, but it was not a time of glaciation (Witkowski et al. 2018). In the last 420 million years, the highest steady-state CO2 values of about 2,000ppm were reached during the Devonian (~400 million years ago) and in the Triassic (220–200 million years ago) (Foster et al. 2017).
CO2 shocks
CO2 jumped to higher levels in specific, geologically-abrupt (over tens to hundreds of millennia) warming events associated with massive output of volcanic CO2 and metamorphic methane from Large Igneous Provinces. These sometimes triggered mass extinctions, such as at the end-Permian (when CO2 rose from about 420ppm to about 2,500ppm in roughly 75,000 years (Wu et al. 2021), the end-Triassic, Toarcian, and similar events like the PETM (56 million years ago when CO2 rose from about 900ppm to about 2,200ppm over some 50,000 years and temperatures rose about 5ºC (Gutjahr et al. 2017).
Analysis of past abrupt climate changes finds that major mass extinctions happen when the climate warms (or cools) by more than 5.2ºC at a rate that exceeds 10ºC per million years (Song et al. 2021).
Preventing a runaway climate – the rock weathering thermostat
Earth’s long-term climate (over millions of years) is governed by the balance between CO2 emitted into the atmosphere by volcanoes, and CO2 removed from the atmosphere by weathering of rocks (Kasting 2019). These chemical reactions speed up in warmer climates, removing more carbon from the atmosphere and preventing long-term runaway warming (a negative feedback). Conversely, the reactions slow in cooler temperatures, reducing CO2-removal from the atmosphere, generally preventing runaway cooling.
This “weathering thermostat” has kept Earth’s climate habitable for 4 billion years, but it works on about a hundred-thousand-year timeframe, so it can be outpaced by abrupt greenhouse gas releases (e.g. end-Permian mass extinction, see above), or removals (e.g. “snowball Earth” episodes, see below).
Weird early Earth climates
Earth’s atmosphere has evolved through deep time, and some of those changes early in Earth’s history triggered dramatic climate shifts.
Snowball Earth episodes 717, 640 and 580 million years ago
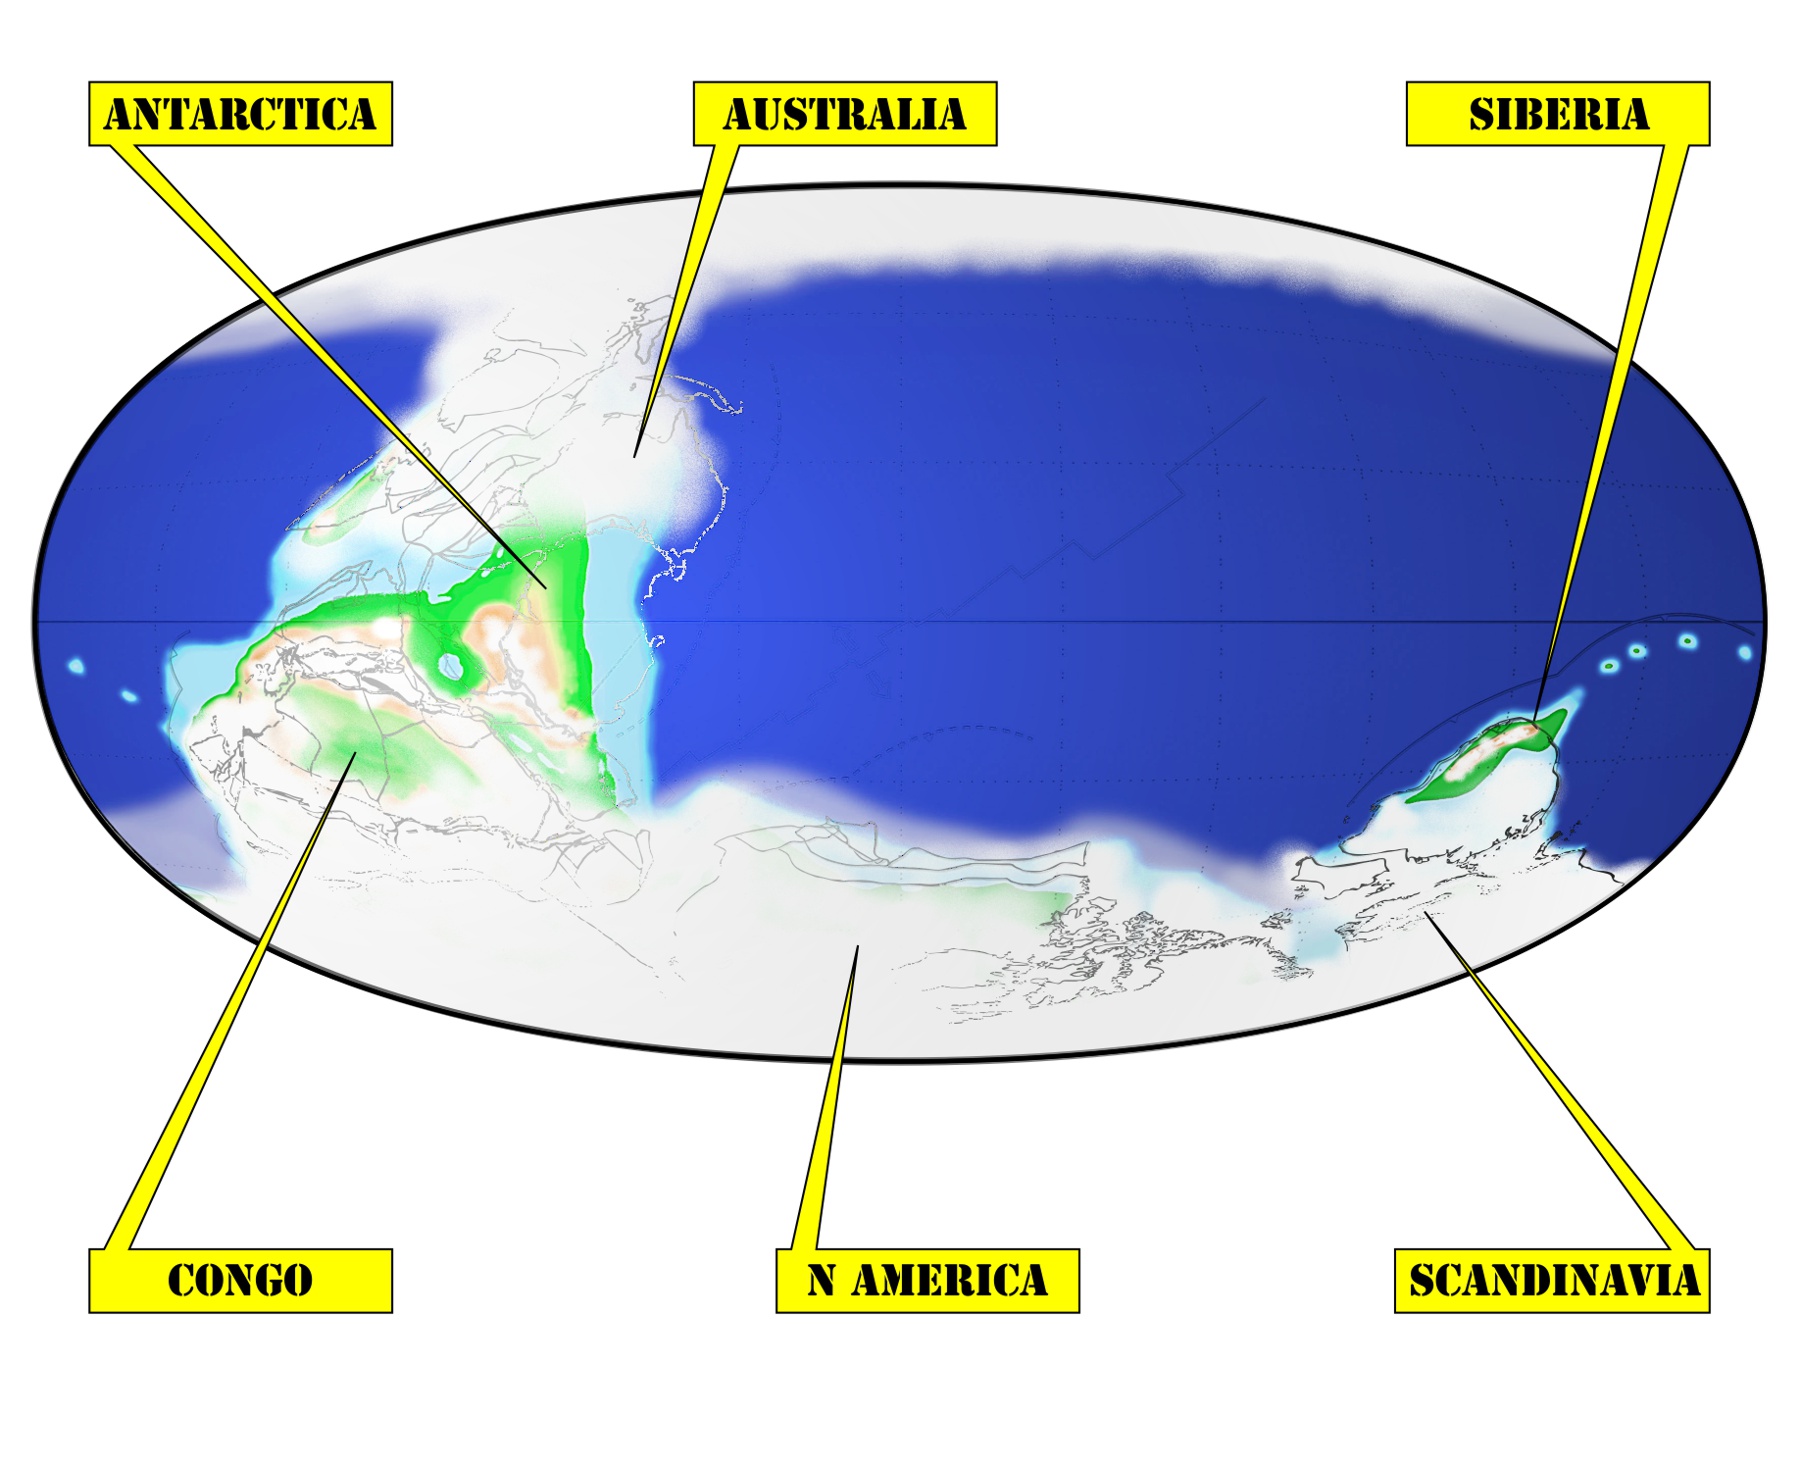
Figure 2: Map of “Snowball Earth” about 640 million years ago. Modified with permission from Scotese 2009.
717 million years ago our planet froze into a “Snowball Earth,” blanketing even the tropics with ice for more than 55 million years (Rooney et al. 2015). It happened again around 640-635 million years ago, and again, less severely, 580 million years ago (Pu et al. 2016). The timing coincides with the evolution and diversification of non-microscopic marine life, suggesting that an enhanced biological carbon pump causing more efficient removal of atmospheric CO2 is a plausible explanation (Lenton et al. 2014).
While Earth was ice-bound, the white planet reflected more of the sun’s energy back into space, making it hard to reverse the cold climate, even with high CO2 levels. But the near-global ice cover also shut down the weathering thermostat, which allowed volcanic CO2 to build to perhaps 100 times preindustrial levels, even though the climate was still cold in this special case (Hoffman et al. 2017). Eventually the air warmed enough to melt the ice and the weathering thermostat kicked back in, removing much of the atmospheric CO2 and depositing it in thick “cap carbonate” rock layers that mark the termination of these global glacial climates (Yu et al. 2020).
Great Oxidation Event Snowball Earth about 2.4 billion years ago
When oxygen began to build up in Earth’s atmosphere about 2.4 billion years ago, it reacted with methane, the main greenhouse gas at the time, triggering “Snowball” global glaciations similar to those described above (Warke et al. 2020).
Climate changes even deeper in time
There’s geological evidence for episodes of cold climate 3.5, 2.9, and 2.7 billion years ago punctuating an otherwise moderate climate (Catling & Zahnle 2020). At least one of those episodes has been linked to atmospheric destabilization by the evolution of methanogenic microbes (Wordsworth & Pierrehumbert 2013).
Faint Young Sun Paradox
The Sun has brightened by 30% since the birth of the solar system, so we might expect Earth to have been frozen solid for the first 2 billion years, but it wasn’t (Wang & Shen 2019). This is a paradox because the atmosphere wasn’t much denser than today (Som et al. 2016). The explanation is likely some combination of less land erosion, clearer skies, a shorter day, “reverse weathering” of ocean seafloor, and a peculiar atmospheric composition before Earth had an oxygen-rich atmosphere (Charney et al. 2013, Rosing et al. 2010, Spalding & Fischer 2019, Catling & Zahnle 2020). Some scientists have therefore declared the Faint Young Sun Paradox essentially “solved” (Charnay et al. 2020).
The rock weathering thermostat has compensated for the brightening sun over time by reducing the long-term, average CO2 concentration in the atmosphere by about 3.4ppm per million years (Foster et al. 2017).
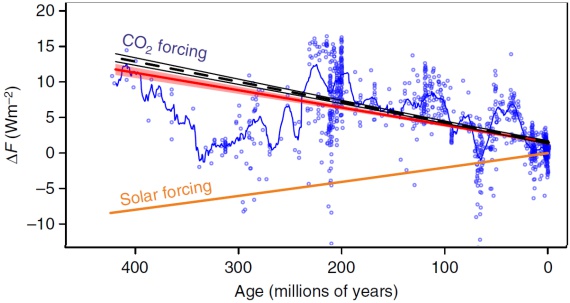
Figure 3: As the sun has brightened, long-term average CO2 levels have reduced as a result of the temperature-sensitive rock weathering thermostat. Redrawn from Foster et al. 2017. Y axis = change in radiative Forcing (watts per meter squared) where 0 = preindustrial. Blue = Forcing by CO2 and LOESS best fit line; black dashed line = least squares linear fit to CO2 forcing; orange= solar forcing; red = linear best fit for combined solar and CO2 forcing
Non-CO2 drivers of climate change
CO2 is the principal ‘control knob’ of climate because it is a long-lived, non-condensing gas (unlike water vapor) and because it both responds to temperature (for example in the ice ages) and also controls long-term climates (Rae et al. 2021, Lacis et al. 2010), but it isn’t the only driver of climate. Below is a very brief overview of other long-term climate drivers, but you will notice many also affect CO2 levels.
Plate tectonics – Plate tectonics is the main driver of climate change on multi-million-year timeframes. It created the warm climate enjoyed by the dinosaurs and the cooler climate in which our ancestors evolved. Plate tectonics controls the long-term climate by altering the fine balance between the CO2 emitted into the atmosphere by volcanoes, and the CO2 removed from the atmosphere by rock weathering and carbon burial (Kump 2016). For example, when plate tectonics pushes up mountains, particularly if they are in the humid tropics, CO2 drawdown increases, cooling the climate (Park et al. 2020, Mitchell et al. 2021). Plate tectonics can also amalgamate supercontinents near the poles with mountains above the snow line that collect ice caps, as happened in the Late Paleozoic ice age (Isbell et al. 2012).
Plate tectonics also reconfigures ocean currents, such as the Antarctic Circumpolar Current (ACC) that began around 36 million years ago when Australia and South America moved away from Antarctica (Sarkar 2019). The ACC may have enhanced the removal of CO2 from the atmosphere, which led to the glaciation of Antarctica (Lauretano et al. 2021). The closure of the Isthmus of Panama is similarly thought to have played a role in triggering Northern Hemisphere glaciation around 2.7 million years ago (Ögretmen et al. 2020).
Solar cycles - Changes in solar activity have at most a tiny effect on climate. The Maunder Minimum between 1645 and 1715 was once thought to have caused the “Little Ice Age,” but it was too small and was mistimed to explain most of that cooling, which was instead largely driven by volcanic sulfur and land use changes (Owens et al. 2017). The sun has been dimming slightly for the last half-century as the Earth warmed, so modern warming cannot be blamed on the sun (NASA 2020).
Volcanic sulfur – Sulfur from volcanoes (as distinct from CO2) has the ability to cool the climate for months to a few years if it reaches the stratosphere. The eruption of Pinatubo in 1991, for example, cooled the global climate by 0.6ºC for 15 months, and was accompanied by a sharp decline in the growth of CO2 levels (NASA 2011, Angert et al. 2004).
Orbital wobbles (Milankovitch cycles) – Wobbles in Earth’s orbit affect the climate on timescales of 10,000 years or more, and operate in well-defined cycles that can be calculated precisely millions of years into the past. For more see this NASA explainer (Buis 2020). CO2 has closely tracked and amplified the climatic effects of orbital wobbles (Hausfather 2020).
Land cover changes (brightness or “albedo” changes) – Since tree cover is relatively dark, but ice, bare rock, and sand are relatively bright, changes in the distribution of these can alter the solar energy reflected back into space , warming or cooling the climate (Perkins 2019). Land vegetation changes also affect the climate by altering the flow of water and greenhouse gases between the land and air (USGCRP 2017).
Brightening Sun (the Faint Young Sun Paradox) – Our sun’s luminosity (brightness) has increased steadily by about 30% since the early years of the solar system, but this has not been matched by climate warming. That’s because, as the sun brightened, long-term average CO2 reduced by about 3.4ppm per million years, due to the rock weathering thermostat (see above) (Foster et al. 2017).
Evolution of new life forms – Innovations of life such as the evolution of methanogenic microbes, of cyanobacteria, of eukaryotic algae, and of land plants, are the likely causes of glacial episodes on each of those occasions through their effect on the atmosphere, ocean, or rock weathering, and consequent changes in greenhouse gas levels (Wordsworth & Pierrehumbert 2013, Warke et al. 2020, Lenton et al. 2014, Dahl & Arens 2020). In a different way, the evolution of calcifying plankton in the Mesozoic has somewhat stabilized the long-term climate system by increasing the ocean’s ability to buffer big CO2 changes over multi-millennial timeframes (Ridgwell 2005).
Asteroid impacts – Asteroid/comet impacts generally don’t seem to have had much effect on climate (Bond & Grasby 2017), perhaps because their effects were too brief to be captured in the rock record. The notable exception is the Chicxulub impact blamed for the extinction of the dinosaurs and much else. Dust and sulfur from the impact is estimated to have cooled Earth by more than 20ºC and acidified oceans (Artemieva et al. 2017, Henehan et al. 2019). The planet took centuries to return to its pre-impact temperature, only to warm by 5ºC due to CO2 in the atmosphere from vaporized limestone (MacLeod et al. 2018).
Large Igneous Provinces – LIPs are rare, gargantuan volcanic phenomena that emit large volumes of CO2, methane, and a variety of other pollutants. Abrupt climate changes and mass extinctions coincided with several of them (see CO2 shocks above) (Bond & Grasby 2017).
Other greenhouse gases - Gases like methane and nitrous oxide probably played a role in past climates but it’s hard to pin down their contribution since there are currently no “proxy” records of their past concentrations. Methane was probably a feedback in past warming events, but since it is oxidized to CO2 after 12 years on average, it is equivalent to CO2 on geological timescales (Inglis et al. 2020, EPA 2021).
Last updated on 1 September 2021 by howardlee. View Archives


Wow. This topic just came up in the current Greenland melting discussion (#52) so I spent a few minutes looking at denial sites. Widespread indeed is the notion that very high CO2 in geologic past coincided with glaciation and that somehow negates today's relatively paltry 370 ppm CO2. Graphs like this abound: — from the "Frontiers of Freedom" website. There are a couple of very straight-forward holes in these denialist arguments. 1. Ordovician CO2 over 4000 ppm and glaciation proves CO2 doesn't matter! Nope: Look at the distribution of continental landmasses of the Ordovician (~450 MY). Those "glaciers" were the south-polar ice cap. There wasn't much in the way of land in the northern hemisphere. 2. Warming and cooling is purely cyclical! CO2 variation is natural! Sure, there are natural cycles. But something very important and very obvious changed over the geologic time scales involved that makes such simple comparison irrelevant: Plants. Lots of plants. Gymnosperms (conifers etc) originated in the late Devonian-early Carboniferous (380-300 Mya) and angiosperms (flowering plants) in the Cretaceous (100 Mya). All that carbon in the Carboniferous coalbeds? Dead plants that took CO2 out of the atmosphere. The downward trend apparent in the graph above from the Cretaceous forward? More plants. And now we've turned the downward CO2 trend around despite a world rich in plants... maybe we can hope that a whole new class of plant life comes to our rescue... but that would require evolution and the science is still uncertain on that too.