


 Arguments


CO2 is the main driver of climate change
What the science says...
| Select a level... |
 Basic
Basic
|
 Intermediate
| |||
|
Theory, models and direct measurement confirm CO2 is currently the main driver of climate change. |
|||||
Climate Myth...
CO2 is not the only driver of climate
I don’t “deny” climate change or global warming, it is clear to me that the Earth has warmed slightly in the last century, this is indisputable. I also believe that increasing amounts of CO2 in Earths atmosphere are a component of that warming, but that CO2 is not the only driver of climate as some would have us believe. However, what is in dispute (and being addressed by mainstream climate science) is climate sensitivity to CO2 as well as the hiatus in global warming, also known as “the pause”. Since I embrace the idea of warming and that CO2 is a factor, along with other drivers including natural variability, the label “denier” is being applied purely for the denigration value, and does not accurately reflect my position on climate. (Anthony Watts, May 2015)
At a glance
It may come as a surprise to some people unfamiliar with climate science, but tracking down anyone who actually said, "CO2 is the only driver of climate change", has proved most elusive. Thus, the idea that, "CO2 is not the only driver of climate as some would have us believe.", is lacking something rather important. Who actually said it?
In climate science, nobody ever said it. That's because climate science covers everything that affects the climate. If you don't include everything, it would be like trying to find out how an internal combustion engine-powered car works, using as an example one without a crankshaft. The talking-point looks more like an example of a straw man fallacy, in which an argument, claim, or opponent is invented, and then shot down in flames, point-scoring being the idea. One sees this a lot in politics, but not in science.
Through science, we know that Earth's climate is affected by a myriad of drivers that operate on timescales varying from seasons to tens of thousands to tens of millions of years. We've investigated them in depth and we continue to do so. We understand which ones act as 'radiative forcings' - the external, independent primary drivers that determine whether energy is being added to or removed from the system. We likewise understand which ones act as 'feedbacks' - secondary drivers that determine how energy is moved around within the system.
The very nature of science is that it is an ongoing self-correcting process in each and every discipline. So we do understand the key forcings and feedbacks that operate within our climate and on what time-scale they occur. CO2, along with the other greenhouse gases, is but one of these factors.
Before you get too relaxed, however, of all the variables out there, CO2 is the one that has seen a huge change. Since pre-industrial times its concentration has gone up by a whopping 50%. Just imagine if a change of that amount occurred with another part of the climate system. How about the strength of sunlight going up by 50%?
Ironically, at the time of writing (early 2024), there is a lot of discussion as to why 2023 was so warm. The heat came on particularly in the second half of the year, coinciding with the onset of strong El Nino conditions in the Pacific Ocean. But normally there's a lag between El Nino starting up and peak temperatures. Did the injection of unusual amounts of water vapour into the upper atmosphere by the Hunga Tonga-Hunga Ha'apai volcano have a hand? Possibly. Did the cleaning-up of sulphate aerosol-generating shipping fuels partially remove a well-known negative or cooling feedback, and if so by how much?
The trouble is that scientific investigations involve a lot of careful hard work and that takes a lot of time. For people more used to the instant answers of politicians, that might be disappointing, but there's a difference. Science requires evidence, politics less so.
Please use this form to provide feedback about this new "At a glance" section. Read a more technical version below or dig deeper via the tabs above!
Further details
If you have read the at-a-glance section, you will have already realised that the myth that some climate scientist said, "CO2 is the only driver of climate change", is a good example of a straw man fallacy in which an argument, claim, or opponent is invented, and then shot down in flames. But for completeness, let's take a quick look at some other drivers of Earth's climate system.
Natural processes have determined Earth’s climatic history for its 4.56 billion year long existence. However, right at the very end of that time-line, humans have come along and deliberately brought significant change to one mechanism that is driving Earth’s climate into the future.
At any given time, the Earth’s climate is subjected to a myriad of natural climate forcing and feedback processes. The impact of each varies with the magnitude of the natural change. It varies with the duration over which the change occurs and whether or not that change is part of an overall repeated cycle. Cyclic variations tend to cancel themselves out over time. However, remember that time may be orders of magnitude greater than a human lifespan.
Processes that have historically altered the face of the planet include things like cycles in the Earth’s orbit around the Sun or shifts in the planet's tectonic plates. Orbital cycles are potent enough to trigger periods of glaciation in the current Icehouse climate state on Earth. They can also bring us back out of ice-ages, with the help of amplifying climate feedbacks. These large changes take place over tens of thousands of years.
Plate tectonics rearranges continents. It brings them to collision, throwing up mountain ranges. Or it rifts them apart, creating new oceans in the process. But these changes are very slow. Tectonic plates, at their fastest, only move at the same rate at which human fingernails grow, Such geographical rearrangements typically occur over millions of years.
While not nearly as dramatic, the influence of solar, ocean and wind patterns is much more immediate. The El Nino Southern Oscillation (ENSO) is a good example. But the warm phase - El Nino - has a cool counterpart - La Nina. These phenomena swing between warming and cooling respectively, over the course of months to years. So they roughly cancel one another's effects out. Having said that, there are decades during which La Nina or El Nino has been predominant, such as the period from 2000-2012, once popularly referred to by climate science deniers as 'the pause'. All consigned to the dustbin of history now, of course. ENSO involves heat being moved around within the climate system. In a La Nina-dominated decade, that heat is mostly going into the oceans. That's what actually happened in 2000-2012.
Volcanic eruptions and impacts from celestial bodies such as asteroids have a near-instant effect. Luckily though, very few of these one-off events are of sufficient size to impact the global climate for more than a few years. That was not always the case in the deep past, which is why we invest in monitoring such things carefully.
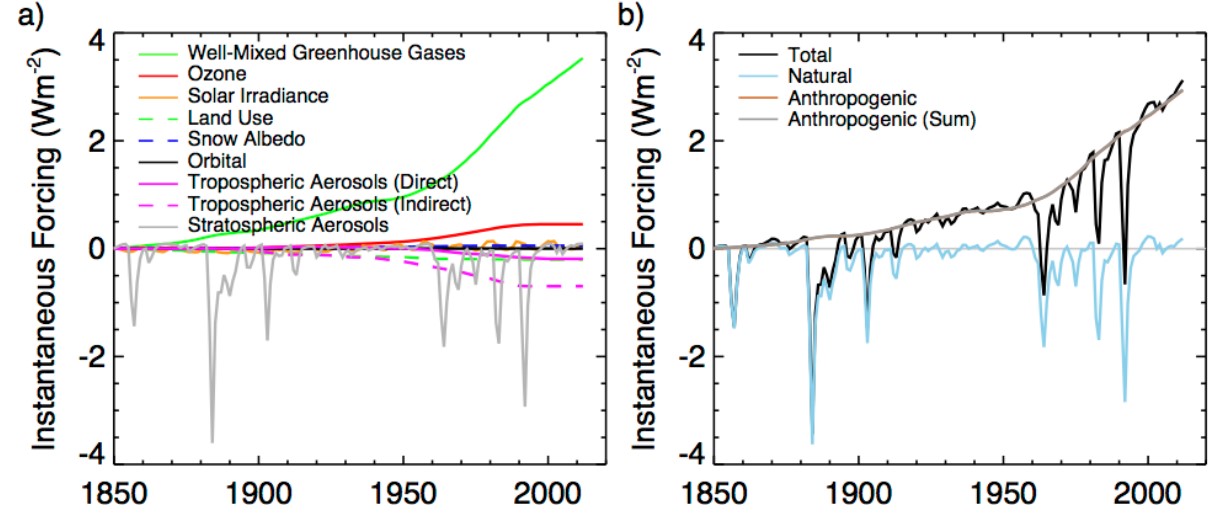
Fig. 1: Instantaneous radiative forcing at the tropopause (W/m2) in the E2-R NINT ensemble. (a) Individual forcings and (b) Total forcing, along with the separate sums of natural (solar, volcanic and orbital) and anthropogenic forcings. Source: GISS.
The industrially-driven increase in CO2 and other greenhouse gases to the atmosphere profoundly differs from such natural processes. This human influence is happening very rapidly (fig. 1). It is not cyclical and it pushes the climate continually and relentlessly in the single direction of warming. And we know we are doing it.
No other species has done this intentionally. The cyanobacteria that oxygenated Earth's atmosphere, starting around 2,450 million years ago, did cause major climatic change as a side-effect. However, nobody can seriously accuse them of having done it on purpose.
Other human-related factors need to be considered too. They include changes in land use, emissions of carbon soot and aerosols. These are all likewise studied individually. However, their net impact is cumulative. Likewise, over the last 50 years of satellite observations of the Earth’s climate, all natural influences have been studied in detail. These include orbital variations, solar output, volcanic activity and changes in both surface and cloud-top albedo. Oceanic fluctuations such as ENSO and the Pacific Decadal Oscillation (PDO) have likewise been tracked as they vary back-and-forth through time.
Natural processes will continue to introduce short term variability in our climate. However, the relentless rise of CO2, now 50% up on pre-industrial levels, has become the dominant factor in determining our planet’s climate now and in the years to come. Other factors like those mentioned above will manifest from time to time over the short term: warmer and cooler years, sometimes singly, sometimes in clusters. These form the irregular noise on temperature graphs (fig. 2) and Realclimate has an interesting recent discussion on the record-breaking 2023 and the factors responsible here. But the bottom line is that all of the graphs show that same long term trend. Upward.
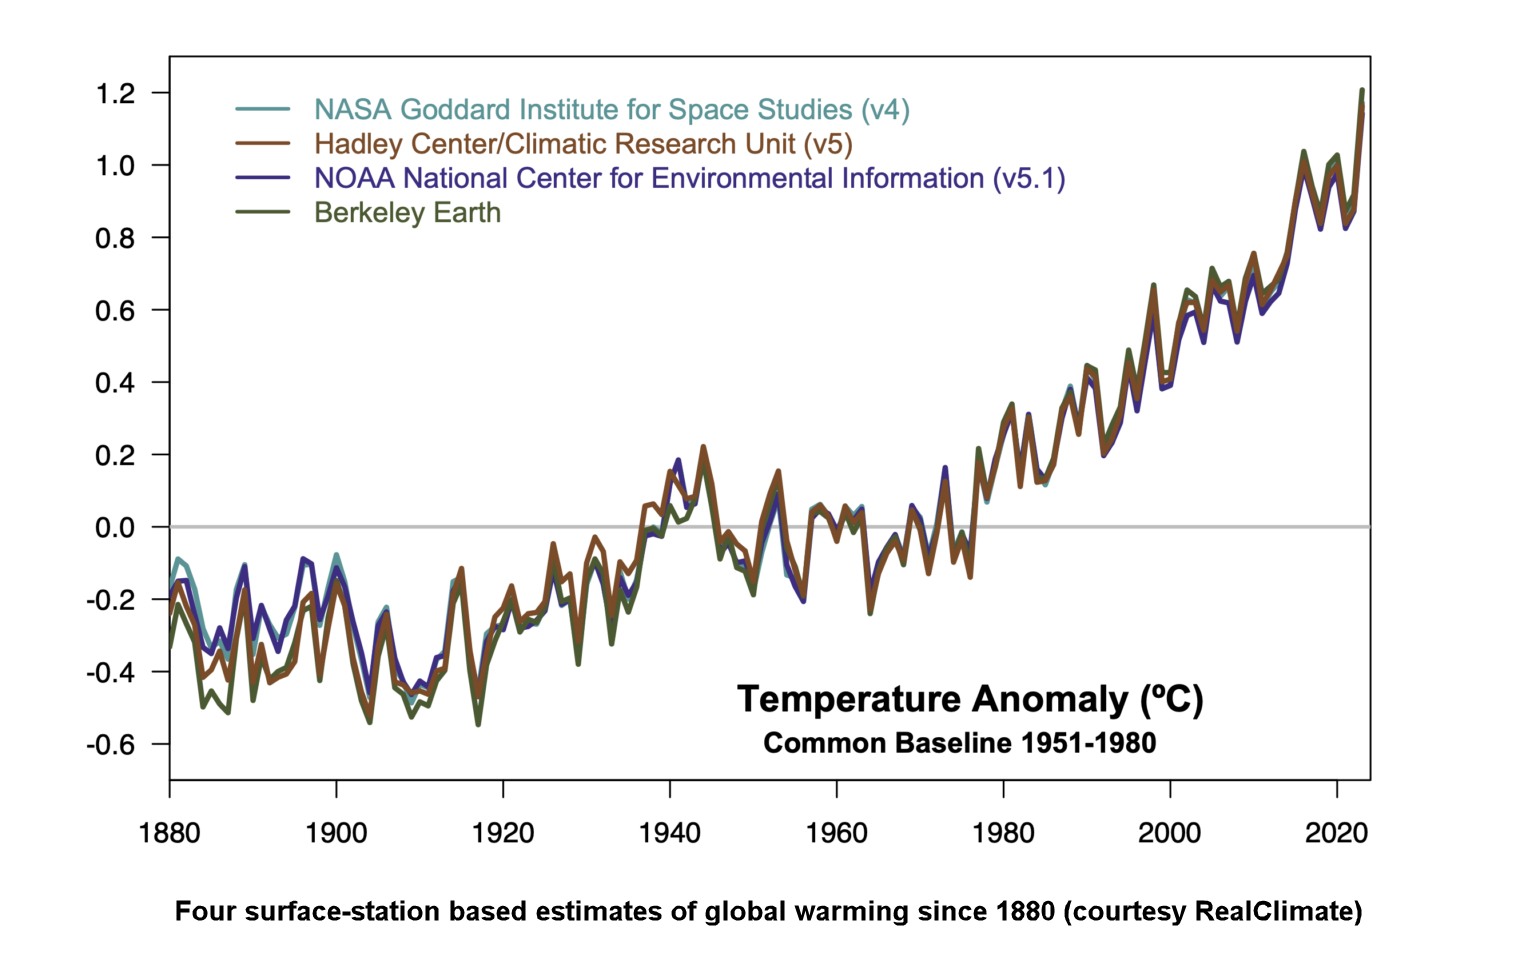
Fig. 2: up and up. Graphic: RealClimate.
Last updated on 26 May 2024 by John Mason. View Archives


Separate global climate forcings relative to their 1880 values (GISS).
In the rediative forcing graph it shows "well-mixed greenhouse gases". Is there a breakout of CO2, H2O, methane etc to show the relative importanct to the effect?
and a related question, when we burn a fuel we get CO2 and H2O in a 3:4 ratio (typical). Since H2O is a more potent green house gas why all the hupla on CO2 and not the incresed H2O?
[TD] Water vapor's concentration in the atmosphere is limited by temperature. Putting more water vapor into the air than the air's temperature will support causes the excess water to drop out in about 10 days. Therefore water vapor is a feedback to temperature increase, not a forcing. See the rebuttal to the myth Water Vapor is the Most Powerful Greenhouse Gas.
roosaw... Here's the RF chart from IPCC AR5 that has them broken out...
Reply to likeithot from here.
Thank you for responding. Now what climate science actually states is that climate will respond to the net effect of all forcings. A huge amount of climate science also goes into understanding the internal variability that is inevitable when you unevenly heat an ocean-covered planet. Unfortunately, important processes (especially ENSO) for determining surface temperature defy predictive modelling. So, to quote the modellers - "climate models have no skill at decadal level prediction".
Given these constraints, and the multiple forcings at work in climate, what then do you think the data should like that would convince you that the attribution to CO2 is accurate?
If you are stumped, then perhaps you should read the IPCC WG1 chapter on attribution to see the approaches that have been done so far.
One very important consideration to think about is that while surface temperature has a very high degree of variability, you do expect total ocean heat content to vary a great deal less in response to a constant forcing.
And as an aside, if you dont want to have your comment moderated, then try reading and complying with the comments policy. If you want to bluster with uninformed rhetoric, then there plenty of sites on the internet that will welcome your comments. If you want to discuss the science, then welcome, and please study what the science says so we can have an informed discussion.
likeithot wrote: "...for me to "believe" in AGW there would have to be a clear correlation between the beginning of human CO2 emissions and evidence of warming."
Um, there is a clear correlation between the beginning of human CO2 emissions and evidence of warming... so long as you are looking at the full picture.
If you look at the five minutes after the first coal power plant went online, no you won't see any correlation. Nor is it clear for the first decade or two. However, look at CO2 levels and temperature levels for the first hundred years since the industrial revolution and there is a very clear correlation. Both have gone nearly straight up at rates faster than anything seen previously in century level resolution proxy data.
Thus, this argument amounts to, 'I will cherry pick a time frame too short to see the correlation and then pretend it is not happening'.
Greetings - I'm new to this webpage / forum, which I find fascinating. The brief bio's on the Skeptical Science Team is as impressive as it is varied. I realize this is an old thread, but it looks like a good place to start.
Let me say at the outset I agree the climate is changing - warming in most areas of the globe - with a net temperature increase. That is obvious in the data, of which I spent a 40 year career collecting, analyzing and processing. Living in the plains, the changes are apparent - latter first snows, earlier spring, increases in non-native insects, plant and human diseases; the list goes on.
While I have my own understanding and response to Change skeptics, I've learned to consider all the facts. Science is after all based in question, discovery, hypothesis, observation, proof, testing proof. Therefore I have two questions.
1) Water Vapor and it's impact on the changing climate. Per the older NASA article from November 2008
http://www.nasa.gov/topics/earth/features/vapor_warming.html
and others since, it seems H2O is somewhat downplayed. What is the Teams sense on H2O impacts on climate change?
2) Science by concensus (Bill Nye's famous videos). Other disciplines outside of meteorology have differing views on the changing climate. By education I was a Soil Science major. In my 'weather' career I've seen this lack of cross discipline discussion result in all manner of issues. Again, what is the Teams sense on "Science by concensus" versus the time tested steps of the Scientific Method?
Thank you. I look forward to your response.
While some threads are dated, no threads are dead here.
Water vapor is best addressed on this SkS thread here:
Explaining how the water vapor greenhouse effect works
I have placed a followup to your question there. Any questions you may have after reading the post and my response should be placed there.
Many other threads deal with consensus. The Search function will find many; pick one and re-ask your question there.
ClimateTool - Regarding consensus, I would suggest following Daniels excellent suggestion, and looking at threads using the Search box on the upper left.
ClimateTool, in addition to the posts pointing you to other sections of the site, short answers to your questions are;
1: The amount of water vapor the atmosphere can hold is directly tied to atmospheric temperature (e.g. "relative humidity" is the amount of water vapor in the air relative to the maximum amount possible for the current temperature). Thus, temperature increases from CO2 will lead to more water vapor... and corresponding additional warming. Thus, water vapor is a significant positive feedback in global warming, but cannot 'initiate' the warming itself.
2: Your question itself contains a fallacy. There is no conflict between, "'Science by consensus' versus the time tested steps of the Scientific Method". There is concensus on AGW because application of the scientific method over the course of the past 100+ years (since Arrhenius proposed the AGW theory in 1896) has overwhelmingly shown it to be accurate. Nor is there any "lack of cross discipline discussion". Oceanographers, botanists, zoologists, astronomers (studying atmospheres on other planets), and scientists in various other fields have all independently found evidence matching what climatologists have shown.
ClimateTool, I'm going to expand a little on CBDunkerson's second point. The lack of cross-discipline discussion is a complaint I often hear from people in genuine doubt and from fake skeptics. The complaint is a sure sign that the writer or speaker hasn't engaged the science in any meaningful way. After all, if one wants to know what the relevant science says, but doesn't want to wade through tens of thousands of publications, all one has to do is go to a summary of the existing relevant science.
That's what the IPCC AR5 is. It's a summary of the relevant science. It was written by ~850 scientists, regular publishers in their disciplines, who were not paid for their work. It directly references 20,000+ publications, and tens of thousands more by proxy. It went through multiple rounds of peer review that generated 150,000+ comments.
You complain that little cross-discipline discussion takes place, but the second section of AR5 (Working Group 2: Impacts, Adaptation and Vulnerability) is nothing but cross-discipline collaboration to summarize thousands of interdisciplinary studies. I don't mean to suggest that the other WGs are not interdisciplinary, for they are, but WG2 is obviously so.
And (speaking to your other complaint about consensus) the IPCC assessment reports represent the consensus of evidence. If you are serious about understanding the problem, the well-organized AR5 is the place to start. SkS welcomes both questions and informed discussion.
ClimateTool - One side note: your use of the capitalization in "...what is the Teams sense..." is often a shibboleth of pseudo-skeptics; tied to conspiracy theories that have a 'Team' of scientists somehow organized to deceive everyone else, usually for some vague sort of world domination.
Which is silly - organizing scientists across multiple fields, countries, and decades to argue against the facts would be like herding ADHD cats. Just not possible.
If you are actually interested in the topic of climate change, and (particularly for this site) various myths about it, I would suggest avoiding terminology with implied insults.
"..organizing scientists across multiple fields, countries, and decades to argue against the facts would be like herding ADHD cats."
I would add "...away from a field of open tuna cans." Such an effort would be asking those scientifickyADHD cats to sacrifice their own professional self interest.
Why would they not chose to make a name for them selves by picking low hanging fruit and bucking an obviously false paradigm? Makes no sense.
KR
My apologies - I meant no such thing. My goal was to ask for the concensus of the team members as listed in the "About" section. I shall avoid such faux pas in the future.
I do argue however that organizing various disciplines does occur on a regular basis. Having been involved in both operational and field level research I have been fortunate enough to work with geologists, physicists and agronomists on Climate Change issues.
Perhaps my naivete is showing through. But I stand by my ascertion.
Thank you for your responses.
[DB] "concensus of the team members"
While consensus is important, what really matters is what the evidence itself shows. Consensus of opinion does not replace evidence and physics.
If you have questions on the evidence and the physics of the science, please use the Search tool to find the most appropriate thread on which to place them (after reading it and the comment thread underneath the article). Thanks!
ClimateTool - Ah, that makes sense; perhaps asking what the "SkS team" is thinking would be a less ambiguous terminology.
However, I'm a bit confused as to what assertion you are standing by? You've just asked a couple of questions...
Climate Tool:
As was pointed out upthread, the IPCC reports, and various others, are compendia of cross discipline results. Your suggestion that cross discipline analysis is not done in AGW is simply false. Please cite a major summary report that does not contain results from multiple disciplines.
The SkS team has a variety of opinions, often different. You should be more specific in your question. About water vapor specificly, which appears to be your question, without asking I dare say everyone agrees H2O is an important greenhouse gas. It contributes a large fraction, or a majority of the greenhouse effect. Everyone knows this.
Water vapor concentration is dependent on the CO2 concentration. CO2 is not dependent on water vapor. This means CO2 is the temperature control knob. Future temperature changes (and water vapor changes) will follow the CO2 changes.
Just to simplify a little here...
CO2 is a long-lived, non-condensing greenhouse gas that is well mixed from pole-to-pole and through the full column of the atmosphere.
H2O is a short-lived, condensing greenhouse gas that freezes out at higher latitudes and altitudes.
If the unremitting rise of CO2 from industriail activities is the dominant factor, why did the global temperature decrease from 1940 to 1970?
..aerosols !
Ken Kimura @19, if you sum all forcings (ie, not just that from CO2) using the values estimated by Meinhausen et al (2011), the trend in the forcings from 1940 to 1970 is 0.0003 +/- 0.0007 W/m^2 per annum. That is, it is essentially zero, and may well have been negative. On top of that, there was a substantial El Nino early in the sequence and a La Nina following the volcanic eruption in 1965 which together with the very low trend in forcings may have tipped the temperature record negative.
Having said that, if you look at this model of the ENSO adjusted temperature responce to forcings, you will see to large temperature spikes around 1939 and 1945 that are not accounted for by the model and which also contribute to the negative slope. It is difficult to know that to attribute those spikes to. They may be due to unusually large forcing by Black Carbon during World War 2. They may also be due to an artifact in the temperature record due to the sudden, very large reductions in temperature coverage along with the simultaneious large changes in methods of measuring Sea Surface Temperature brought about by WW2.
What they are not due to is the Pacific Multidecadal Oscillation (which is captured by the ENSO signal) or the Atlantic Multidecadal Oscillation (which does not have a suitable pattern to explain the phenomenon). Nor are they due to a fundamental misunderstanding of the forcings, or the relative effects of natural and anthropogenic forcings. The model I linked to allows you to weight the various forcings, making natural forcings much stronger in effect than anthropogenic forcings if you desire. Any such attempt, however, greatly increases the number of temperature discrepancies. That fact shows conclusively that theories that attempt to explain the twentieth century temperature record without anthropogenic factors being the dominant factor post 1940 (and a significant factor prior to 1940) are doomed to failure.
Tom Curtis@21,
According to the figure 5 of the following page, stratospheric and reflective tropospheric aerosols were major negative forces during the period.
What do you think the main cause of those aerosols was?
If it was due to the industrialization, you know that the industrialization started long before 1940.
http://www.skepticalscience.com/co2-temperature-correlation-intermediate.htm
Ken Kimura @22, I discuss the trend from 1940-1970 because you asked a question about the trend from 1940-1970, and for no other reason. For you to then turn around and ask "you know that the industrialization started long before 1940" looks like a calculated, and hypocritical insult.
With regard to your former question, stratospheric aerosols are almost exclusively from volcanic erruptions. Tropospheric aerosols are from a combination of wind born sea salt, refractory compounds from forest, desert sand and anthropogenic factors. Forcings, however, represent the change in a factor over time, and the vast majority of the change in tropospheric aerosol load is from anthropogenic factors - primarily from sulfur in coal and oil. As can be seen from this graph from the IPCC AR5, the combined anthropogenic effect (red line) from 1940-1970 results in a positive slope in forcing:
The combined anthropogenic plus natural forcing is flat or negative due to the lack of volcanic erruptions from about 1915 and the onset of a large eruption (Agung, 1963-4) along with a number of smaller eruptions.
Note that the above graph sets the zero point for forcings at 1750 rather than the 1880 used in the GISS forcing graph you pointed to, and the Meinhausen 2011 forcings displayed in the model to which I linked.
With regard to the relation between anthropogenic GHG forcings and anthropogenic aerosol forcings, initially the aerosol forcing from oil and (particularly) coal dominate in the short term, but with steady state use the GHG forcing comes to dominate very quickly. That is because the initially dominant aerosol load is quickly washed out of the atmosphere by rain, while the GHG concentration (particularly CO2) accumulates. With accelerating coal combustion, these factors can approximately balance for a while, as can be seen from 1750-1860 above, but in the 20th century the GHG forcing has been stronger both because of the accumulation of CO2 in the atmosphere and a gradual switch to cleaner (ie, less sulphur content) fuels.
Tom Curtis @23.
"For you to then turn around and ask "you know that the industrialization started long before 1940" looks like a calculated, and hypocritical insult."
I had no intention to insult you.
And I have no idea why you thought so.
"With regard to your former question, stratospheric aerosols are almost exclusively from volcanic erruptions."
I have at least 3 questions.
1) What are the evidences of this claim of yours?
2) How did they measure the stratospheric aerosol density during the period?
3) How can you be sure that their mesurement was accurate?
Ken Kimura @24 , let me be quick to assure you that Tom Curtis was not the only one to see your: ". . . started long before 1940" comment as insulting (or something very close to that).
Perhaps you didn't mean it that way . . . or only meant it at some subconscious level . . . or at another level, meant it disingenuously. Or all three ways at once [such is the complexity & inconsistency of the human mind] . But your comments had a general background context or "tenor" which would lead Tom to his conclusion quite naturally and automatically, I do believe.
Aerosol reflectivity can be measured from ground stations; and in more recent decades from satellite observations; and measured indirectly by correlation with the observed changes after each significant volcanic eruption. [Instrumental measurement or proxy measurement]
For the accuracy of the measurements & estimations, you might care to consult the original scientific papers that investigated such phenomena. But, unless you have good reason to doubt their bona fides [in which case you should declare your hand : and show the evidence you rely on for such opinion] . . . then your question is a side-issue, which need not distract us from the main thrust of your inquiry.