


 Arguments


Analysis: Global CO2 emissions set to rise 2% in 2017 after three-year ‘plateau’
Posted on 14 November 2017 by Zeke Hausfather
This is a re-post from Carbon Brief
Over the past three years, global CO2 emissions from fossil fuels have remained relatively flat. However, early estimates from the Global Carbon Project (GCP) using preliminary data suggest that this is likely to change in 2017 with global emissions set to grow by around 2%, albeit with some uncertainties.
Hopes that global emissions had peaked during the past three years were likely premature. However, GCP researchers say that global emissions are unlikely to return to the high growth rates seen during the 2000s. They argue that it is more likely that emissions over the next few years will plateau or only grow slightly, as countries implement their commitments under the Paris Agreement.
2017 emissions likely to increase
The GCP is a group of international researchers who assess both sources and sinks of carbon. It has published an annual global carbon budget report since 2006. Its newly released global carbon budget for 2017 provides estimates of emissions by country, global emissions from land-use changes, atmospheric accumulation of CO2, and absorption of carbon from the atmosphere by the land and oceans.
Video summary of the findings of the GCP’s new 2017 global carbon budget, via Future Earth and the GCP.
The figure below shows global CO2 emissions from fossil fuels, divided into emissions from China (red shading), India (yellow), the US (bright blue), EU (dark blue) and the remainder of the world (grey). After a rapid increase in global emissions of around 3% per year between 2000 and 2013, emissions only grew by 0.4% per year between 2013 and 2016.
Annual CO2 emissions from fossil fuels by major country and rest of world from 1959-2017, in gigatons CO2 per year (GtCO2). Note that 2017 numbers are preliminary estimates. Data from the Global Carbon Project and available here. Chart by Carbon Brief using Highcharts.
Much of the slowdown in the growth of global emissions in recent years has been driven by a combination of reductions in the US and China, as well as relatively little growth in emissions in other countries. This changed in 2017, with little-to-no reductions in US emissions and a sizeable increase in Chinese emissions.
India’s emissions increased a bit more slowly in 2017 than in the past few years, while the EU’s emissions have remained relatively flat since 2014 and did not noticeably change in 2017. The growth in emissions from 2016 to 2017 also more than doubled in the rest of the world.
The total emissions for each year between 2014 and 2017 and the countries that were responsible for the change in emissions are shown in the figure below. Annual emissions for 2014, 2015, 2016 and estimates for 2017 are shown by the black bars. The coloured bars show the change in emissions between each set of years, broken down by country. Negative values show reductions in emissions, while positive values reflect emission increases.
Annual global CO2 emissions from fossil fuels (black bars) and drivers of changes between years by country (coloured bars). Negative values indicate reductions in emissions. Data from the Global Carbon Project. Chart by Carbon Brief using Highcharts.
As 2017 is not yet over – and somewhat limited data is available – these projections are still subject to large uncertainties. The global estimate of a 2% increase in emissions could be as low as 0.8% or as high as 3%, say the researchers. The GCP will publish more complete 2017 numbers in early 2018 when all the data is available.
China
The GCP reports that China’s emissions are projected to grow by 3.5% in 2017, with wide uncertainty ranging from 0.7% to 5.4%. China represents the single most important reason for the resumption of global emissions growth in 2017. This is driven by a projected 3% increase in coal consumption, 12% increase in natural gas consumption and 5% increase in oil consumption.
While the past few years have seen similar increases in natural gas and oil consumption in China, 2017 will reverse a few years of flat or declining coal consumption. The GCP reports that the 2017 increase in coal consumption – and, in turn, overall Chinese emissions – is driven by a combination in increased industrial production and reduced hydroelectric generation associated with lower-than-usual rainfall.
However, industrial growth has started to slow down again over the past three months, which might signal slower emissions growth and coal consumption in 2018.
US
The best estimate of 2017 US emissions is for a decline of about 0.4%, though they could decrease by as much as 2.7% or increase by as much as 1.9%. This will likely be a smaller decrease than in past years, as US emissions have declined by around 1.2% per year over the past decade. This reflects a modest uptick in coal use for electricity generation in the US and an associated decline in gas use. 2017 will likely be the first time in the past five years that US coal consumption has risen.
India
India’s emissions are projected to grow by 2% in 2017 (ranging from 0.2% to 3.8%), lower than the, on average, 6% growth in emissions over the past decade. This appears to be mostly due to reduced oil consumption growth and a 6% reduction in cement production. Coal consumption increased at a similar rate to prior years.
Global carbon budget
Every year the GCP provides an estimate of the global carbon budget, which estimates both the release and uptake of carbon including emissions from fossil fuels and industry, emissions from land-use changes, carbon taken up by the oceans and land, and changes in atmospheric concentrations of CO2. This differs from the commonly used term “carbon budget”, referring to how much emissions are left to meet a climate target, such as avoiding 2C warming.
The most recent budget, including estimated values for 2017, is shown in the figure below. Values above zero represent sources of CO2 – from fossil fuels and land use – while values below zero represent sinks of CO2, where the sources of CO2 end up. CO2 emissions either accumulate in the atmosphere, or are absorbed by the oceans or land vegetation.
Annual global carbon budget of sources and sinks from 1959-2017. Note that the budget does not fully balance every year due to remaining uncertainties, particularly in sinks. Note that 2017 numbers are preliminary estimates. Data from the Global Carbon Project and available here. Chart by Carbon Brief using Highcharts.
Land-use changes, such as deforestation and fires, comprised 11% of total emissions in 2017, marginally down from the 13% average over the past decade. The remaining 89% of emissions came from fossil fuels and industry. Total CO2 emissions decreased by about 2% between 2015 and 2016, driven entirely by lower land-use emissions.
In 2017, overall CO2 emissions – including land use – are likely to increase by around 1.5%, as land-use emissions are estimated to remain roughly the same as in 2016. This means that total CO2 emissions are likely to be similar as in 2015, with the increase in fossil fuel emissions being offset by the decrease in land-use emissions.
About 54% of CO2 emitted in 2016 accumulated in the atmosphere, while the remainder was taken up by carbon sinks – 24% by the land and 22% by the ocean. The portion of CO2 accumulating in the atmosphere in both 2015 and 2016 was higher than average, driven in part by the large El Niño event. This is expected to drop to around 46% in 2017, as it is a year lacking a major El Niño.
Updating sources and sinks
The GCP’s new global carbon budget also includes updated estimates of sources and sinks based on changes in inventories and new research published since the last budget came out. The figure below, taken from the paper presenting the latest budget, shows the budget values used for every year from 2006 through to present.
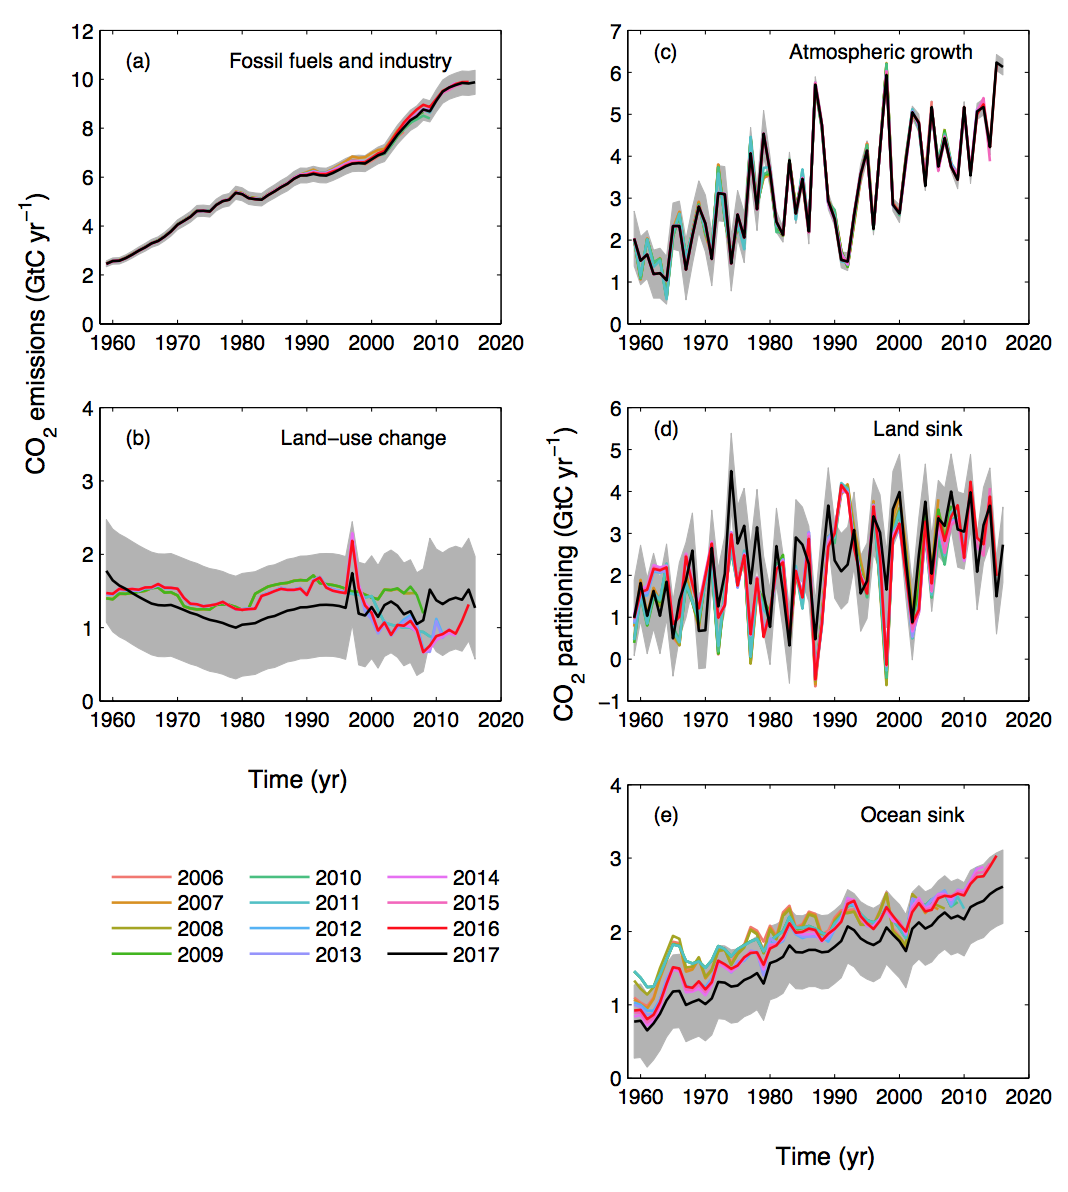
Global Carbon Project source and sink estimates in gigatons carbon (GtC) – note, not CO2 – for every Global Carbon Budget published between 2016 and 2017. Figure 9 from Le Que?re? et al (2017).
Estimates of fossil fuel emissions were revised downwards a bit from the 2016 report, particularly between 1990 and 2010. This was due largely to a change in the dataset used to estimate Chinese emissions.
The GCP’s new global carbon budget also incorporates updated land-use emission estimates that significantly revise past land-use change emissions, showing higher emissions prior to 1960, lower emissions between 1960 and 1999, and higher emissions from 1999 through to present. This ends up changing estimates of cumulative carbon emissions since the pre-industrial period, but given the large uncertainties involved the authors caution against using these revisions to draw conclusions about remaining carbon budgets associated with staying within the 2C or 1.5C warming targets.
Implications for limiting warming to 2C
As previously discussed by Carbon Brief, the later that global emissions peak the more rapid the reductions must be to limit warming to 2C. The figure below shows how the rate of reduction varies based on peak year, adding in the new estimated 2017 emissions.
Emission reduction trajectories associated with a 66% chance of avoiding more than 2C warming by starting year, with new 2017 emissions added. Solid black line shows historical emissions, while dashed black line shows emissions constant at 2016 levels. Data and chart design from Robbie Andrew at CICERO and the Global Carbon Project. Chart by Carbon Brief using Highcharts.
The increase in emissions in 2017 makes it more challenging for the world to limit warming to “well below 2C”, as per the Paris Agreement – at least in the absence of large-scale removal of carbon dioxide from the atmosphere from as-yet-unproven negative emission technologies later in the century.
While the slowdown in emissions over the past few years and the “peaking” of emissions by a number of countries has been cause for cautious hope, this is tempered by the uptick in emissions projected in 2017. According to UN Environment, existing commitments by nations fall well short of what is needed to meet warming targets and emissions will not fall quickly until the world undertakes much more ambitious mitigation actions.
Le Quéré et al. (2017) Global Carbon Budget 2017. Earth System Science Data Discussions. https://doi.org/10.5194/essdd-2017-123
Peters et al. (2017) Towards real time verification of CO2 emissions. Nature Climate Change. https://doi.org/10.1038/s41558-017-0013-9
Jackson et al. (2017) Warning signs for stabilizing global CO2 Emissions, Environmental Research Letters. https://doi.org/10.1088/1748-9326/aa9662


It may be bad form to be pessimistic but this is one of the most alarming articles I have seen in some time. While it makes clear the thinking behind forecasts, it also shows the lack of allowance for bad news. Credible scientists must be very cautious in their conclusions, meaning they will fail to highlight the more dangerous side of probability, not wanting to be labeled alarmists. Intuitive viewing of both chars shows that bias all to plainly.
Try to put bad news into these charts. Good news is when we advance alternative energy, which had been advancing very nicely, it will be a smooth turning of the curves. But there is potential for a lot of bad news which these charts must accommodate, and these are from nature, on a planetary scale, as seen on the sawtooth nature of land sink rates.
Pray for China to take some big steps, they need to lead the big gray world curves in the right direction. US is out cold for the next few years, hopefully enlightened voters will get us to go in the right direction soon, but sloppy policy could cause us to trip into bad suprise feedback loops.
Scary!
The electric semi is here but we need it to be powered by solar or it means nothing!
The world is turning very nicely at the moment and I suspect Trump will have no choice but to regulate fossil fuels to win his second term which of course he can do because he is the worlds biggest backflipper as the media can't call him out on it!
2019 is when the Tesla electric semi comes out so I'm looking forward to solar plants coming in to power their mega-Chargers!