


 Arguments


Recent Comments
Prev 583 584 585 586 587 588 589 590 591 592 593 594 595 596 597 598 Next
Comments 29501 to 29550:
-
Klapper at 13:53 PM on 2 May 2015Models are unreliable
@Tom Curtis #877:
We should stay on topic and deal with the numbers. Do you have a suggestion of a linkable place I can post my graph?
-
Tom Curtis at 13:38 PM on 2 May 2015Models are unreliable
Klapper, is that really how you want to defend your persistent use of inappropriate comparisons? I take that as an admission that it is indefensible (which I guess I knew anyway).
-
Tom Curtis at 13:36 PM on 2 May 2015Climate sensitivity is low
bozza @354, even emissions at 10% of current rates would be sufficient to keep on increaseing atmospheric CO2 concentrations, and ergo prevent net ocean outgassing of CO2. The rate of increase of atmospheric CO2 would, however, slow to a standstill in that case - and slow substantially if we only halve emissions. Having said that, the proportion of emissions retained in the atmosphere would not necessarilly remain at the current 55%, and would decrease over time with increasing SST (assuming constant emissions). It follows that while 2100 concentration would probably be below 580 ppmv, I cannot tell you how far. The nearest I can do is show you the RCP 4.5 figures (second graph) as the nearest approximation (first graph).
-
Klapper at 13:32 PM on 2 May 2015Models are unreliable
@Tom Curtis #872:
"Political, off-topic or ad hominem comments will be deleted" (Comments policy)
-
Klapper at 13:30 PM on 2 May 2015Models are unreliable
@KR #871:
"...You've limited yourself to such a small dataset that frankly I cannot take any of your arguments seriously.."
Although I'm skeptical of the data quality before this century for the deep ocean, I downloaded the pentadal OHC data and ran a 5 year running trend to convert ZJ to W/m^2 heat input on a global area basis. The results are as follows (TOA CMIP5 ensemble forcing vs NODC Pentadal heat content change, both 5 year periods):
1959 to 2000 - 0.23 W/m^2 from OHC, 0.49 W/m^2 from model forcing
2000 to 2010 - 0.51 W/m^2 from OHC, 0.95 W/m^2 from model forcing
While delta OHC is not global heat content change, it is the great majority of it. Two conclusions seem appropriate:
1. The better the observational data quality, the bigger the discrepancy between model hind/forecasts and,
2. The models run hot.
I can post the graph here if someone lets me know where I might post to the internet so I have a URL link.
-
Tom Curtis at 13:24 PM on 2 May 2015Climate sensitivity is low
Klapper @348:
"You're ignoring my comment above in which I clearly stated the 0.5 W/m2 was the difference between OHC and the TOA model output."
First, you were comparing the difference between model TOA energy imbalance and observed 0-2000 meter OHC.
Second, absolutely right I was ignoring that. Just because you want to compare the model TOA energy imbalance with approximately 80% of the observed energy imbalance (ie, the 0-2000 meter rate of change in OHC) in no way makes that justified. Nor does it justify you comparing model 2000-2015 model TOA energy imbalance with 2005-2010 TOA energy imbalance as you did @325. You seem to have a penchant for strengthening your case by using inappropriate comparisons. However, as you insist that I not use the appropriate comparison because you originally used the inappropriate comparison, I will notice it and call it what it is - ie, fraudulent argument.
-
bozzza at 12:45 PM on 2 May 2015Models are unreliable
..never fear, Instagram is here![starts worry mode]....
-
Klapper at 12:44 PM on 2 May 2015Models are unreliable
@scaddenp #866:
"...But if you disagree, then you really don't have sufficient data to argue about model fidelity.."
I do disagree. Go to the NODC website. You can find a ocean heat data distribution mapping tool you can customize by period. For example, display 1500 metres depth for the period 1968 to 1972. Count the dots in a polygon formed by New Zealand, Ecuador, the Solomon Islands and the Antarctic Penisula. It's not hard to do. Keep in mind each black dot represents one sample, i.e. May 15, 1969.
You have maybe 4 or 5 single samples in this 5 year period between the equator and the Antarctic coast and 90 degrees and 150 degrees longitude west. This represents a huge area with essentially no data in a recent 5 year period.
For a shocking contrast, now retrieve the same depth for 1 year (2014) and try and estimate how many samples were retrieved.
-
Tom Curtis at 11:53 AM on 2 May 2015Models are unreliable
Rob Honeycutt @868:
"And the data we have a decade from now will be better than the data we have today."
With conservative governments in Australia and Canada, and a conservative congress in the US being so sure that the science is against them, that they are doing all they can to cut science budgets (particularly for research on global warming) I would not be sure of this.
-
bozzza at 11:30 AM on 2 May 2015Climate sensitivity is low
Iff we were to cut CO2 emissions in half tomorrow would we still go past 580ppm by 2100 due to possible outgassing of the ocean?
-
KR at 10:21 AM on 2 May 2015Models are unreliable
Klapper - "...I want the best data"
As do we all. And the best data for the last half of the 20th century, while subject to higher uncertainties that current measurements, is worth attention.
Again, differences in the 5-10 (and, grudgingly on your part, perhaps 15) year periods you are looking at are short enough to be entirely unforced variation - with recent work on 21st century volcanic activity (not included in the CMIP5 forcings) that has direct implications for the TOA balance also worth considering. You've limited yourself to such a small dataset that frankly I cannot take any of your arguments seriously.
-
Tristan at 09:42 AM on 2 May 2015The climate 'hiatus' doesn’t take the heat off global warming
Thanks TC, exactly what I was looking for!
Hope you're feeling better. -
Mal Adapted at 09:36 AM on 2 May 2015Models are unreliable
scaddenp: "If you believe the Leviticus estimates of error margins on OHC to be incorrect"
Hmm, I'm not a biblical scholar, but I don't recall seeing any estimates of error margins in that book...
-
Rob Honeycutt at 09:14 AM on 2 May 2015Models are unreliable
Klapper @868... Absolutely. And the data we have a decade from now will be better than the data we have today. Today's data certainly doesn't invalidate past data nor would better systems in the future mean current data is bad. The data we have is just what it is at any given point in time. It's always going to be imperfect. Data is imperfect. Models are imperfect.
But again, this is why models are used to constrain those uncertainties. That's "Trenberth's tragedy." Our current systems can't fully account for all the heat in the climate system. That doesn't mean it's not there. That just means that our systems are inadequate.
What is abundantly clear, though, is that adding 4W/m^2 to the climate system is going to warm the planet in a significant and potentially calamatous way.
-
Klapper at 07:44 AM on 2 May 2015Models are unreliable
@KR #867:
"...a combination of poor statistics and impossible expectations about 'perfect' data..."
I don't want "perfect data", I want the best data. I think all posters would agree that thanks to Aqua/Terra/GRACE/ARGO etc. we have the much better data available in the 20th century than previously.
-
KR at 06:46 AM on 2 May 2015Models are unreliable
From Klapper - "I've looked at the quarterly/annual sampling maps for pre-Argo at various depths..."
Well, there are good reasons for NOAA to display 0-2000 data as pentadal (5-year) averages:

What Klapper appears to be expressing with his short term trends and dismissal of earlier OHC data is a combination of poor statistics and impossible expectations about 'perfect' data.
-
citizenschallenge at 06:43 AM on 2 May 2015Heartland takes climate foolishness to a Biblical level
OPOF writes: "It is important to not refer to the Heartland Institute as a 'religion based group'."
True enough they are a libertarian organization who count's the childishness of Ayn Rand as a profound Truth - their founders and members have roots in the Reaganomics doctrine that endless growth is possible, "too much is never enough" and that "greed is good".
But, challenge them on their talking points and it's nothing but silence.
fyi - Sunday, April 26, 2015
#11 Questions for Heartland's Burnett, re Dr. Mann and more -
The CC/Steele Landscapesandcycles Debate
http://whatsupwiththatwatts.blogspot.com/2015/04/11heartland-drmann-ccsteeledebate.html
-
scaddenp at 06:22 AM on 2 May 2015Models are unreliable
Klapper, at the moment, your dismissal of pre-Argo data seems to be an argument from personal incredulity. If you believe the Leviticus estimates of error margins on OHC to be incorrect, then can you please show us where you think the fault in their working is?
-
KR at 05:47 AM on 2 May 2015Climate sensitivity is low
Klapper - I've responded on the appropriate thread for this conversation.
-
KR at 05:47 AM on 2 May 2015Models are unreliable
Klapper - Levitus et al seems to think there's sufficient data for estimating OHC, as does NOAA. But if you disagree, then you really don't have sufficient data to argue about model fidelity.
-
Klapper at 05:46 AM on 2 May 2015Climate sensitivity is low
@Tom Curtis #345:
"...the modelled TOA energy imbalance lies within error (actually, withing 1.2 SDs) of the observed value."
It generally always does for these model-observation discrepancies. However, if the model-observation discrepancies are always on the hot side that is more than an "emotive" argument don't you think?
-
Klapper at 05:37 AM on 2 May 2015Climate sensitivity is low
@Tom Curtis #345:
"...the modelled TOA energy imbalance lies within error (actually, withing 1.2 SDs) of the observed value."
It generally always does for these model-observation discrepancies, but then again the models are always on the hot side aren't they?
-
Klapper at 05:35 AM on 2 May 2015Climate sensitivity is low
@KR #347:
"...We have OHC data of reasonable quality back to the 1960s"
I've looked at the quarterly/annual sampling maps for pre-Argo at various depths and I wouldn't agree that's true for 0-700 m depth and certainly not true for 0-2000 m. There's a reason Lyman & Johnson 2014 (and other stuides) don't calculate heat changes prior to 2004 for depths greater than 700 m; they are not very meaningful.
-
Klapper at 05:30 AM on 2 May 2015Climate sensitivity is low
@Tom Curtis #345:
"...anomaly values being used as a correction for model drift."
Why don't you expand on what you think is going on here. I'm using the absolute numbers from the mean CMIP5 ensemble, which I think is the correct thing to do. What do you (and Smith et al) mean by "model drift"?
-
Klapper at 05:26 AM on 2 May 2015Climate sensitivity is low
@Tom Curtis #345:
"..So, even on your figures the discrepancy between mean model and mean observed TOA energy imbalance is substantially less than 0.5 W/m^2 (which as I said before, is a fiction)".
You're ignoring my comment above in which I clearly stated the 0.5 W/m2 was the difference between OHC and the TOA model output. Here's my 2 most succinct posts from the Guardian on the source of the 0.5 W/m2 number:
"All that being said, these studies would agree the heat gain in the measurable part of the ocean is in the range of 0.3 to 0.6 W/m2. If the best guess at ocean heat gain is 0.5W/m2, then where is the rest of the heat? Models show the imbalance at the top of the atmosphere through this period as being 1.0 W/m2. We know the atmosphere has limited heat capacity, and the troposphere hasn't shown significant warming since 2005 in any case. That leaves ice melting."
"However, heat gain by the oceans right now might be 0.5W/m2, which is only 1/2 of the projected TOA energy imbalance, so while the oceans are warming, and the atmosphere very weakly so, together they don't account for the model predicted 1.0 to 1.2 W/m2 TOA net energy input."
I concede in at least one post I used the OHC delta to TOA model as "shorthand" for the global energy delta to model TOA, but it's clear from my initial posts the source of the numbers. You're either not reading my full posts or you're deliberately ignoring the context.
-
KR at 05:17 AM on 2 May 2015Climate sensitivity is low
Might suggest to one and all that this conversation about model fidelity shift to the appropriate thread on climate models?
-
KR at 05:16 AM on 2 May 2015Climate sensitivity is low
Klapper - We have OHC data of reasonable quality back to the 1960s, as I noted here. What you are considering is far too short a period for statistical significance, hence too short to make broad statements about model fidelity. If you want to make any claims regarding the differences I would suggest using a sufficient amount of the available data.
You're arguing about short term unforced variations, not statistically significant long term climate trends, and your complaints about the XBT data don't change that fact.
-
Tom Curtis at 04:57 AM on 2 May 2015Climate sensitivity is low
Klapper @343:
"The 2000 to 2010 average TOA energy imbalance is +0.95W/m2."
1) I need to make a correction. I assumed that Smith et al presented a median value based on their use of a box plot. In their supplementary information, however, they describe the central value as a mean, and the "first quartile" and "third quartile" values as being minus and plus one standard deviation respectively, with whiskers showing the range. The values are given as 0.73 +/- 0.13 W/m^2 with a range from 0.43 - 0.97 W/m^2. These values are stated as being the anomaly values with respect to the preindustrial era - anomaly values being used as a correction for model drift.
2) As noted before, the difference between observations and models over this period in Smith et al is 0.11 W/m^2. Even using your uncorrected values, the difference between observed and modelled TOA energy imbalance from 2000-2010 is still only 0.33 W/m^2. The +/- 2 sigma range of the observed TOA energy imbalance is 0.06 to 1.18 W/m^2. So, even on your figures the discrepancy between mean model and mean observed TOA energy imbalance is substantially less than 0.5 W/m^2 (which as I said before, is a fiction). Further, you are making a case that the models are shown to be seriously flawed because, the modelled TOA energy imbalance lies within error (actually, withing 1.2 SDs) of the observed value. It may make a good emotive argument, but it is certainly not a scientific argument.
-
Klapper at 03:58 AM on 2 May 2015Climate sensitivity is low
@MA Rodger #341:
".. reducing your mismatch from the range 0.19-0.49 W/m2 to 0.06-0.36 W/m/2, considerably reduced from the originally stated 0.5 W/m2"
You're forgetting the originally stated comparison was to OHC, not global energy imbalance (although as noted OHC pretty much is the bulk of the energy imbalance). In any case, even reduced, the numbers support my hypothesis the models run too hot.
"..implies that the aerosol forcing is about -1.6 W/m2"
Circular logic but that's a topic for whole discussion on itself. I'll say no more.
"..would more recent models be expected now to conform to Hansen et al (2012)?"
I'm using the more recent models (CMIP5) and they don't conform to Hansen et al 2012 (still too hot). I'm tempted to go get the AR4 model ensemble and try that also, but for now I'm off to work.
-
Klapper at 03:49 AM on 2 May 2015Climate sensitivity is low
@Tom Curtis #340:
"..The IPCC uses just one model run per model in calculating multi-model means for a reason."
Yes very egalitarian of them. An argument could be made for using the other ensemble which says, the better resource supported models have more runs and are probably more realistic than the less resourced models. However, it doesn't make much difference, as the 2005 to 2010 average TOA imbalance changes from 0.92 to 0.90W/m2 with the one run per model ensemble.
"..What are your results for 2000-2010 for comparison with the Smith et al data?"
The 2000 to 2010 average TOA energy imbalance is +0.95W/m2.
".. rather than the multi-model median as do Smith et al?"
I would have to download all the models, a very tedious process, and create my own median; KNMI only options a mean in their ensemble exports.
-
Klapper at 03:39 AM on 2 May 2015Climate sensitivity is low
@KR #338:
"I don't think you can make any significant conclusions from such a short period of data".
The quality data for OHC only begin since the ARGO system reached a reasonable spatial density (say 2004 at the earliest). However I will look for some longer OHC/global heat gain data/estimates to match longer periods, say a 15 year period from 2000 to 2014 inclusive. The average for that period is a TOA energy imbalance of 0.98W/m2 from the CMIP5 ensemble (multi-runs per model) mean rcp4.5 scenario.
-
billthefrog at 03:38 AM on 2 May 2015Inoculating against science denial
@ Straight Talkin
One of my old university chums is now a head of department at the London School of Hygiene & Tropical Medicine. In about 2 months time, they will be running a course called... "Epidemiological evaluation of vaccines: efficacy, safety and policy". Perhaps you should drop them a line and explain that they've got it all wrong.
-
MA Rodger at 02:06 AM on 2 May 2015Climate sensitivity is low
Klapper @337.
You are getting your 0.58 W/m2 +/- 0.15 from Hansen et al (2012) , a paper which states:-
"The fact that Earth gained energy at a rate 0.58 W/m2 during a deep prolonged solar minimum reveals that there is a strong positive forcing overwhelming the negative forcing by below-average solar irradiance. "
I would suggest that such a quote is difficult to ignore, although you apparently do overlook it. It sort-of adds weight to the comment by KR @338. From memory, the negative solar forcing through those years between cycle 23 & 24 was something like -0.13W/m2, reducing your mismatch from the range 0.19-0.49 W/m2 to 0.06-0.36 W/m/2, considerably reduced from the originally stated 0.5 W/m2.
The paper goes on to say:-
"Measured Earth energy imbalance, +0.58 W/m2 during 2005-2010, implies that the aerosol forcing is about -1.6 W/m2, a greater negative forcing than employed in most IPCC models." and "Most climate models contributing to the last assessment by the Intergovernmental Panel on Climate Change (IPCC, 2007) employed aerosol forcings in the range -0.5 to -1.1 W/m2."
Again, here is very relevant data you overlook. If these AR4 models underestimate negative aerosol forcing, you would expect them to run with a greater TOA imbalance. And if they did so in AR4, would more recent models be expected now to conform to Hansen et al (2012)? Or is that a bit of an assumption on your part?
-
Tom Curtis at 01:46 AM on 2 May 2015Climate sensitivity is low
Klapper @337:
1) Did you compute (∑rlut x 1/n) + (∑rsut x 1/n) - (∑rsdt x 1/n) or (∑(rlut + rsut - rsdt)) x 1/n?
2) The IPCC uses just one model run per model in calculating multi-model means for a reason. Failing to do so allows a few models with unusually large numbers of runs to be more heavilly weighted in the absence of evidence that those models are superior, and indeed, regardless of any evidence of their superiority or inferiority. In particular, one model with multiple runs is the GISS model ER, which you have previously stated has a TOA energy imbalance from 2000-2015 of 1.2 W/m^2 - ie, it is at the high end of the CMIP 5 range, and above the CMIP 5 multi-run mean as calculated by you. There is reason to think this distorts your result.
3) 5 years is too short a time for such comparisons for reasons given by KR. What are your results for 2000-2010 for comparison with the Smith et al data? Indeed, what are your results for all of the Smith et al periods as shown in the second panel of the first graph in my post @322?
4) Why do you use the multi-model (really multi-run) mean rather than the multi-model median as do Smith et al? In this case where damage functions are not a factor, using the median as the central estimate makes sense (IMO) in that it is less subject to distortion by outliers. Is their some reason why you preffer it despite this disadvantage?
5) I ask you to forgive me for not responding to your earlier posts. I had an extensive response prepared and lost it in the attempt to post it. Unfortunately I have been ill since then, and not had the energy for recomposing a similarly extensive response. I am also considering whether or not to download the data from KNMI for direct comparison before more detailed response (which will take more energy and concentration).
-
KR at 01:13 AM on 2 May 2015Climate sensitivity is low
Klapper/everyone - I'll note that many of Klappers issues with model fidelity have been discussed at great length over on the Climate Models show remarkable agreement with recent surface warming thread. And on that thread Klapper was shown (IMO) that his arguments did not hold.
This appears to be yet another search for a (notably short term, and hence statistically insignificant) criteria with which to dismiss modeling.
-
KR at 00:45 AM on 2 May 2015Climate sensitivity is low
Klapper - 5 to (at most) 15 year periods are short enough that statistical significance is lacking, and that the model mean is expected to differ from short term variations such as ENSO.
I don't think you can make any significant conclusions from such a short period of data.
-
Klapper at 00:09 AM on 2 May 2015Climate sensitivity is low
@MA Rodger #334:
To cross-check my model vs actual comparison for TOA energy imbalance I extracted at the KNMI Data Explorer site data from the CMIP5 Model Ensemble RCP 4.5 (all runs) the variables rsut, rlut, and rsdt, monthly data. I averaged the monthly global data into annual global numbers and calculated the TOA energy imbalance per year as rlut + rsut - rsdt.
To compare to a published number, in this case I'll use the Hansen et al number from the GISS website linked above, I averaged the years from my model extraction data, in this case 2005 to 2010. The GISS number for global TOA energy imbalance of 0.58 W/m2 +/- 0.15. This agrees with other published estimates of similar time periods.
The average I get from my CMIP5 RCP 4.5 ensemble annual data, 2005 to 2010 inclusive is 0.92 W/m2. The models appeart to be running too hot by a substantial amount.
My next experiment will be to compare these TOA CMIP5 data to OHC over a longer period, say 2000 to 2014 inclusive. Or maybe just OHC from 2005 to 2014 since the ARGO spatial density was essentially full coverage after 2004 or 2005. We can likely agree that the global energy imbalance dominantly present in the ocean heat gain, although some of the imbalance goes into the atmosphere and melting continental ice.
-
knaugle at 22:54 PM on 1 May 2015Heartland takes climate foolishness to a Biblical level
The articles I've read on this included comments from another Heartland Inst. representative, Lord Christopher Moncton, whose reputation as a "top climate scientist" is well known to readers of SkS.
-
Tom Curtis at 16:09 PM on 1 May 2015The climate 'hiatus' doesn’t take the heat off global warming
Tristan @22, seeing you ask, we have this from a recent, paywalled article, Unabated planetary warming and its ocean structure since 2006:

Also this from Purkey and Johnson 2010 for the 1990s and 2000s:

-
Tristan at 15:43 PM on 1 May 2015The climate 'hiatus' doesn’t take the heat off global warming
TC, are you aware of a graph that looks at warming rate vs depth?
-
Tom Curtis at 12:46 PM on 1 May 2015The climate 'hiatus' doesn’t take the heat off global warming
scaddenp @19, absolute heat content makes sense with respect to the heat content of the components at absolute zero temperature in a solid state. That is part of the definition of absolute zero. I agree, however, that the OHC anomaly is a far more usefull value. Also, it can be determined with a much lower error margin.
sauerj @20, your OWSALT would closely approximate to the "average temperature increase in the oceans" which deniers love to quote because its low numerical value is wonderfully deceptive. Here is an example from Bob Tisdale:
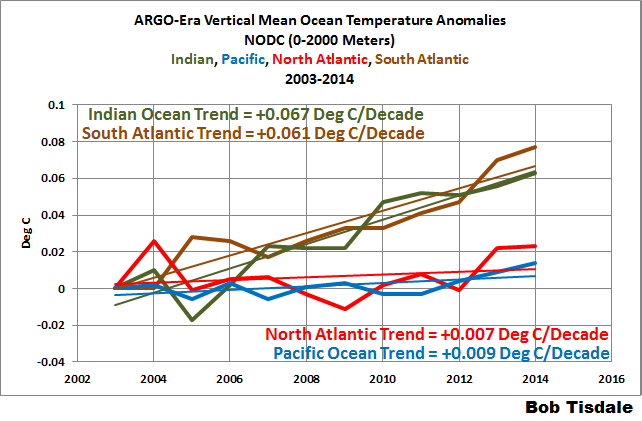
It is deceptive because nobody would care if the surface was warming as slowly as the average temperature increase across the ocean depths. Of course, it is not. It warms much faster and that creates a problem.
Further, such a measure has almost no scientific value. Surface temperature and OHC (or better Global Surface Heat Content, bearing in mind that the entire ocean is less than 0.2% of the radius of the Earth) both have immediate scientific import, being values in the equation for climate sensitivity as calculated by energy balance. OHC is a direct factor in the time taken to reach equilibrium, and surface temperatures are the governing value for the effects of reaching equilibrium. Both, therefore, are usefull. In contrast OWSALT as an index just ignores usefull information.
-
sauerj at 11:11 AM on 1 May 2015The climate 'hiatus' doesn’t take the heat off global warming
Picking up on ryland's 1st post: Is an "Overall Weighted Average Sea+Land Temperature" published anywhere (calculated based on the following)?:
OWASLT = Sum(Temp x Mass x Heat Capacity) / Sum(Mass x Heat Capacity), and looking at all pieces of mass components in the atmosphere + mass in the ocean (say down to 2000m or whatever depth would appropriate with respect to available global data & that should rightfully be included for an all inclusive weighted average temperature like this).
By combining everything into one OWASL temperature, this would then remove all the surface-only decadal swings caused by the shoshings back & forth between land & deep sea.
If total sea OHC is known (which is simply = temp x mass x Cp), then obviously sea temp is also known for all sea global locations and for all sea depths. Therefore, deriving the above OWASL temperature is 'doable'.
If sea OHC has continually & steadily been rising, and since this mass x Cp is 93% of the total mass x Cp of the globe, then obviously if a OWASLT was reported, then it would also be steadily climbing year after year on the same steady rate (even during the last 10 years when the rate-of-rise of surface-only temps was less than the 1990's). Having such a metric would remove all doubt that comes by only looking at the surface-only temp. And remove all contrarian ammunition, because there would be no hiatus in temperature rise using a metric like this.
Does anyone calculate & report an OWASL temp like this as their single, all inclusive metric number?
-
scaddenp at 11:03 AM on 1 May 2015The climate 'hiatus' doesn’t take the heat off global warming
Dont take this as gospel but I think it more complicated than that. An absolute OHC doesnt make a lot of sense. With respect to what? Absolute zero? freezing temp of water? What would you do with this number?
What I believe is actually calculated is change of temperature against the average of 1955-2006 temperature. The delta temperature plus heat capacity of seawater is then used to calculate OHC. This is a useful number.
-
Ken in Oz at 10:28 AM on 1 May 2015The climate 'hiatus' doesn’t take the heat off global warming
The ups and downs, pauses and accelerations come from surface air temperatures being a consequence of sea surface temperatures, which are variable over decades due to ocean currents, overturning - ie things like ENSO, PDO. Warming overlays this variability.
But, presuming I read the article correctly, if we are waiting for the "hiatus" to end in a hockey stick, it will probably be after PDO shifts phase? I suggest - based on Foster and Rahmstorf's "Global Temperature Evolution" - that even a 'less likely due to PDO' el Nino or two will send us into record temperatures even without that shift. A positive PDO will just make the upturn more short term consistent and steeper.
-
WxChief at 09:40 AM on 1 May 2015The climate 'hiatus' doesn’t take the heat off global warming
scaddenp - Is there an accepted value for the average 1955-2006 OHC?
-
KR at 09:20 AM on 1 May 2015Climate sensitivity is low
Scaddenp - We do have XBT data below 700m, just rather less of it. Which is how the ocean heat content analyses going back to the 1950s have been done.
-
scaddenp at 07:43 AM on 1 May 2015Climate sensitivity is low
Klapper - you are proposing to ignore OHC pre-Argo because there is only data to 700m. However, if you wish to postulate that the huge change in OHC 0-700m does not mean energy imbalance, then you must also be proposing that there could somehow cooling of the 700-2000 layer to compensate for warming in the upper layer.
I would also be interested in your opinion on the Loeb et al 2012 paper in claiming that models and observations are at odds.
-
scaddenp at 07:32 AM on 1 May 2015The climate 'hiatus' doesn’t take the heat off global warming
WxChief - please note the OHC quoted is actually change is OHC since baseline (average of 1955-2006). There is very sparse data below 2000 but given mixing mechanisms available, it is not expected to be large. Furthermore it is constrained by steric sealevel rise (the Trenberth 2009 paper looked at this accounting exercise).
-
scaddenp at 07:19 AM on 1 May 2015The climate 'hiatus' doesn’t take the heat off global warming
Ryland, please accept my humble apologies for the "well duh". As a some time moderator on this site, my fault was doubly bad. It was an unfortunate knee-jerk reaction to what appeared to me as a straw-man argument.
-
WxChief at 06:14 AM on 1 May 2015The climate 'hiatus' doesn’t take the heat off global warming
The ocean heat content graphic shows an increase over about 50 years of about 30x10^22 Joules for the top 2 km. What percent is this of the total? Is there an estimate for the total heat content of the ocean?
Prev 583 584 585 586 587 588 589 590 591 592 593 594 595 596 597 598 Next


