


 Arguments


Recent Comments
Prev 590 591 592 593 594 595 596 597 598 599 600 601 602 603 604 605 Next
Comments 29851 to 29900:
-
Andy Skuce at 09:08 AM on 12 April 2015The history of emissions and the Great Acceleration
eksommer @18
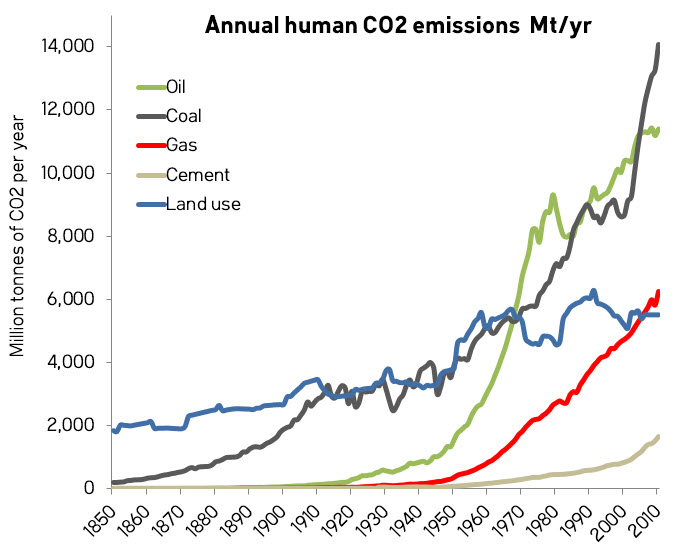
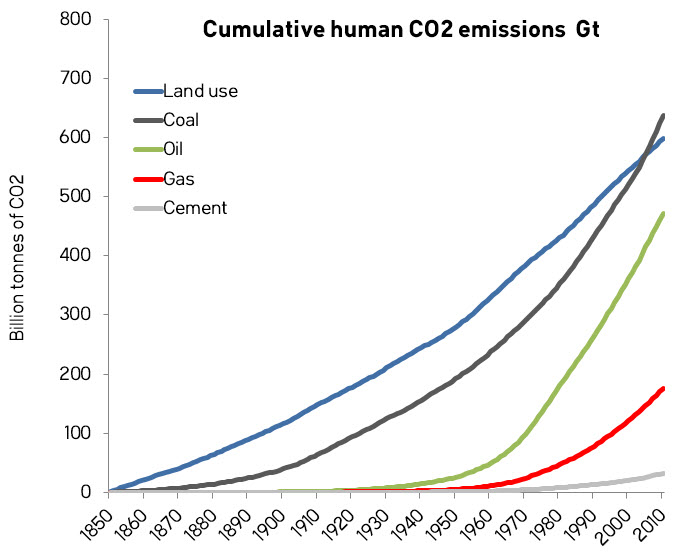
You are correct that stacked graphs can be misleading. So, here are annual emissions and cumulative emissions graphs, unstacked. There are things that jump out of these graphs that are not obvious in the ones I presented. Thanks for the suggestion.
-
Andy Skuce at 09:02 AM on 12 April 2015The history of emissions and the Great Acceleration
mdenison @19
Here is a plot showing year-to-year changes in the emissions rates. The blue line jumps around a lot, so I applied a 10 year trailing filter (ie, the 2010 figure is the average of 2001 to 2010).

There seems to be a jump after about 1950 where the annual rate of increase in emissions is roughly 400-500 million tonnes of CO2 per year. Before 1950, the change was 0-200, roughly speaking. I think that's a real step change.
Now, you might argue that what matters is not the actual growth rate but the percentage rate of growth, You would be right, an economy growing steadily at 2% per year would grow faster in dollar terms the bigger it got.
Let's look at some curve fits, before and after 1950.

I fitted an exponential curve to emissions between 1850 and 1950 and extrapolated it to 2010. I think it's obvious that this would have under estimated growth in emissions for the next 60 years. The last curve in my post showed a linear rather than exponential extrapolation, which assumption, you are right, did exaggerate the effect of the Great Acceleration. But I think it's clear that the Great Acceleration is still a real phenomenon.
For the 1951-2010 period, I found a linear function fitted best. Although I just argued that growth should ideally be exponential rather than linear, I think that applies to the economy, but not necessarily to emissions. There have been improvements in the efficiency of fossil-fuel usage and, although there is an undoubted correlation between fossil-fuel use and economic growth, increasing fossil-fuel combustion has not been the only factor driving the economy.
-
scaddenp at 07:18 AM on 12 April 2015Global warming hiatus explained and it's not good news
Lets run some numbers shall we. Specific heat of basalt is 0.84J/gK. Assume is deposited very thinly and so can cool from 2800C to 10C in decades. To get a change of 3E30 in OHC from this basaltic lava cooling we need 3E30*2790/0.84 g of lava. With a basalt density of 3.0, that would translate into an increased volcanic outflow of about 3E11 cubic kilometers of basalt, or around 8E9 cubic kilometers per year, 8E8 Mt pinatuba per year. I think we would have noticed.
-
scaddenp at 06:56 AM on 12 April 2015Global warming hiatus explained and it's not good news
"[El Nino, for example, by itself releases 10 to 20 cu.km of lava near the Eats pacific Rise, let alone that released elsewhere. This is yet to be shown there.]"
Can we have a cite for evidence of this please. Especially change in volcanic output between el nino and la nina?
Also, Ocean heat content has increased by 3E23J since 1970. Entirely consistant with CO2 increase. Most of this heat accumulation in top 700m with gradual warming in top 2000m, nothing much happening in depth (where you claim the heat is coming from). Furthermore the spatial distribution of this heat accummulation is in no way correlated volcanic ridges. Heat transfer between ocean and atmosphere is also entirely consistant with El nino warming.
-
Tom Dayton at 03:27 AM on 12 April 2015Models are unreliable
Rhoowl claimed "the cmip5 models produce a wide range of results with a large error. the models are off what real world temperatures indicate. just looking cmip5 ar4 model graphs compare to real world temperature it appears that the models are more than two standard deviations off."
Multiple people have explained to you that your particular interpretation of the model results as "error" is incorrect. It appears that you continue to refuse to read explanations of what the model results actually are, and what the models actually are. To start with, you absolutely must read the Intermediate version of this "How Reliable Are Climate Models?" post. When a bunch of people on SkS tell you that you don't understand something, it is your responsibility to make at least the effort to read all of the original post on which you are commenting; some posts have Basic, Intermediate, and Advanced tabbed panes. If you don't trust what those blog posts say, I applaud you for your skepticism as long as you then read the peer reviewed original publications that those posts cite.
One source of variability in GCMs' results is differences in the models' constructions, not just their parameters. The CMIP5 ensemble of models is just that--multiple models, created by multiple people using different approaches. Those differences in models' constructions are not weaknesses! They are intentional--think of them as replications of experimental setups. Robust "replication" does not mean just rerunning an experiment with exactly the same setup. Instead it means running an experiment differently as long as, in principle, the results should be the same. Using differences in experiment construction and running is a test of whether the orginal experiment's results really were due to the posited phenomena or were due to otherwise uninteresting quirks in the experiment. Likewise, having differently constructed climate models safeguards against any one model's results being due to quirks in that particular model.
A good place to start learning about verification & validation (V&V) of climate models is at Steve Easterbrook's blog Serendipity. Steve is a computer scientist and engineer who used to be the chief scientist at NASA's independent V&V center, now is a professor, and does climate research. He has a good recent video of a TED talk (you should read the text surrounding that video on his blog), a short but good description of V&V, and a short description of massive and thorough comparisons of the outputs of 24 climate models. You would benefit from reading other posts of his that you can find by using his blog's Search field to look for "verification" or "validation."
Also useful for you to read is Tamsin Edwards's series of four short blog posts the links to which are near the top of her post Possible Futures.
Of course the bottom line is whether all those different models' results are the same. But "the same" does not mean "exactly the same." There is no absolute definition of "the same." Not 1 in 10,000. Not 2 standard deviations. Not 20%. This is true not just in climatology, but in every field. All models are wrong, but some are useful. For example, if you are trying to discover whether a drug helps an illness, and every experiment testing that shows it does not help, then it doesn't matter that some experiments show it makes no difference and some show it makes the illness worse. For the purpose of those experiments, the unanimous, sensible conclusion is that you should not give that drug to anyone with that illness.
It is necessary to define "the same" climate model results as "similar enough to suit the purpose to which these models' results are being put." But that's a topic for a future comment. First please address, narrowly, what I've written here.
-
Tristan at 02:49 AM on 12 April 2015Models are unreliable
I do not see any climate science credentials. Climate science modelling is a multidisciplinary topic, and as far as I can tell, Dr Hoffman has never published in the field of climate science. He only possesses one piece of the requisite expertise, and presents an opinion on a blog (and hence is not subject to the rigours of peer review and the scrutiny of others in the field).
On the other hand, we have papers like Risbey et al. (2014) that discuss the very topic at hand.
My question to you is this: Why do you eschew the published material on the topic and get your information from sources without the credibility that comes from working in a particular field? -
Rhoowl at 02:22 AM on 12 April 2015Models are unreliable
tristan
here are the credentials of doug l hoffmann..blog originator
http://theresilientearth.com/files/dlhoffman.html
the man is highly qualified to evaluate computer models. you have to understand the the people who are writing and operating the programs for computer models are not climate scientists.
the field requires experts in many areas and not one person can be expert in all of them.
please present an argument addressing the issues cited
Moderator Response:[JH] You are deluding yourself if you believe you know more about Global Climte Models (GCMs) than the commentors who are attempting to educate you on this thread. Please cease making dispariging remarks about their knowledge. If you do not, you will quickly relinquish your privilege of posting on this website.
-
Tristan at 01:49 AM on 12 April 2015Models are unreliable
I was unaware that reading blog posts by people who aren't climate scientists was considered research. Maybe you should read some actual papers.
-
Rhoowl at 01:03 AM on 12 April 2015Models are unreliable
I'm sorry about getting off topic..you're correct...however...i'm not the only one who is doing this for the responses. btw..you only win the argument if you convince the other person that they are wrong.
anyhow...after doing some more research...i ran into the article...
http://theresilientearth.com/?q=content/climate-models-%E2%80%9Cbasic-physics%E2%80%9D-falls-short-real-science
this is another view that is along the lines of what i have been exactly saying. my experience in modeling agrees with everything that is said in the article. and scientist need to explain why what is being said in this article is not correct. it didn't even touch on the dreaded (actually a serious problem) divide by 0 which is all to common in computerization of real world models.
the cmip5 models produce a wide range of results with a large error. the models are off what real world temperatures indicate. just looking cmip5 ar4 model graphs compare to real world temperature it appears that the models are more than two standard deviations off. I wanted to calculate this...but I was unable to find the necessary data to do so. if someone knows how to get this data or and some analysis of this i would very much like to review this.
if it is more than 2 standard deviations off this means that the math is questionable or the theory is questionable.
if the models produced a nice error i think 20% is acceptable..and the real world temperatures were following this within 2 standard deviations then this would significantly increase your confidence level. as things stand right now i do not have any confidence that the models results are accurate or properly represent the theory or math.
Moderator Response:[Rob P] - Climate models show remarkable agreement with recent surface warming once natural variability and unanticipated changes in external forcings (such as increased volcanic sulfate aerosols) are taken into account.
-
Tom Curtis at 19:14 PM on 11 April 2015Global warming hiatus explained and it's not good news
Peter Carson @11:
1) The map I showed includes heat loss from young sub-ocean crust and sub-ocean hotspots, and ergo includes heat loss from the associated volcanism.
2) grindupBaker's calculation included 1000 K for temperature loss, not for the the initial temperature. Given that the abysal temperature is around 280 K, that means he was assuming magma temperatures 1280 K, so that adjusting for your increased temperature estimates makes little difference to the result. On the upper bound, it only increases the value by 25%, and 125% of effectively zilch is still effectively zilch.
3) Of more concern is that he included only lava volume, not total magma volume which is about 10 times greater (see link below, or the page he linked to). Adjusting for that brings the estimate up to 0.07 zettajoules (for your upper bound temperature). That compares to the 1.14 zettajoules per annum for young ocean crust (from the first link). Ergo even if direct volcanism were not included in that estimate, it would only increase the heat flow estimates in mid ocean ridges by 6%. Well within error and ergo inconsequential.
4) More troubling, El Nino is not a volcanic event of any description, and ergo cannot have an associated lava flow. It certainly cannot have an associated lava flow equal to approximately half of the global magma deposition (subarial and subocean). Further, unlike your made up figure, actually observed figures for volcanic extrusion in the Galapagos rise put it at around 0.002–0.13 km^3 per annum. As with your false, and unjustified claim about what has or has not been included in GCMs, your made up claims continue to embarass you (or would if you had any shame).
5) I went to your poorly organized site, and was unable to find any links to relevant calculations. I did, however, find that you claim that changes in CO2 level can have not effect on the global heat budget because "CO2 is saturated". In terms of scientific knowledge and reasoning, that would put you below average at an anual meeting of the flat earth society. Therefore I see no point in extending this conversation.
Moderator Response:[TD] Peter Carson, see the SkS post "Is the CO2 Effect Saturated?" After you read the Basic tabbed pane, read the Intermediate and then the Advanced tabbed panes.
-
Tristan at 18:33 PM on 11 April 2015Global warming hiatus explained and it's not good news
Oh man, popcorn time.
I love it when someone decides they've figured it all out but no one will publish them because gatekeepers, so they come to Sks (kudos, Peter, brave of you) and proceed to explain what those silly climate scientists missed. To actual climate scientists.
-
Peter Carson at 18:15 PM on 11 April 2015Global warming hiatus explained and it's not good news
grindupBaker & Tom Curtis. [BTW Basalt lava is typically 1400K to 1600K, rather more than your 1000K or even C.]
I’m well aware of the diagrams of global heat presented. However, they show only the estimated average heat released during quiescence, ie no eruptions when most heat is released. The diagram severely underestimates volcanic heat released.
Yes, I’ve done some calculations, some shown on my site pjcarson2015.wordpress.com
You will also see what causes the larger cyclones, etc.
[El Nino, for example, by itself releases 10 to 20 cu.km of lava near the Eats pacific Rise, let alone that released elsewhere. This is yet to be shown there.]
Try working it out yourself, then give a calm response.
Hint: rate of divergence x height x length of all divergent plates. Convergent plates give an extra ¼. That’s a lot more than the estimate of 3 cu.km to which you are referring.
-
grindupBaker at 16:56 PM on 11 April 2015Global warming hiatus explained and it's not good news
I forgot to format my spreadsheet for posting, especially column headings but really what does it matter when responding to such thoughtless empty anecdote as that at #6.
-
grindupBaker at 16:53 PM on 11 April 2015Global warming hiatus explained and it's not good news
@Peter Carson:
3,000,000,000 m**3 / year total annual volcanic lava flow (http://volcano.oregonstate.edu/book/export/html/138)
from an estimated "more than a million submarine (underwater) volcanoes"
"The lava is basalt. Hawaiian basalts contain about 50% silica, 10% each of iron, magnesium, calcium, about 15% aluminum" from some place I've forgotten.
1000 Kelvin lava temperature dropannual lava volume density annual lava mass thermal capacity annual heating
m**3 kg/m**3 kg J/kg.K Zettajoules
50% Silica 1,500,000,000 2,648 3,972,000,000,000 710 0.00282
15% Al 450,000,000 2,700 1,215,000,000,000 910 0.00111
10% Ca 300,000,000 1,550 465,000,000,000 630 0.00029
10% Fe 300,000,000 7,874 2,362,200,000,000 450 0.00106
10% Mg 300,000,000 1,740 522,000,000,000 1050 0.00055
5% traces 150,000,000 3,302 495,360,000,000 750 0.00037
100% Total 0.00583I compute that a total of ~0.00583 Zettajoules / year heat is added into the deep oceans at the sea bed by the annual 3 cubic kilometers of volcanic lava flow at an assumed average temperature of 1,000 degrees.
Current analysis is that 13.7 Zettajoules / year heat is added into the oceans from the surface down by the residual radiative imbalance
Thus, surface-down heat added = 2,350 times as much as volcano heat.Also, just to hammer on the utter silliness of this "volcano heat" nonsense, note that the estimate of all geothermal heat is 0.085 w/m**2 (though not known very precisely) which is 1.37 Zettajoules / year. Thus, regular dull geothermal heat seeping up through the land surface and the sea bed is 1.37 / 0.00583 = 235 times as much as volcano heat. I expect that modellers would include this minor but not trivial heat, perhaps somebody else would confirm. The "volcano heat" nonsense is, quite frankly, extremely ignorant and it is beyond lazy not to at least attempt a 1st-order perhaps flawed approximation of the reference quantity for discussion as I have done. It is sadly indicative of a certain group of people that they vastly prefer anecdote and hyperbole to some attempt at analysis.
Moderator Response:[Rob P] See also this SkS rebuttal by Andy Skuce - Heat from the Earth’s interior does not control climate.

-
Tom Curtis at 16:37 PM on 11 April 2015Global warming hiatus explained and it's not good news
Peter Carson @6, if it were true that the effects of under sea volcanism "has never been included in climate or weather models", then logically you could not know that their inclusion "would seem to be the solution to a number of problems". In fact, you are only guessing, and probably guessing on poor information, that that is the case.
What is known about under sea volcanoes is that nearly all of them are found along mid-ocean ridges where eruptions are small scale and more or less continuous. They are, therefore, unlikely to have changed their effect (whatever it is) over the last century or two.
We also know that even over those ridges, the warming effect is less than (typically much less than) the TOA energy imbalance so that changes in that warming effect are likely to be very small relative to that imbalance. We also know that the water column makes an excellent insulator so that any such changes will have minimal impact on surface temperatures.
Finally, it is in fact not true that sub-ocean geothermal heat has never been included in GCMs. In fact such studies have shown that inclusion of sub-ocean geothermal energy increases the motion of abyssal currents, thereby better modelling the distrubution of C14 in the oceans. It is, however, not the only candidate in that role. Nor, I suspect, is the distribution of C14 in the ocean the type of "problem" (I suspect) you had in mind.
-
grindupBaker at 15:03 PM on 11 April 2015Global warming hiatus explained and it's not good news
The statement "...increase in the strength of trade winds...in the Pacific Ocean had pushed warmer surface waters deeper, having an overall cooling effect on global surface temperatures" in posting, which is the phrasing that I see universally, is incorrect as I understand it. Not quite the converse, but it's tangential. The actual reason is that cooler, deeper water is brought to the surface by the trade winds, not that warm water is being pushed into the western Pacific Ocean. Cooler Pacific Ocean surface water (except that western portion) lowers GMST by two means (1) reducing the average temperature proportional to its surface area (2) reducing the heat quantity that it would otherwise have transferred elsewhere, thus reducing surface/air temperature elsewhere also. I understand that you'all and scientists know that the two events are inextricably linked in Pacific Ocean but it's still illogical to make the leap and directly attribute partial suppression of the GMST anomaly to heat being pushed into ocean. I think it invites disbelief. Again, it's cold water rising, not warm water being pushed below the surface, that reduces GMST anomaly, thus stop saying that GMST did not rise much because heat got pushed into oceans instead.
Moderator Response:[Rob P] - It's a bit of both. This can be seen in the change between El Nino and La Nina years. Note the storage of ocean heat below the surface in La Nina years (2007-2008 & 2010-2011), and the corresponding change in global surface temperature (black line). Image from Roemmich & Gilson (2011).

-
Peter Carson at 14:12 PM on 11 April 2015Global warming hiatus explained and it's not good news
“Volcanic eruptions generally cool the planet's surface.”
True only for terrestrial volcanic activity. There is up to 9x more undersea activity, warming the ocean directly and has no cooling ash; it has never been included in climate or weather models. If included, it would seem to be the solution to a number of problems. After all, if one omits a significant parameter, one will experience problems in matching data to theory.
-
Glenn Tamblyn at 10:57 AM on 11 April 2015The history of emissions and the Great Acceleration
mdenison
Agreed, if one does a simple growth rate calculation for the total emissions rate from Andy's first figure one does get around 2%. However the mix of contributions don't all individually appear exponential. Land use looks linear, coal might be exponential, oil harder to judge.
Equally there is a visible inflection point around the end of WWII, and possibly another around 1910. Was there an underlying growth rate that was suppressed during the Depression/Inter-War years and recovered after the war? Or is the CO2 emission rate a composite of multiple independent factors - population growth rates and changes in that, developments in medicine etc that fed into that, technology changes, economic developments etc.
Just because the cumulative impact of all these factors is roughly exponential, it doesn't follow that there is an underlying single driver of this apparent behaviour. Individual drivers can show 'accelerations'.
-
mdenison at 10:39 AM on 11 April 2015The history of emissions and the Great Acceleration
Although I agree with much of your article I think you overstate an acceleration in CO2 emissions. My own look at the cdiac data show that CO2 emissions from fossil fuels, cement and land use change have grown at about 2% per anum since the mid 19th century. Wars, boom and bust hardly affect this and although different fuels emissions grow at different rates at various times the collective rate always averages out at about 2%. This growth rate can be seen in the atmospheric data from the Law dome and the Keeling curve; also showing CO2 additions growing exponentially at about 2%. Did fossil fuel consumption go nuts? No. I see no great change circa 1950 just the business as usual exponential growth of 2% before and afterwards. It is still about 2% today.
-
Rob Honeycutt at 08:02 AM on 11 April 2015CO2 is not the only driver of climate
Just to simplify a little here...
CO2 is a long-lived, non-condensing greenhouse gas that is well mixed from pole-to-pole and through the full column of the atmosphere.
H2O is a short-lived, condensing greenhouse gas that freezes out at higher latitudes and altitudes.
-
Klapper at 06:02 AM on 11 April 2015Global warming hiatus explained and it's not good news
"This pause is projected to end in the near future as temperatures resume their upward climb."
This comment is the final sentence from from the editorial summary to the Steinman, Mann & Miller 2015 paper in Science. However, it conflicts somewhat with Mann's quote at RealClimate.org from the conclusions of the paper:
"Given the pattern of past historical variation, this trend will likely reverse with internal variability, instead adding to anthropogenic warming in the coming decades."
Which is it: "the near future" or "coming decades"? The answer to that question, which has serious ramifications for global warming policy change, depends on whether you believe the PDO/AMO operate in 60 to 70 cycles or not. If you do, then the answer is likely "coming decades" before the repression of the anthropogenic signal by the NMO is relieved.
-
michael sweet at 05:17 AM on 11 April 2015CO2 is not the only driver of climate
Climate Tool:
As was pointed out upthread, the IPCC reports, and various others, are compendia of cross discipline results. Your suggestion that cross discipline analysis is not done in AGW is simply false. Please cite a major summary report that does not contain results from multiple disciplines.
The SkS team has a variety of opinions, often different. You should be more specific in your question. About water vapor specificly, which appears to be your question, without asking I dare say everyone agrees H2O is an important greenhouse gas. It contributes a large fraction, or a majority of the greenhouse effect. Everyone knows this.
Water vapor concentration is dependent on the CO2 concentration. CO2 is not dependent on water vapor. This means CO2 is the temperature control knob. Future temperature changes (and water vapor changes) will follow the CO2 changes.
-
mbryson at 04:07 AM on 11 April 2015Global warming hiatus explained and it's not good news
The question makes pretty good sense to me— it's really about the exchange of heat between oceans and atmosphere; since that's a slow process, with shifts in trend depending on how much deep water reaches the surface, how much heat it absorbs there and when/whether it returns to the depths, how much that accumulated heat reduces later cooling effects when (now warmer) deep water returns to the surface, etc. In the short run this is about currents and oscillations: in a fictional world where the oceans overturn in a rapid, steady way with high transfer rates between atmosphere and rising cold water they could delay surface warming for a long while. In the real world, equilibrium is a long way away and the temporal pattern of surface warming will vary with shifts in ocean heat uptake— careful observations can clarify what's happening, and modelling and retrospective considerations can help us to anticipate possible future variations in the underlying process of warming driven by the net energy imbalance...
-
CO2 is not the only driver of climate
ClimateTool - Ah, that makes sense; perhaps asking what the "SkS team" is thinking would be a less ambiguous terminology.
However, I'm a bit confused as to what assertion you are standing by? You've just asked a couple of questions...
-
ClimateTool at 03:28 AM on 11 April 2015CO2 is not the only driver of climate
KR
My apologies - I meant no such thing. My goal was to ask for the concensus of the team members as listed in the "About" section. I shall avoid such faux pas in the future.
I do argue however that organizing various disciplines does occur on a regular basis. Having been involved in both operational and field level research I have been fortunate enough to work with geologists, physicists and agronomists on Climate Change issues.
Perhaps my naivete is showing through. But I stand by my ascertion.
Thank you for your responses.
Moderator Response:[DB] "concensus of the team members"
While consensus is important, what really matters is what the evidence itself shows. Consensus of opinion does not replace evidence and physics.
If you have questions on the evidence and the physics of the science, please use the Search tool to find the most appropriate thread on which to place them (after reading it and the comment thread underneath the article). Thanks!
-
Stephen Baines at 02:25 AM on 11 April 2015CO2 is not the only driver of climate
"..organizing scientists across multiple fields, countries, and decades to argue against the facts would be like herding ADHD cats."
I would add "...away from a field of open tuna cans." Such an effort would be asking those scientifickyADHD cats to sacrifice their own professional self interest.
Why would they not chose to make a name for them selves by picking low hanging fruit and bucking an obviously false paradigm? Makes no sense.
-
bozzza at 00:26 AM on 11 April 2015Global warming hiatus explained and it's not good news
I don't think the question can be answered as it seems to assume that heat belongs in the atmosphere.
I do like the question however as it reminds us that there is no such thing as a bad question..., unless I suppose it were non-sensical but that would have to be proved by the person answering it. This is teaching: alright!!
What is a 'blob'? A system description no doubt... how would one measure this system and what sort of measurements would one take of it if they could?
Oh how consensus orientated science is..!
-
John Hartz at 00:02 AM on 11 April 2015Models are unreliable
Rhoowl:
Read my lips...
The Dutch, who know something about protecting their land from the sea, do not seem to be waiting for futher refinement of Global Climate Models to take action. [My bold]
Your propensity to move the goalposts sideways when responding to someone is not an acceptable behaviour on this site.
-
CO2 is not the only driver of climate
ClimateTool - One side note: your use of the capitalization in "...what is the Teams sense..." is often a shibboleth of pseudo-skeptics; tied to conspiracy theories that have a 'Team' of scientists somehow organized to deceive everyone else, usually for some vague sort of world domination.
Which is silly - organizing scientists across multiple fields, countries, and decades to argue against the facts would be like herding ADHD cats. Just not possible.
If you are actually interested in the topic of climate change, and (particularly for this site) various myths about it, I would suggest avoiding terminology with implied insults.
-
dr2chase at 23:46 PM on 10 April 2015Global warming hiatus explained and it's not good news
When heat is "buried" in the ocean, from an atmospheric POV it is sent into the future — I assume that the buried blob of hot water mixes over the years and becomes a much larger blob of less-frigid deep water. Do we have any sort of a wild guess as to how far into the future that will be? How long before that less-cold blob recirculates back to the top as a less-chilling upwelling, and where?
-
DSL at 23:20 PM on 10 April 2015CO2 is not the only driver of climate
ClimateTool, I'm going to expand a little on CBDunkerson's second point. The lack of cross-discipline discussion is a complaint I often hear from people in genuine doubt and from fake skeptics. The complaint is a sure sign that the writer or speaker hasn't engaged the science in any meaningful way. After all, if one wants to know what the relevant science says, but doesn't want to wade through tens of thousands of publications, all one has to do is go to a summary of the existing relevant science.
That's what the IPCC AR5 is. It's a summary of the relevant science. It was written by ~850 scientists, regular publishers in their disciplines, who were not paid for their work. It directly references 20,000+ publications, and tens of thousands more by proxy. It went through multiple rounds of peer review that generated 150,000+ comments.
You complain that little cross-discipline discussion takes place, but the second section of AR5 (Working Group 2: Impacts, Adaptation and Vulnerability) is nothing but cross-discipline collaboration to summarize thousands of interdisciplinary studies. I don't mean to suggest that the other WGs are not interdisciplinary, for they are, but WG2 is obviously so.
And (speaking to your other complaint about consensus) the IPCC assessment reports represent the consensus of evidence. If you are serious about understanding the problem, the well-organized AR5 is the place to start. SkS welcomes both questions and informed discussion.
-
CBDunkerson at 22:41 PM on 10 April 2015CO2 is not the only driver of climate
ClimateTool, in addition to the posts pointing you to other sections of the site, short answers to your questions are;
1: The amount of water vapor the atmosphere can hold is directly tied to atmospheric temperature (e.g. "relative humidity" is the amount of water vapor in the air relative to the maximum amount possible for the current temperature). Thus, temperature increases from CO2 will lead to more water vapor... and corresponding additional warming. Thus, water vapor is a significant positive feedback in global warming, but cannot 'initiate' the warming itself.
2: Your question itself contains a fallacy. There is no conflict between, "'Science by consensus' versus the time tested steps of the Scientific Method". There is concensus on AGW because application of the scientific method over the course of the past 100+ years (since Arrhenius proposed the AGW theory in 1896) has overwhelmingly shown it to be accurate. Nor is there any "lack of cross discipline discussion". Oceanographers, botanists, zoologists, astronomers (studying atmospheres on other planets), and scientists in various other fields have all independently found evidence matching what climatologists have shown.
-
Ken in Oz at 11:25 AM on 10 April 2015Global warming hiatus explained and it's not good news
The "Hiatus" will end in a hockey stick - just an el Nino or two is going to do that given we've already hit record temperatures in ENSO neutral conditions.
Going up and not coming down - in a world where not-warming means up and down in equal measure - is exactly what warming looks like. Actually, going up and not coming down is a sign of strong warming and the science rejector's minimum warming to count as warming - temperatures going up and going up more - would be extremely strong warming.
-
Rhoowl at 09:59 AM on 10 April 2015Models are unreliable
Wow so many posts...I see most of you guys are scientists....
JH the Dutch are more susceptible to sea level rise than any other country. something like 1/2 of the country is below sea level...a lot of their dykes, dams and polders have been there for 500 years or more. So they design for those types of timeframes. A 1m sea level would stress all of the dykes and dewatering systems.
[TD: Please keep the conversation going, by directly answering questions and by responding in ways that are directly relevant to the topic of this original post ("Models are Unreliable"). In the above paragraph you have agreed with John Hartz, but have tried to not admit it. Please directly admit you agree with him, but specifically on the topic of the utility of climate models. If you actually disagree with his specific point about the utility of climate models, say so explicitly and explain, directly, why.]
Scaddenp
DSL why do you have to reduce co2 emissions. Co2 emissions have been regularly increasing. You have to figure that the govt of the world will not come to an agreement to reduce co2. Why not focus on other areas like bioengineering plants(specifically algae) to use the increased levels of co2. They'd have such an advantage theyd quickly overtake plants that have evolved to survive a max 300 ppm atmosphere. How much money is spent on this? Why not push for nuclear ( I'm not a huge fan of this But I can live with it
Why not push for technologies to replacing the internal combustion engine. Hydrogen fuel cels are looking promising. Fusion is starting to look promising with ITER Why not push the govt to develop our own tokamak.
it not inconceivable by 2050 having fusion reactors produce hydrogen to power vehicles.
Instead ad the goft want to tax carbon with no specific plan to actually reduce co2. The govt wants to promote solar and wind......solar and wind should be considered dead end.....reliability, storage, ecological problems. I think solar might actually cause more global heating than eqivalent co2. Think about it.....a solar is placed over the ground....the energy is sent into my home. Heats my house. Heat goes into the ground beaneath the house for slow release. Where the panel is it kills the plant life beneath and co2 reduction is reduced.
[TD] The paragraphs I've struck through are very much off topic. You are giving the appearance of deliberately attempting to avoid admitting you are wrong. It's called the Chewbaca defense. There are posts here on Skeptical Science that are relevant to those comments. Use the Search field at the top left of this page.]
Td td the guidelines for the design would never be left at the town level. you'd have an organization ASCE (american society of civil engineers) working working with scientists making the decision. The ASCE is responsible for all structural design building guidelinEs in the coUntry.
[TD: You have avoided addressing the actual point that is relevant to this "Models are Unreliable" post, by skipping off into a different topic.]
Moderator Response:[TD] You have veered way off the topic "Models are Unreliable." Please comment on appropriate threads. At the left side of this page, click the "View All Arguments..." link to find relevant arguments, and lower on the left side of this page look at the list of Latest Posts, and then click the Archives link at the bottom of that list. Off-topic comments on this thread will be deleted.
Everybody else: Please support your local moderator by putting any of your replies to the off-topic comments on appropriate threads, and posting a short comment on this thread linking him/her to you appropriately-placed comment. (Right-click on the date/time stamp of your appropriate placed comment to get a link to it.) Thank you for your support.
-
chriskoz at 08:23 AM on 10 April 2015The global warming 'pause' is more politics than science
To top up the pile of arguments rebuting MartinG's claim, it's worth noting that UAH temp set Martin bases his claim on, is not only inaccurate, plagued my many biases and corrections (we are talking v5.6 here, how many more corrections/versions are we going to see in the future?), but above all UAH temp set is about lower troposphere temperature.
But we are not living in the troposphere, so who cares about it? We are living at the surface, so the GW at the surface is the one we should be concerned about.
Further, radiative models predict that atmospheric warming in response to GHG increase is not uniform: strongest at the surface, decreasing as the hight increases, and finally as you reach the stratosphere, the effect becomes opposite: lower stratosphere is actually cooling! That effect is confirmed by all 3 data sets from UAH. Trying to cherrypick one of those (TLT set) to argue the "GW has paused since 1998" is just pathetic ignorance. With proper understanding of science, one can clearly see that any TLT set is expected to show smaller warming than any surface temperature set. Not to mention high inaccuracy of UAH sets. So, even longer than usual time interval in this set is needed to confidently say anything about its trends.
-
MMM at 06:24 AM on 10 April 2015A revealing interview with top contrarian climate scientists
Sorry for the double posting! And thanks to Tom Curtis for the other table. I do remember when CCSP 1.1 came out in 2006 that the satellite correction (presumably the 2005 one in Tom's table) was big news...
-
MMM at 06:18 AM on 10 April 2015A revealing interview with top contrarian climate scientists
I have one critique of the Evolution of UAH trends chart: it confounds changes due to adjustments and changes due to changing trends over time. I would replace the dashed "current" line with datapoints for trends using current data for each of the years shown (e.g., 1979-1995, 1979-1998, etc). Using woodfortrees, LINK, I get:
1995: ~0
1998: 0.04/decade
2001: 0.1/decade
2005: 0.13/decade
all data: 0.13/decade
I know the woodfortrees UAH data is UAH5.5, not 5.6, so ideally one would repeat this with the latest dataset, but I think it shows that the revisions to the UAH data have indeed led to an increase in the trend, but that also the trend has increased over time due to more warming.
-MMM
Moderator Response:[RH] Shortened link. Think we can get you to start using the embedded link tool? It's on one of the tabs at the top of the comment box.
-
Models are unreliable
Rhoowl - "So having a range if sea level rise would not be useful. You need to know what it is."
Knowing a range of risks is sufficient to evaluate risk avoidance - fire insurance is an excellent example. You don't know if your house will or won't catch fire, if it catches fire you don't know how much damage that might cause, yet you buy fire insurance to cover the likely range of damages. That span of damages is not an error, but rather the bounds on risk. The same holds for sea walls, and in fact for every other consideration of risks vs. benefits.
Back on topic - the models are quite good within their stated limits: 30 year or so projections of the average climate response due to stated forcing changes, with bounds determined by climate variability. Your insistence on 1/10,000 risk levels, and in fact your treatment of climate models (boundary problems) as weather models (initial condition problems) are IMO demands of impossible expectations.
-
CO2 is not the only driver of climate
ClimateTool - Regarding consensus, I would suggest following Daniels excellent suggestion, and looking at threads using the Search box on the upper left.
-
Tom Dayton at 05:09 AM on 10 April 2015Models are unreliable
Rhoowl claimed "So having a range if sea level rise would not be useful. You need to know what it is."
Suppose you are an engineer hired by the town of NearlySubmerged to design a new seawall to protect it in the year 2100 to the same degree the old seawall protected the town when it was built in 1900. (The town is not in Florida, where for most shores the porous land allows the water to seep under the seawalls.) Think of Superstorm Sandy and New York City.
The town already has made some of the decisions that I described in my previous comment. The town has decided that they want the risk that they had in the year 1900. The town did not look up that risk level in an engineering book. That risk level is not "standard." It is not objectively calculated. It is a choice by the town. They could have decided differently, for example to preserve the risk they have today, in 2015, which is considerably higher than the risk they had in 1900.
Even with that information, you still need to know the projection of sea level rise by 2100. You cannot make that decision by yourself. You must ask the town for their choice of which IPCC emissions scenario they prefer to assume will come to pass. Then given that chosen emissions scenario, you must ask the town whether they want to use that sea level projection's mean value, or its range's 95% upper bound, or its range's 95% lower bound, or some other value. (To simplify this example, let's skip you asking the town to choose a projection of storm surge changes by 2100.)
Only with all that information can you then design the seawall.
But the town will balk at making any of those decisions, because those decisions are subjective. They will ask you, as all savvy shoppers do, to present them with the cost of constructing each design to meet each of those projected sea levels. To shorten your task, probably you will first design for the sea level at the top of the 95% range of the most emissive of the emissions scenarios, and for the one at the bottom of the 95% range of the least emissive of the emissions scenarios. You might discover that the difference in cost of those two extreme designs is so small that the town feels it is well worth the cost to design for the highest projected sea level. But probably that cost difference will be large enough that the town wants you to give them costs for intermediate projections, until the town (not you) decides which sea level projection to use. Now you have enough information to finish designing. That information is not "1 in 10,000"; it is several pieces of information.
In that process, imagine that the minimum projected sea level rise by 2100 was .13 meter, and the maximum was, say, .14 meter. The town might decide they will not build a new seawall but will live with the risk increase, because they think they will spend less money to cope with anything in that range than they would spend on a new seawall. That is the town's decision, not yours. You don't simply look up that decision in your notes from engineering class.
But suppose the town decides that that the least-emissive emissions scenario is impossible--that it will not come to pass. So they tell you to ignore all of the sea level projections from that optimistic emissions scenario. Suppose that the emissions scenarios they tell you to use have 1 meter sea level rise as the lowest end of the 95% range of the least-emissive of those allowed scenarios. Suppose the town decides that they most definitely want to be protected from a 1 meter rise, but they are unwilling or unable to spend the money to protect against anything higher. It does not matter that the upper bound of sea level rise in those within-scope scenarios is 11 meters, because the town has decided not to protect against that much rise, even though it would be catastrophic.
Back to your claim that a range of projected values is useless: You are wrong. The large span of that range does not make the projection useless, if even the minimum value is large enough to demand action. A range is useful for decision makers (requirements deciders) to choose from in picking out the value to hand to you, the engineer, to design to meet.
-
Daniel Bailey at 05:06 AM on 10 April 2015The global warming 'pause' is more politics than science
Yes, pie is tasty. AIUI, the fake-skeptics prefer cherry above all other flavours.

-
Daniel Bailey at 04:58 AM on 10 April 2015Water vapor is the most powerful greenhouse gas
In response to this question, per Lacis et al 2010:
http://www.giss.nasa.gov/research/briefs/lacis_01/fig2.gif
http://www.giss.nasa.gov/research/briefs/lacis_01/
http://www.giss.nasa.gov/research/briefs/lacis_01/fig3.gif
"Ample physical evidence shows that carbon dioxide (CO2) is the single most important climate-relevant greenhouse gas in Earth's atmosphere. This is because CO2, like ozone, N2O, CH4, and chlorofluorocarbons, does not condense and precipitate from the atmosphere at current climate temperatures, whereas water vapor can, and does.
Non-condensing greenhouse gases, which account for 25% of the total terrestrial greenhouse effect, thus serve to provide the stable temperature structure that sustains the current levels of atmospheric water vapor and clouds via feedback processes that account for the remaining 75% of the greenhouse effect.
Without the radiative forcing supplied by CO2 and the other non-condensing greenhouse gases, the terrestrial greenhouse would collapse, plunging the global climate into an icebound Earth state."
http://pubs.giss.nasa.gov/abs/la09300d.html
Per Lacis et al 2013:
"The climate system of the Earth is endowed with a moderately strong greenhouse effect that is characterized by non-condensing greenhouse gases (GHGs) that provide the core radiative forcing. Of these, the most important is atmospheric CO2. There is a strong feedback contribution to the greenhouse effect by water vapor and clouds that is unique in the solar system, exceeding the core radiative forcing due to the non-condensing GHGs by a factor of three. The significance of the non-condensing GHGs is that once they have been injected into the atmosphere, they remain there virtually indefinitely because they do not condense and precipitate from the atmosphere, their chemical removal time ranging from decades to millenia. Water vapor and clouds have only a short lifespan, with their distribution determined by the locally prevailing meteorological conditions, subject to Clausius-Clapeyron constraint.
Although solar irradiance is the ultimate energy source that powers the terrestrial greenhouse effect, there has been no discernable long-term trend in solar irradiance since precide monitoring began in the late 1970s. This leaves atmospheric CO2 as the effective control knob driving the current global warming trend.
Over geologic time scales, volcanoes are the principal source of atmospheric CO2, and the weathering of rocks is the principal sink, with the biosphere particpating as both a source and a sink. The problem at hand is that human indistrial activity is causing atmospheric CO2 to increase by 2 ppm/yr, whereas the interglacial rate has been 0.005 ppm/yr. This is a geologically unprecedented rate to turn the CO2 climate control knob. This is causing the global warming that threatens the global environment."
http://pubs.giss.nasa.gov/abs/la06400p.html
http://pubs.giss.nasa.gov/docs/2013/2013_Lacis_etal_1.pdf -
eksommer at 04:57 AM on 10 April 2015The history of emissions and the Great Acceleration
I really enjoyed this article as well and was interested in the analyses. But please reconsider using stacked line graphs. They look nice, but they are sooooo difficult to understand.
-
Daniel Bailey at 04:55 AM on 10 April 2015CO2 is not the only driver of climate
While some threads are dated, no threads are dead here.
Water vapor is best addressed on this SkS thread here:
Explaining how the water vapor greenhouse effect works
I have placed a followup to your question there. Any questions you may have after reading the post and my response should be placed there.
Many other threads deal with consensus. The Search function will find many; pick one and re-ask your question there.
-
ClimateTool at 04:36 AM on 10 April 2015CO2 is not the only driver of climate
Greetings - I'm new to this webpage / forum, which I find fascinating. The brief bio's on the Skeptical Science Team is as impressive as it is varied. I realize this is an old thread, but it looks like a good place to start.
Let me say at the outset I agree the climate is changing - warming in most areas of the globe - with a net temperature increase. That is obvious in the data, of which I spent a 40 year career collecting, analyzing and processing. Living in the plains, the changes are apparent - latter first snows, earlier spring, increases in non-native insects, plant and human diseases; the list goes on.
While I have my own understanding and response to Change skeptics, I've learned to consider all the facts. Science is after all based in question, discovery, hypothesis, observation, proof, testing proof. Therefore I have two questions.
1) Water Vapor and it's impact on the changing climate. Per the older NASA article from November 2008
http://www.nasa.gov/topics/earth/features/vapor_warming.html
and others since, it seems H2O is somewhat downplayed. What is the Teams sense on H2O impacts on climate change?
2) Science by concensus (Bill Nye's famous videos). Other disciplines outside of meteorology have differing views on the changing climate. By education I was a Soil Science major. In my 'weather' career I've seen this lack of cross discipline discussion result in all manner of issues. Again, what is the Teams sense on "Science by concensus" versus the time tested steps of the Scientific Method?
Thank you. I look forward to your response.
-
Tom Curtis at 04:12 AM on 10 April 2015The global warming 'pause' is more politics than science
Daniel Bailey @13, I think you are being a little unfair. The fake skeptics also like looking at the blue wedge of the pie graph in the upper right of the second image (but never, of course, at the red sections of that graph).
-
Daniel Bailey at 03:22 AM on 10 April 2015The global warming 'pause' is more politics than science
To piggy-back onto PhilippeChantreau's and Leto's comments, the "skeptic" focus on ("but what about since 1998!") becomes understandable: when evidence, the physics of our world and Mother Nature itself is against you, misdirection is the only ploy left in the ideological gameplan:


-
Tom Curtis at 03:18 AM on 10 April 2015A revealing interview with top contrarian climate scientists
MMM@11, perhaps you would prefer this table of UAH adjustments:
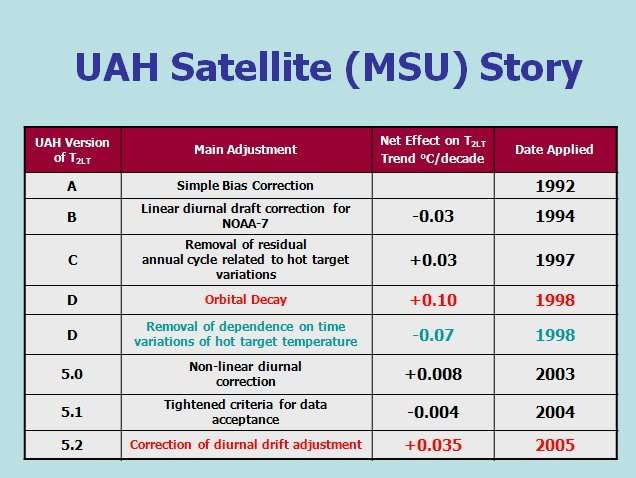
In all, it means that the initial version of UAH contained admitted errors that would have more than halved the current trend, if not corrected. Working backwards we can then see that the admitted errors amount are, for given years, as follows:
1992 -0.069
1994 -0.099
1997 -0.069
1998 0.031
1998 -0.039
2003 -0.031
2004 -0.035
2005 0 -
The global warming 'pause' is more politics than science
It seems that Mother Nature has been trying pretty hard to slow down the warming, but the last 12 months has still been the warmest on record with an anomaly of +0.71oC.
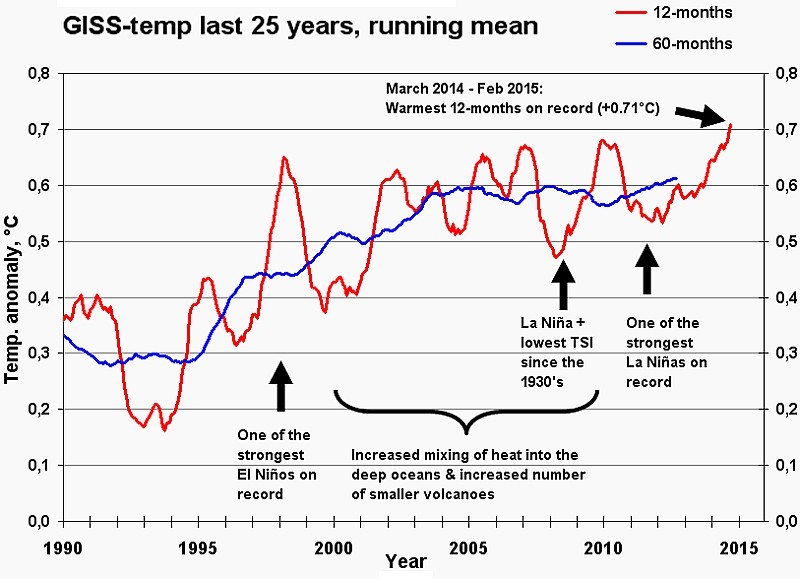
The March anomaly from GISS will probably push the running 12-month mean up to at least +0.72°C, one more step into record territory.
And if the present weak El Niño strengthens and last for the rest of the year, the temperature anomaly for 2015 may well end up between +0.75°C and +0.8°C. -
MMM at 02:14 AM on 10 April 2015A revealing interview with top contrarian climate scientists
I have one critique of the Evolution of UAH trends chart: it confounds changes due to adjustments and changes due to changing trends over time. I would replace the dashed "current" line with datapoints for trends using current data for each of the years shown (e.g., 1979-1995, 1979-1998, etc). Using woodfortrees, [LINK to source data], I get:
1995: ~0
1998: 0.04/decade
2001: 0.1/decade
2005: 0.13/decade
all data: 0.13/decade
I know the woodfortrees UAH data is UAH5.5, not 5.6, so ideally one would repeat this with the latest dataset, but I think it shows that the revisions to the UAH data have indeed led to an increase in the trend, but that also the trend has increased over time due to more warming.
-MMM
Moderator Response:[DB] Hyperlinked and truncated URL that was breaking page width.

Prev 590 591 592 593 594 595 596 597 598 599 600 601 602 603 604 605 Next


