


 Arguments


Recent Comments
Prev 596 597 598 599 600 601 602 603 604 605 606 607 608 609 610 611 Next
Comments 30151 to 30200:
-
Watchdog at 05:49 AM on 31 March 2015Scientists link Arctic warming to intense summer heatwaves in the northern hemisphere
Tristan@16..
I didn't say - the Southern Hemisphere is Cooling OR Warming..Additionally, my point has naught to do with whether or not Antarctica's been exhibiting a Warming Climate vatiable during the past 30 years or not.
My point pertains to the fact that one should include both the Northern and Southern Hemispheric ICE Data (aka Global ICE Volumes at a given Time) IF/WHEN one is presenting -> ICE Affects upon the Globe.
As any graph of annual (or more) Arctic and Antarctic Sea Ice Extents reveal, Both hemispheres are Simultaneous experiencing Semi-Annual Cooling & Warming Phases at opposing times of the Annum.
Both hemipheres are simultaneously out of phase with one another
One Hemisphere's "Winter" occurs _during_ the other's "Summer"
At any given time, as e.g., the Southern Hemisphere Cools the Antarctic ICE Grows AND the Northern Hemisphere Warms thus the Arctic Sea Ice Shrinks..again, at any given time during any year.
The Growing Antarctic Ice Phase during the Southern Hemisphere's Semi-Annual Climate Cooling ICE Growth Phase outstrips the much smaller in Volume simultaneous occurring of Arctic Sea Ice Shrinkage.
My focus is upon the level of the _Net Cancelling Effect_ of Global Temps occurring opposionally and simultaneiously in Both Hemispheres) during any Annum.
As the shrinkage extent of Arctic's Sea Ice is indicative of the Northern Hemisphere's Warming "Summertime", the simultaneous addition of Antarctica's Ice due to the contemporaneous Cooling Winter - must be factored in - IF one is discussing impact of Global Temps upon EARTH's TOTAL ICE - and vice versa.
LASTLY, whereas you've said, "Antarctica is losing ICE Mass", NASA says that on Sept 19, 2014 (Antarctica's Winter), Antarctica reached a "New Record Maximum" level of ICE.
NASA: Antarctic Sea Ice Reaches New Record Maximum
On Sept. 19, 2014, the five-day average of Antarctic sea ice extent exceeded 20 million square kilometers for the first time since 1979, according to the National Snow and Ice Data Center. The red line shows the average maximum extent from 1979-2014. Image: NASA's Scientific Visualization Studio
http://www.nasa.gov/content/goddard/antarctic-sea-ice-reaches-new-record-maximum/ -
jja at 03:41 AM on 31 March 2015Global warming and drought are turning the Golden State brown
One aspect that has not been looked at and should is the contribution of SE Asian aerosol loading as a contribution to the 'RRR'. This was implicated in the GEOmip analyses. For example: Moore et. al. (2013) http://dx.doi.org/10.1002/2013JD021060
The negative PNA-like pattern in G1-piControl is associated with a westward shift of the jet stream toward East Asia, blocking activity over the high latitudes of the North Pacific Ocean, and a strong split-flow configuration over the central North Pacific Ocean. Figure 7 displays these features with a decreased jet speed over central, west Pacific region (with across-model differences, Figure S7), and the 200 hPa geopotential height map also shows a “blocking” high pressure over the northern North Pacific under G1.
-
michael sweet at 01:51 AM on 31 March 2015New measurements confirm extra heating from our carbon dioxide
Citizenschallenge,
As I understand it Jim Steele has it almost backwards. AGW causes dry places to get dryer. Heat waves are worse when there is little surface water to evaporate and cool the atmosphere. In places like California, they have had little rain. When they have a heat wave, it is much hotter than it would have been because there is no water to evaporate to cool the weather off.
AGW's twin effects of altering rainfall and making it hotter causes heat waves to be even more distructive. California has had its fourth dry rainy season. It has been record hot there for months. Expect this summer to be even hotter and have a worse fire season (another of the effects of AGW). They pray El Nino will bail them out but no luck so far on that.
-
2015 SkS Weekly Digest #13
Or, it could just be a cartoon using artistic license :)
-
Tristan at 01:13 AM on 31 March 2015Scientists link Arctic warming to intense summer heatwaves in the northern hemisphere
Watchdog@13
A) From the glossary: The classical period for averaging climate variables is 30 years, as defined by the World Meteorological Organization.B) Antarctica is cooling in some areas and warming rapidly in others. It's inaccurate to say the southern hemisphere is cooling. As I said, Antarctica is losing ice mass.
-
Manwichstick at 01:01 AM on 31 March 2015New measurements confirm extra heating from our carbon dioxide
RE: citizenschallenge #22
Please correct me if I'm wrong: It is my understanding that heat waves (high pressure domes) are a consequence of wind patterns (or lack there of), primarily. So both the start of a heat wave, and its ultimate conclusion, are at the hands of a much larger-scale planetary wind/ocean currents.The idea that "local" humidity effects the duration/severity of heat waves seems a bit like a "forest for the trees" type of error - to me. It makes sense that local humidity is important - but not really THAT important.
If any one can clarify...
-
DSL at 00:02 AM on 31 March 20152015 SkS Weekly News Roundup #13A
Kaz, at the risk of "dogpiling," I'll provide another piece.
Climate is in a constant state of change and has been over the course of Earth's history. Yet for most of that history, climate has changed slowly--slowly enough that species have been able to migrate/adapt, for the most part. It's only when climate changes rapidly or to an extreme condition (deep cold or deep warmth) that many species have problems.
The current warming is extremely rapid. The Paleocene-Eocene Thermal Maximum, about 55 million years ago, was one of the most rapid sustained warmings in Earth's history. Right now, we're doing about 10x to 40x the rate of PETM warming, depending on the method one chooses to compare.
This might be no big deal if we knew that the warming was going to reverse course soon. However, there is no physical reason why that would happen, and every physical reason why it should continue for several centuries--or longer if we continue to dig up fossil carbon and dump it into the atmosphere.
CO2 is essential to keeping the planet warm enough for a robust array of life. It always has been. Yet that same process--the "greenhouse effect"--can be enhanced, and that's what we're doing. Nature hasn't increased atmospheric CO2 this rapidly in at least 300 million years. We are doing it by taking fossil carbon that was stored over tens of millions of years and dumping it into the atmosphere in a matter of a few centuries. -
One Planet Only Forever at 23:48 PM on 30 March 20152015 SkS Weekly Digest #13
The ice could also be air free with enough of the top cube out of the water that it is holding down the rest of the cubes. This can occur in a tumbler where the cubes are kept from shifting sideways to rise to the surface.
However, given the number of cubes shown below the surface in the image almost the entire top cube would have to be out of the water, unless the water was very warm.
-
Composer99 at 23:41 PM on 30 March 2015New measurements confirm extra heating from our carbon dioxide
citizenschallenge:
I don't have a cite, but to the best of my knowledge:
(1) A heat wave does not require the absence of atmospheric water vapour, or indeed of water stored in soil, etc.. IMO your interlocutor needs to provide a cite to support the claim "heat waves usually occur under very dry conditions". (Obviously not a veteran of Ottawa, Ontario heat waves, then.)
(2) Atmospheric water vapour is geographically and temporally highly variable (e.g. there is less of it in, say, desert regions, or in polar regions during the winter, than, say the wet tropics).
I can't say I know much about heat wave formation, but I'm rather doubting the person you are quoting does, either.
-
juggared at 23:25 PM on 30 March 2015CO2 only causes 35% of global warming
There were many ways temperature or other climate features could influence the carbon dioxide level one way or another. Perhaps variations of temperature and of weather patterns caused land vegetation to release extra CO2, or take it up... perhaps the oceans were involved through massive changes in their circulation or ice cover... or through changes in their CO2-absorbing plankton, which would bloom or decline insofar as they were fertilized by minerals, which reached them from dusty winds, rivers, and ocean upwelling, all of which could change with the climate... or perhaps there were still more complicated and obscure effects. Into the 21st century, scientists kept finding new ways that warming would push more of the gas into the atmosphere. As one of them remarked, "it is difficult to explain the demise of the ice sheets without the added heating from CO2 ... this gas has killed ice sheets in the past and may do so again.
-
Watchdog at 23:09 PM on 30 March 2015Scientists link Arctic warming to intense summer heatwaves in the northern hemisphere
Philippe@10
Yes, that 10yr graph only establishes a "stability" over 10 yrs as it indicates that 2014 was not a particularly 'Warm' year in that time.
In your opinion, what time period is long enough to establish whether or not tGlobal Climate is undergoing a Cooling vs Warming Phase? 10yrs? 150yrs? 2000yrs? 20,000yrs? 400,000yrs?
Tristan@11 - At the same time As the Northern Hemisphere Warms,
the So. Hemisphere - including the Far Larger ICY Antarctica - Cools..
Total Global Heat content is a continuous Global Measurement. -
CBDunkerson at 22:56 PM on 30 March 2015Scientists link Arctic warming to intense summer heatwaves in the northern hemisphere
Watchdog, you look at an ice area graph showing 2012 minimum extent (not area) nearly half the size of 2005 minimum extent and conclude that this indicates it has been "relatively stable"?
We have very different definitions of 'stable'.
-
CBDunkerson at 22:49 PM on 30 March 2015Ipso proves impotent at curbing the Mail's climate misinformation
ryland, why would IPSO do anything about the 'failure' to point out an irrelevancy?
'That is steam, not smoke!'
Um, ok... so what? How is that relevant to global warming? People might over-estimate the amount of smoke emitted by power plants (since steam output is greater)? And that would oversell global warming how exactly? Smoke is particulate matter... which causes cooling.
-
Watchdog at 22:46 PM on 30 March 2015Scientists link Arctic warming to intense summer heatwaves in the northern hemisphere
Philippe@10
Yes, that 10yr graph only establishes a "stability" over 10 yrs as it indicates that 2014 was not a particularly 'Warm' year in that time.
In your opinion, what time period is long enough to establish whether or not tGlobal Climate is undergoing a Cooling vs Warming Phase? 10yrs? 150yrs? 2000yrs? 20,000yrs? 400,000yrs?
Tristan@11 - At the same time As the Northern Hemisphere Warms,
the So. Hemisphere - including the Far Larger ICY Antarctica - Cools..
Total Global Heat content is a continuous Global Measurement. -
Daniel Bailey at 21:43 PM on 30 March 20152015 SkS Weekly News Roundup #13A
Saying that since climate change existed before mankind is proof that this iteration of change is not caused by man is like saying that the darkness of night disproves the existence of the sun.
It's not true and it just makes you sound uninformed.
If you wish to pursue your position further, read this post and the comments underneath it and then (and only then) place any remaining concerns on the the comment thread there:
-
Glenn Tamblyn at 20:50 PM on 30 March 20152015 SkS Weekly News Roundup #13A
Kaz
For most of the Earth's history the only life on Earth was bacteria. Anything we might recognise as plants or animals only appeared in the last 500-600 million years. Whereas bacteria (and their even older cousins, Archaea) go back at least 3 billion years and maybe as far back as 3.8 billion years. We complex organisms - people, poplars, prawns etc are recent interlopers.
And those ancient bacteria transformed the planet and the atmosphere more than 2 billion years before anything 'complex' appeared.Google 'The Great Oxygenation Event' as an example.
-
Stephan at 18:22 PM on 30 March 2015Climate's changed before
Re. [3], [5]: Hoyt's argument is flawed on a very basic level. It goes like this: "Water vapour has a atmospheric life time of about a week. So if there is more water vapor in the atmosphere, we must somehow lift that water from the ground up into the atmosphere every week. That requires energy, which must come from somewhere. There is not enough energy to do that. So water vapor cannot increase as much as claimed". What he ignores is the very simple fact that that energy required to lift the water is not lost to the system. Whenever water vapor leaves the atmosphere (via precipitation), those raindrops and snow flakes and hailstones fall back to the ground, and their potential energy is converted back to kinetic energy, and ultimately heat.
-
Opinionated Kaz at 18:11 PM on 30 March 20152015 SkS Weekly News Roundup #13A
I am no scientist but how was there life before plants and trees and still oxygen breathing crwatures?
Yes I know as a species we are harming the planet but it seems like in other ways not through climate change. The Earth has gone through cooling and warming more times than Kim Kardashian has waved her backside about. From all the resourced researched I have looked at Climate changes are a natural process and the only 'green' is money.
-
Tristan at 16:00 PM on 30 March 2015Scientists link Arctic warming to intense summer heatwaves in the northern hemisphere
Whoops, meant earth system, not biosphere.
-
Tristan at 15:59 PM on 30 March 2015Scientists link Arctic warming to intense summer heatwaves in the northern hemisphere
Watchdog@9
"does the Arctic Sea Ice Itself in-turn Affect the Global Climate more than Global Climate affects the Arctic Sea Ice?"
The extent of sea ice in the arctic summer is one of the amplifying feedbacks in the climate system. When the planet heats, summer sea ice goes down, which reduces the earth's albedo, which causes the planet to heat more.
Changes in Antarctic Ice volume are also indicative of the biosphere's total heat content.
-
bozzza at 15:45 PM on 30 March 2015Ipso proves impotent at curbing the Mail's climate misinformation
It's not immoral to have a differnet opinion but it is immoral to lie.
-
ryland at 14:57 PM on 30 March 2015Ipso proves impotent at curbing the Mail's climate misinformation
But on the other hand Ipso doesn't do much about pictures showing steam not smoke coming out of power plant stacks in newspaper articles about global warming. Perhaps the body just isn't up to its monitoring role. And labelling as immoral those who have a different opinion, not only smacks a little of use of the term heretic in the middle ages but also is unlikely to get them to change that opinion.
-
PhilippeChantreau at 14:34 PM on 30 March 2015Scientists link Arctic warming to intense summer heatwaves in the northern hemisphere
Arctic climate stable over the past 9 years? Really? That time period is long enough to establish stability of climate? News to me.
-
Bernard J. at 14:19 PM on 30 March 20152015 SkS Weekly Digest #13
...or D218O...
Or frozen to the bottom of the glass! -
Watchdog at 14:02 PM on 30 March 2015Scientists link Arctic warming to intense summer heatwaves in the northern hemisphere
Moderator - The points of my post(s) are two-fold.
A) Arctic Climate is relatively stable from 2005 to today.. In fact,
2014's Summer ICE graphs as the coolest summer over that time
B) Considering Arctic Sea Ice Volume is only in the vicinity of being less than, for example, 1/10th of 1 percent of Antarctica's Total Ice Volume, it's small variations over the past 10 years reflects the Arctic's regional climate fluctuation.
Said another way, the Climate factors Underlying/Affecting the Extent of Arctic Sea Ice - have not significantly Changed during the Time presented by the Graph I'd posted - and Changes in Antarctic Ice Volume could easily be wondered as being much more indicative of Global Climate - due to its vast disparity in size when compared with Arctic Sea Ice.
Additionally, considering Arctic Sea Ice as being the Effect of the Underlying Cause of Regional Climate, in anyone's opinion here, does the Arctic Sea Ice Itself in-turn Affect the Global Climate more than Global Climate affects the Arctic Sea Ice? -
Magma at 12:40 PM on 30 March 20152015 SkS Weekly Digest #13
I'm not entirely convinced about the ice in the glass on the left... unless it's D2O or H218O.
-
Bernard J. at 10:52 AM on 30 March 20152015 SkS Weekly Digest #12
One cannot have a cartoon like the one above and not refer to the excellent mocking of denialism that is the Hy Brazil scene from Erick the Viking.
-
John Mason at 07:12 AM on 30 March 2015The UK winter of 2014-15: another Tabloid FAIL
The last day of the Six Nations was a rollercoaster, Bill!
Rao - no further comment required. Phil Eden by contrast is one of the good guys. As with Roger Brugge, I have always respected him. These guys stand 100 miles above the likes of Corbyn and Madden.
-
william at 04:57 AM on 30 March 20152015 SkS Weekly News Roundup #11A
Climate change is not a technical problem.. We all know what needs to be done. It is a political problem... PPCT.... who Pays the Piper Calls the Tune. As long as rich vested interests are allowed to buy our politicians, they will tell them what to do.
http://mtkass.blogspot.co.nz/2015/01/ppct.html
Moderator Response:[JH] Please do not use the SkS comment threads to promote your own blog post. Doing so is akin to advertising.
-
billthefrog at 03:47 AM on 30 March 2015The UK winter of 2014-15: another Tabloid FAIL
Nice one John,
Coming so soon after Super Saturday's nail biting end to 6N15, I was surprised to see that you had managed to put together such a "rogues gallery". I thought you might still have been too wound up. (As we had already clinched the wooden spoon by then, I could just settle down in front of the goggle-box for 7 hours, with a big "Do not disturb, except with cups of tea and slices of cake" sign on the door.)
I don't know which of those clowns is worst, but Rao is simply just repetitive. If one were to redact the dates, many of his articles from one year to the next would be fully interchangeable.
He may, or may not, still work there, but the Torygraph did used to have a reasonable person doing some of their weather material - namely Philip Eden. I've had a couple of his books out the local library, and one of these - A Change in the Weather - devotes a chapter or two to nonsensical weather headlines. It's worth a quicko dekko, if you haven't seen it already.
cheers bill f
-
bozzza at 03:45 AM on 30 March 2015Glaciers are growing
The mass loss from 1996 to 2005 is more than double the mass loss rate in the previous decade of 1986 to 1995 and over four times the mass loss rate over 1976 to 1985.
A regular doubling period is the exact definition for exponentiality... can anyone please tell me when the saviour of sinusoidality kicks in??
-
z1robbie at 03:28 AM on 30 March 2015Water vapor is the most powerful greenhouse gas
I am working to understand the complex interactions involved in the most complicated thing there is, climate. Water vapor and clouds seem to be where the most uncertainty lies, according to my understanding of IPCC reports.
Have there been any research papers done on the diurnal temperature changes in desert areas ?
It would seem to me in the near absence of water vapor (low humidity) the difference between day time highs and night time lows over time should correspond to the increase in co2 during the same time period. That is since the Industrial revolution the difference between highs and lows should be decreasing proportional to the increase in co2. They would be inversely proportional.
-
Watchdog at 03:07 AM on 30 March 2015Scientists link Arctic warming to intense summer heatwaves in the northern hemisphere
CORRECTION to my above post.
It should read Arctic Sea Ice AREA (in km2) and not VOLUME.
Arctic Sea Ice annual area average is c. 7.5 Million Square Km..
Arctic Sea Ice annual thickness average c. 2.5 Meters. (0.0025 km3)
Arctic Sea Ice Volume averages rounded up -> 20,000 km3
In Contrast Total Antarctic ICE is c. 26,500,000 km3,
which is larger than Arctic Sea Ice by a factor of >1000Moderator Response:[JH] What is your point?
-
bozzza at 02:31 AM on 30 March 2015Glaciers are growing
Ok, so what if I were to say the rapid decline(rate of change) after 1990 was also seen at the start of the graph in figure1(Basic). Does the graph in figure1 actually make any statment keeping this in mind?
-
Watchdog at 02:08 AM on 30 March 2015Scientists link Arctic warming to intense summer heatwaves in the northern hemisphere
Denmark's Meteorological Institute publishes Arctic Sea Ice Volume from data taken daily by the Greenland Climate Research Centre.
Arctic Sea Ice Volume - Declines in Summer and Rises in Winter.
Graph of the past 10 years includes data from Today (29Mar15)
Sea ice extent in recent years (in million km2) for the northern hemisphere, as a function of date.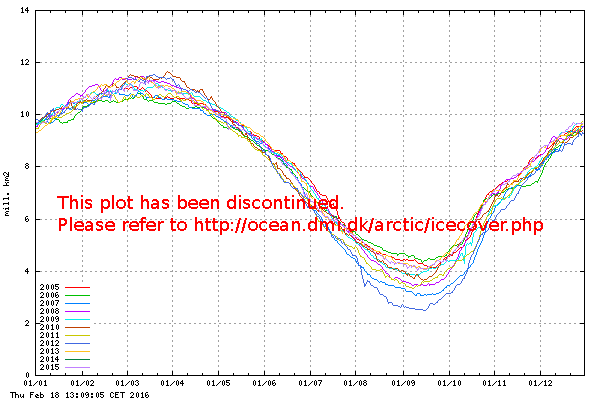
http://ocean.dmi.dk/arctic/old_icecover.uk.php
The Danish Meteorological Institute (DMI) was established in 1872. In 2013 DMI employs 350 people. DMI is an institution under the Danish Ministry of Climate, Energy and BuildingModerator Response:[JH] What is the point of your post?
-
One Planet Only Forever at 01:47 AM on 30 March 2015The UK winter of 2014-15: another Tabloid FAIL
I just reviewed the data on the SkS Temperature Trend page and, though the maximum values are not identified, it is clear that none of the data sets show the most recent 3 month averages to be the warmest. And not all the data sets have the most recent 6 months as the warmest. In fact, the HADCRUT krig and HADCRUT hybrid data sets only indicate that the averages of about 30 months and longer are governed by the the time period ending in FEB 2015.
-
One Planet Only Forever at 01:35 AM on 30 March 2015The UK winter of 2014-15: another Tabloid FAIL
Tony W,
In the NASA GISTEMP data set of the Land-Ocean monthly averages the 3 month period ending in February 2015 was not the warmest 3 month average. The 3 month average ending in April 2010 was the warmest (And early 2010 was also when the warmest 2, 4, and 5 month averages occurred, none of the warmest were in 1998 - the warmest month was in Jan 2007). In that data set it is only the 6 month and longer averages ending in Feb 2015 that are the warmest (every single one of those from the 6 month average through to a 1000 month average).
However, the claim made may be correct for the NOAA Land-Ocean surface temperature data set, or the HadCRUT Land-Ocean set, or the Land only data sets. So the claim about the warmest 3 months simply needs to be provided with clarification of its context.
The most important context for the record setting recent warmth is that it is occurring with less of an El Nino bump than occurred in 2010. And the multi-month averages that occurred during the massive El Nino bump of 1997-98 are significantly cooler than the current multi-month averages of equal duration. IN the GISTEMP L-O data set the warmest 3 month average in 1998 was about 0.70 C. The 3 month averages since the 3 months ending in Oct 2014 have all been warmer. And the March 2015 average only needs to be above 0.56 C to continue that string.
-
Bappleby13 at 00:37 AM on 30 March 2015New textbook on climate science and climate denial
I am half way through the text, including the last two chapters on climate denial. Though I have found distracting little errors and duplications, I want to know if this text is yet being used in an accredited university. If not, I am willing to provide financial help to the students of the professor that first uses it.
-
TonyW at 17:15 PM on 29 March 2015The UK winter of 2014-15: another Tabloid FAIL
Hah, and globally, I believe I read that it was the warmest 3 months (Dec-Feb) on record.
-
citizenschallenge at 13:17 PM on 29 March 2015New measurements confirm extra heating from our carbon dioxide
MarkR,
I'm hoping you can help clarify something for me. Jim Steele makes a novel suggestion regarding Heat Waves. It seems wrong on a number of levels, but I sure can't put it together into words. I'm hoping you can help, here's the quote:
"every heat wave get's trumpeted as global warming, but the heat waves usually occur under very dry conditions. Dry conditions allow the earth and air to heat up much more quickly. And when you get this high pressure settle in, it allows for greater solar insolation, that heats the land more quickly and that high pressure dome stops convection that would carry away that heat, much like rolling up the windows in your car, watching your car heat up.
And because water vapor makes up 80% of the greenhouse gases or even more, the heat waves are actually happening when there's a drop in the concentration of greenhouse gases."
-
jja at 07:00 AM on 29 March 2015New measurements confirm extra heating from our carbon dioxide
MarkR @20 Allen et. al. 2014 is included in the graphic. The error bars make it practically worthless compared to hansen and sato 2010, though it does give a higher mean value as shown on the graphic above.
-
John Mason at 03:58 AM on 29 March 2015The UK winter of 2014-15: another Tabloid FAIL
Another problem that someone on Facebook pointed out to me is the Boy that cried Wolf syndrome. One of these days there could well be a severe low-level blizzard of 1947 magnitude affecting a large swathe of the UK and some people, having read these Tabloid stories over so many years, will misguidedly elect to ignore the deadly serious UKMO warnings, to their great risk. A 50cm fall of level snow with a force 9 gale behind it, while statistically very rare, could quite feasibly happen one winter and it could cause an awful lot of casualties if the public ignore what the best of the science says.
-
One Planet Only Forever at 00:53 AM on 29 March 2015The UK winter of 2014-15: another Tabloid FAIL
The sensationalized regional forecasts of what could happen more than a few days into the future are indeed a problem. They lead some people to believe that the difficulty in predicting such things must mean there is no way anyone can reliably model the future global climate.
This potential to develop misunderstanding, or mistrust, of the ability to model forecasts of global climate may be the motive behind some of the Tabloid nonsense, especially by Tabloids owned by deliberate disbelievers of climate science like Murdoch.
Another consequence of the poorly substantiated sensationalized 'predictions' is the association of those 'failed' predictions with other important climate forecasting that has the potential to be correct and require preventative measures to be implemented 'just in case'. A good example was the recent potential massive Blizzard event predicted for New York city. The storm track was further east than it might have been and as a result Boston and other locations got walloped in the way that New York might have been. The fact that New York was spared was seen by many to be proof of unnecessary sensationalizing of what might have happened. That attitude in a population is what leads to tragedies like Katrina where many people were left at risk in a city that was at serious risk because of a lack of interest in making the changes and improvements identified the last time a big hurricane hit the region because "it might not really be all that bad again soon". In advance of Katrina the residents of New Orleans understood that the freeway system not being elevated all the way through the city was a major concern, and indeed they were correct. And the city did not have any plans to move the poor who had no where to go and no way to get there.
Not all of these sensationalized predictions will be failures. And New Orleans would have suffered worse if the eye of Katrina and tracked west of the track it actually followed, just as New York was fortunate the Blizzard storm track was not further west than it ended up.
It is important to differentiate between the reliability of near term regional forecasts, especially the potential variability of storm tracks as little as one day in advance, from the more absured claims made about the regional expected weather more than one week into the future. And whenever that clarification of understanding is presented the completely different reliablity of global climate forecasting of general conditions averaged over many years should be mentioned. More people need to understand that the average contitions in the future can be very reliably forecast, in spite of the variability of the accuracy of near term regional forecasts.
-
Joe Wiseman at 23:43 PM on 28 March 2015Ipso proves impotent at curbing the Mail's climate misinformation
A Major US church has labelled climate deniers as immoral. Dr. Martha Stout in The Sociopath Next Door claims 4% of people are sociopaths. Mr. Rose may be both.
-
MarkJBohrer at 23:37 PM on 28 March 2015Ipso proves impotent at curbing the Mail's climate misinformation
I couldn't find information on the IPSO website, but I can only assume that it is funded by the news industry, with membership from that industry. I wouldn't count on IPSO doing anything.
-
BojanD at 23:32 PM on 28 March 2015Ipso proves impotent at curbing the Mail's climate misinformation
Well, I've just send IPSO an email and tell them what I think, politely, of course. I think this kind of legitimate pressure is vastly underestimated.
-
uncletimrob at 19:26 PM on 28 March 2015The UK winter of 2014-15: another Tabloid FAIL
The first thing we need to ask about tabloid articicles is " is this a Murdoch rag?" If the answer is "yes" then we can discount any opinion or editorial therein. If the answer is "no" then there may well be some intelligent, considered and even perhaps scientificically based opinion. Murdoch has alligned himself with the far right, science denying, "greed is good", "develop at all costs" bunch, so we cannot hope to have rational or considered opinon or commentary from his publications. There are probably other ratbag media owners that I'm not aware of as a resident of OZ, where his influence is known as the murdocracy.
-
uncletimrob at 19:14 PM on 28 March 2015Ipso proves impotent at curbing the Mail's climate misinformation
As an outsider it seems to me that IPSO is at best useless and worst incompetent.
-
juggared at 16:57 PM on 28 March 2015Climate change in the Arctic is messing with our weather
Arctic sea ice hit its annual peak early this year, and climate scientists say the region's below-average ice conditions made this year's maximum extent the lowest on record.
Every year, Arctic sea ice — ice that forms and floats in Arctic waters — grows during the winter and typically reaches its peak in March. A new report from the National Snow & Ice Data Center (NSIDC), however, reveals this year's Arctic sea ice likely reached its maximum extent earlier than expected, on Feb. 25. At this peak, sea ice covered 5.61 million square miles (14.54 million square kilometers) — the lowest maximum extent since satellite record keeping began in 1979.
The authors of the NSIDC report also found below-average ice conditions everywhere except in two regions of the North Atlantic Ocean: the Labrador Sea and the Davis Strait. [Images of Melt: Earth's Vanishing Ice]
Researchers have seen fluctuations in the date of the sea ice's peak, with it occurring as early as Feb. 24 in 1996 and as late as April 2 in 2010. Still, this year's maximum extent occurred 15 days earlier than the March 12 average calculated from 1981 to 2010.
The Arctic ice cap grows and shrinks with the seasons, and changes in the region's ice cover are largely dictated by variations in sunlight, temperature and weather conditions.
This year's maximum extent was 425,000 square miles (1.10 million square km) below the average from 1981 to 2010 of 6.04 million miles (15.64 million square km). This year's ice cover was also 50,200 square miles (130,000 square km) lower than the previous record low set in 2011.
Ice growth this winter lagged behind last year's progress, partly due to unusual patterns in the jet stream in February that created warm pockets over the Bering Sea and the Sea of Okhotsk, in the western Pacific Ocean, according to the NSIDC.
Yet, officials say a late-season boost in ice growth may still be possible.
"Over the next two to three weeks, periods of increase are still possible," NSIDC scientists wrote in the report. "However, it now appears unlikely that there could be sufficient growth to surpass the extent reached on February 25."
The NSIDC is expected to release a full analysis of this winter's sea-ice conditions in early April.
Moderator Response:[DB] Please do not plagiarize the works of another and represent it as your own creation. Subsequent such infractions will be summarily deleted and could result in a suspension of your commenting privileges here.
Plagiarized text stricken.
-
DSL at 12:26 PM on 28 March 2015Climate's changed before
ZMathblasterZ, the first and foremost thing to keep in mind is that CO2 absorbs/emits at various pressure-broadened bands within the thermal infrared range, the range within which the sun-warmed Earth emits. The emission is in random direction, effectively half up half down. The process lengthens--in space and time--the path of energy from surface to space.
Downwelling thermal radiation has been directly measured from the surface.
So an increase in CO2 is going to result in an increase in energy storage, regardless of the situation. Beyond that, though, there are interesting questions about the timing of the CO2 amplification effect in the process of the Pleistocene glacial cycles.
Prev 596 597 598 599 600 601 602 603 604 605 606 607 608 609 610 611 Next


