


 Arguments


Recent Comments
Prev 602 603 604 605 606 607 608 609 610 611 612 613 614 615 616 617 Next
Comments 30451 to 30500:
-
One Planet Only Forever at 07:16 AM on 16 March 20152015 SkS Weekly News Roundup #11B
Tom @12,
I agree. It is probably more appropriate to name the better alternatives to burning non-renewable gas the 'least consumptive ways of obtaining useable energy from the almost perpetually available energy sources', which would include tidal which is not solar related.
Humans simply need to adapt to living within the means of this amazing planet, and use that knowledge to live within the means of other planets. Regions with insufficient access to that type of virtually eternal energy supply are places humans should not bother trying to live in. And based on the history of locations inhabited that leaves just Antarctica as a place only for scientists and adventurers to explore. Why try to set up any other type of human habitation in a place like that?
-
martin at 07:10 AM on 16 March 20152015 SkS Weekly News Roundup #11B
And here the good news -
global-energy-related-emissions-of-carbon-dioxide-stalled-in-2014.html
-
billthefrog at 07:07 AM on 16 March 20152015 SkS Weekly News Roundup #11A
Hi Tom,
I'm afraid I don't know what you mean when you say the Arctic Roos Extent Graphs use different measures.
The top RHS graph shows extent for each year from 2008 onwards.
The lower RHS graph shows extent for 2007, 2009-15 and the 1979-2006 average (+/- 1 stnd dev)
I've pasted these into Powerpoint in order to run a blink comparator, and that's the only difference I'm seeing.
Could you be a bit more specific please? (NB At this point, my wife would take great pleasure in pointing out that I once failed to find a pair of tracksuit bottoms in my kit bag. As the bag was otherwise empty, this speaks volumes regarding my powers of observation.)
cheers bill f
-
Watchdog at 06:40 AM on 16 March 2015So what did-in the dinosaurs? A murder mystery…
Similarities and varying hypotheses aside, some differences between modern birds and non-Avian Dinosaurs are significant. Non-avian dinosaurs, previously presented as being "Cold Blooded", were still not "Warm" Blooded as Birds and Mammals are. The enormity of Chicxulub (estimated to have possessed roughly 100 Million times the Energy of a 1 MegaTon H-Bomb) - cannot be ignored. It left a crater upwards of 190 miles in diameter! Imagine its Shockwave and Ejecta! Same thing with Deccan Traps Volcanic Activity - leaving more than 1 mile thick of basalt lava over 100's of 1000's of km2. Occurring at roughly the exact time as Chicxulub and the date of the End of the Dinosaurs! It's not an Either-Or matrix. It's both! Lastly. We know from today's measurements that even Much smaller volcanic activity lowers Earth's Temperature - because of its blockage of Solar Radiation reaching Earth. Both Major Events: Chicxulub and Deccan Traps, are clearly evidenced in the geological record as being virtually co-simutaneous. Both, obviously, had a Major impact on the Biota..
-
Witkh13 at 06:10 AM on 16 March 2015It's the sun
I find it ironic how this group is only skeptical towards proof that violates in what they believe. Climate Change/Global Warming believers are eager to believe others are cherry picking data because their follow acolytes have been proven to cherry pick data and promote biased readings since the beginning.
http://wattsupwiththat.com/2015/03/10/study-climate-change-is-nothing-new-in-fact-it-was-happening-the-same-way-1-4-billion-years-ago/
http://www.livetradingnews.com/orbital-variations-key-cause-earths-climate-change-98741.htm
http://www.aip.org/history/climate/solar.htm
http://science.nasa.gov/science-news/science-at-nasa/2003/17jan_solcon/
http://www.newsmax.com/Newsfront/scientists-Milankovitch-cycles-orbit-variations/2015/03/11/id/629605/
https://www.heartland.org/sites/all/modules/custom/heartland_migration/files/pdfs/24807.pdf
All the Climate Change/Global Warming acolytes have to answer to this is to cherry pick one major study and then imploy impropriety based on who funded the research. They use degrading, false, slanderous insults instead of actual proof that any impropriety actually occured.
As I said, the acolytes are merely reflecting their own lack of morals or ethics on everyone else. Apparently it is inconcievable to them that someone may actually have a backbone and tell a sponsor to go pound sand.
However, please continue with this elementary sandbox mentality. Those who are without the mental illness of statism are the opposite of impressed.
Moderator Response:[PS]
Please note that posting comments here at SkS is a privilege, not a right. This privilege can be rescinded if the posting individual treats adherence to the Comments Policy as optional, rather than the mandatory condition of participating in this online forum.
Please take the time to review the policy and ensure future comments are in full compliance with it. Thanks for your understanding and compliance in this matter.
Pick one topic where you think science has wrong and your fellows believe they have truth. Comment on that topic and that topic only, support your statements with references rather than repeating grossly misinformed slogans for misinformation sites and then be prepared to discuss the topic in keeping with the comments policy. Take note in particular of inflammatory tone, sloganeering, and staying on topic. This is a site to discuss the science. If you find the requirements of the comments policy too burdensome, then there are plenty of other sites which would welcome your kind of contribution.
-
Tom Curtis at 05:45 AM on 16 March 20152015 SkS Weekly News Roundup #11A
billthefrog, the Arctic Roos graphs to which I linked not only use different years on the upper panels compared to the lower panels, but also use a different measure of sea ice extent on the right hand upper and right hand lower panels. The do use the same measure of sea ice area on the left hand upper as on the left hand lower panels, however.
-
Tom Curtis at 05:42 AM on 16 March 20152015 SkS Weekly News Roundup #11B
OPOF @9, I agree with your first point, and your last two. With respect to access, people at high latitudes have a very limited access to solar. In the extreme (above the Arctic circle) that access is limited to 3-6 months of the year, with the Sun being either below the horizon or very close to the horizon (where too much energy is lost to the atmosphere) for the rest of the year. Still, a vastly improved access situation than is the case for oil or gas.
With respect to the second, Photovoltaic systems degrade in efficiency over time, and will always need to be replaced after a period. Thermal solar also will suffer from plant degredation though at a slower rate (but higher capital cost to replace). These costs, however, are small relative to the purchase cost of fuel which you undoubtedly had in mind.
So, on these to points, I do no so much disagree with you but think some qualification is needed to make the statements entirely accurate.
-
Tom Curtis at 05:33 AM on 16 March 20152015 SkS Weekly News Roundup #11B
Joel_Huberman @6, absent extensive space borne industries, the rate of extraction of solar energy is restricted to something in the order of 5*10^15 Watts. That represents 5% of the total solar energy falling on the Earth's surface after albedo adjustment and atmospheric absorption. We do not want to change overall albedo, of course, because that would also drive climate change. Nor do we want to extract all solar energy, for energy we extract by solar collectors is not available to drive photosynthesis to provide food, or maintain ecosystems.
For comparison, total human energy consumption for industrial usage is approximately 14.3*10^12 Watts. That means, allowing for a 10% efficiency in extraction, we can supply 35 times our current energy usage from solar power. That is vast, but distinctly finite.
Your point, which is correct, is that for all practical purposes, that supply is available till the end of human existence and so their is no practical end to the supply. However, that still leaves a practical limit on the energy supply in terms of extraction rate. That probably means that for my third paragraph, I should not have used total resource base (ie, 15*10^12*4.5*10^9 Wattyears for solar) but extraction rate, or short term reservoir limited extraction rate (ie, the resource we could theoretically extract over the next century or two centuries) to calculate efficiency. So calculated, both would improve the relative efficiency of gas, but not to a point where it compares favourably with even a small fraction of the solar value.
-
JoeT at 05:12 AM on 16 March 2015So what did-in the dinosaurs? A murder mystery…
Excellent article - thank you for putting it together.
One thing that always puzzled me -— why in the world would avian dinosaurs survive but the non-avian ones become extinct. Does the Deccan trap model offer any insight?
-
CTG at 04:38 AM on 16 March 2015So what did-in the dinosaurs? A murder mystery…
I have always been skeptical of the impact hypothesis. It's interesting that these developments have not made it to the mainstream media, which always talk about the Chicxulub impact being responsible as if it were as certain as the law of gravity.
-
billthefrog at 04:35 AM on 16 March 20152015 SkS Weekly News Roundup #11A
@ OPOF
Tom C has already provided a link to the Arctic Roos (Regional Ocean Observing System) operated by the Nansen Environmental & Remote Sensing Centre in Bergen, and this shows side-by-side area/extent graphs. (There is a need to exercise a little care, as Arctic Roos posts 2 pairs of charts. One pair shows each year from 2008 onward, but the other pair has 2008 replaced by 2007.)
If you want to play about with some numbers yourself, I would look at the NSIDC monthly records. As will be obvious from the link, there is an individual file for each month. The monthly average extent and area numbers for every year from 1979 onwards are contained therein.
You correctly observed that need for measurement of sea ice extent is rooted in history. Basically it would give ship captains an idea of where to avoid. The NSIDC FAQ gives a good description of the difference between area and extent, and also describes (in outline) the calculations involved.
cheers bill f
P.S. I have just noticed the shocking apostrophe typo in the final paragraph of my post #14. Am now on the way to turn myself in to* the punctuation police, who will, I feel sure, cut off my privileges. (*As opposed to "turning myself into the punctuation police".)
-
uncletimrob at 04:21 AM on 16 March 20152015 SkS Weekly News Roundup #11B
@ 5 Tom_Curtis. Thank you, I hadn't thought of efficiencies in those terms, only in terms of our conversion into electricity. It's very good to read such insightful stuff.
Tim
-
Watchdog at 04:04 AM on 16 March 2015So what did-in the dinosaurs? A murder mystery…
Chicxulub, Deccan Traps & K/T Extinction = Approx 65MYA
Tungusta = c.3 to 3 MegaTonTNT and Flattened 2,000 km2 forest Chicxulub = 1.30x10^8 MT-TNT = c.10^8 times Tungusta Energy Chicxulub Impact Angle = 90°
Deccan Traps = 1,500,000 km2 Lava Flows
India's Global-position on Earth 65MYA = Opposite side from Chiculub
IMO Chicxulub caused Deccan Traps Volcanic Activity.
CONCLUSION? BOTH Chicxulub & Deccan Traps had V.Serious Impacts upon Life/Climate from: (A) Widespread Impact Zone and (B) Magma Fields, and, (C) Particulate Emissions Blocking Sun's Radiation - Which in turn caused (D) Global Freezing; thus killing all Dinosaurs as well v.strongly affecting: Plankton, Tropical Invertebrae, Land Plants, Etc. -
One Planet Only Forever at 02:25 AM on 16 March 20152015 SkS Weekly News Roundup #11B
Tom Curtis @ 5,
In addition to your efficiency comparison there are many other consideration that favour solar over burning extracted non-renewable gases:
- Solar supply is essentialy perpetual, non-renewable gas isn't
- Everyone can develop to benefit from solar energy, people have to fight over who gets to benefit from non-renewable gas
- Once a solar energy system is set up no new 'purchase' is required, the price of non-renewable gas will inevitably keep going up especially of all impacts have to be paid for upfront leading to more intense fighting over the benefits
- Burning gas still generates excess CO2. It is only half as bad as burning. So it is not a solution.
- Extracting, transporting, and burning non-renewable gas also produces many other unacceptable impacts including NOx and SOx.
-
sailrick at 02:11 AM on 16 March 20152015 SkS Weekly News Roundup #11B
Thanks for the replies. Joel - about what I figured, science learns and moves on.
-
One Planet Only Forever at 00:37 AM on 16 March 20152015 SkS Weekly News Roundup #11A
Thanks for the additional pointers again Tom,
What you mention about what happens in May being a more significant indication of what the minimum extent will be than what is happening at this time of year is very easy to see in the NSIDC record of 2012. That year had a large Arctic sea ice extent into May.
-
Joel_Huberman at 23:57 PM on 15 March 20152015 SkS Weekly News Roundup #11B
Sailrick @ 2 & 3, Uncletimrob @ 4: My opinion, upon having skimmed through the paper by Stephens et al., is that the paper is an excellent example of the scientific process at work. The paper builds on current climate science and adds more precise measurements of albedo in the two hemispheres. The authors point out that the albedos of the two hemispheres are more closely matched than models easily predict--but that's not surprising, since models are just models and will always need finer tweaking. There's nothing in this paper that in any way invalidates any aspect of current climate science.
-
Joel_Huberman at 23:42 PM on 15 March 20152015 SkS Weekly News Roundup #11B
Tom Curtis @ 5: Thanks for your very insightful view of energy efficiency. I'll promote that view in all my future efforts to educate. With regard to the Sun's resource size, I think we might as well label it infinite, because the Sun will outlast the planet Earth and will far outlast humans on Earth.
-
Tom Curtis at 23:24 PM on 15 March 2015Human CO2 is a tiny % of CO2 emissions
DangerousDan @274, CO2 in beer and some softdrinks (ie, brewed Ginger Beer) comes from fermentation, and as such was originally drawn from the atmosphere by photosynthesis. Because they are originally drawn from the atmosphere, their return to the atmosphere merely completes the cycle. It does not increase atmospheric concentrations.
CO2 in carbonated drinks, however, may come from a variety of sources including fossil CO2, by cracking CO2 from the air by refrigeration, or from by products of other processes. The Coca Cola company, in particular, have stated that most of their CO2 used in drinks comes from by products of other processes, and hence do not constitute additional emissions to those other processes.
Finally, even if all the CO2 in soft drinks was additional emissions, it would constitute a tiny proportion of total emissions. Roy Spencer estimates total emissions from soft drinks as 1.46 million tonnes of CO2 per year. For comparison, the annual emission from fossil fuels 28.6 billion tonnes of CO2 per year. That is, soft drinks would contribute 0.005% of the problem if (contrary to fact) they used no recycled CO2.
-
Tom Curtis at 22:20 PM on 15 March 20152015 SkS Weekly News Roundup #11B
uncletimrob @1, people who say that solar is less efficient than gass are very confused. All energy used on Earth except geothermal comes from the Sun. It may come directly as in solar. It may come indirectly as in wind power (where the winds get their energy from the Sun). For natural gas, the energy came from the Sun long ago. It was converted into chemical energy at about 10% efficiency by photosynthesis. However, most (greater than 99.9%) of the resulting chemical energy was wasted in respiration either by the plant or plant eaters. The miniscule amount of chemical that remained was buried and in a process that lost still more of the energy, converted to gas. The gas was then pumped out of the ground, and distributed (requiring more energy) until finally we get to burn it. Clearly, as an energy source, gas is far more inefficient than solar.
I imagine those who support fossil fuel use into the future will object to a full energy cycle calculation of energy efficiency. They will consider most of the energy efficiency as a spent cost, and therefore irrelevant. A bonus even, as when we burn fuels we are obtaining energy from yesterdays Sun, today.
However, even in those terms solar is far more efficient than any fossil fuel. The simple fact is that whether we use solar or fossil fuels, we are using a fuel with a finite resource base. If you want to calculate efficiency, the only efficiency that matters is the proportion of the finite resource base used to obtain that energy. And the fact is that the finite resource base for solar is so large that it is effectively free for the taking. Each kilowatt hour of solar generated at 10% efficiency of incoming solar radiation represents a far, far smaller proportion of the total resource base of solar power than each kilowatt hour of electricity generated from gas does of the total fossil fuel resource base.
Again, fossil fuel boosters won't be happy with that estimate of efficiency. The reason is that they want to impose an almost irrelevant accounting measure to make their preferred technology look good.
-
DangerousDan at 19:31 PM on 15 March 2015Human CO2 is a tiny % of CO2 emissions
Co2 from Man made drinks. Is co2 from say beer. A natural co2 emission? or a human emision. Or does it change after it is consumed. Some co2 is absorbed and expelled by the lungs. The remainder is belched back out?
-
uncletimrob at 18:30 PM on 15 March 20152015 SkS Weekly News Roundup #11B
@3 Sailrick
"And then there's Physics" blog has come interesting commentary on the albedo paper here:
https://andthentheresphysics.wordpress.com/2015/03/11/new-albedo-paper/
I'm no expert so will leave the argments to those who are, but the blog is worth a look.
-
sailrick at 17:29 PM on 15 March 20152015 SkS Weekly News Roundup #11B
obviously the line from the comment is hyperbolic. the commentor thinking it's another proverbial nail in the coffin of AGW.
I read most of Judith's article about the paper, but am not knowledgeable enough to critique it.
-
sailrick at 16:36 PM on 15 March 20152015 SkS Weekly News Roundup #11B
I came across this in a comment at an NPR article " a new paper appeared that found a colossal error in the climate models"
It refers to a post at Judith Curry's blog, about a new paper on albedo.
Graeme L. Stephens, Denis O’Brien, Peter J. Webster, Peter Pilewski, Seiji Kato, and Jui-lin Li are the authors
Link to manuscript: http://webster.eas.gatech.edu/Papers/albedo2015.pdf
And I was wondering if you are doing an article on it.
-
uncletimrob at 15:48 PM on 15 March 20152015 SkS Weekly News Roundup #11B
@ Will natural gas dim solar’s shine? The technology of turning heat into electricity is mature and with a maximunm efficiency of around 60% for gas fired stations IIRC. In comparison PV technology is not so mature or so efficient and there will need to be further advances in storage technology before PV can really contribute a bigger slice of our energy needs. Personally I believe that here in OZ we are well placed for PV to have a bigger input than it currently has.
-
SpaceCow at 12:53 PM on 15 March 2015They changed the name from 'global warming' to 'climate change'
=( NASA just came out and disproved your definition of Global Warming/Climate Change.
"Global warming: the increase in Earth’s average surface temperature due to rising levels of greenhouse gases.Climate change: a long-term change in the Earth’s climate, or of a region on Earth."
http://pmm.nasa.gov/education/articles/whats-name-global-warming-vs-climate-changeModerator Response:[TD] A) "Disproved" is inaccurate/wrong/odd.
B) Please read that page you linked to, then actually read this Skeptical Science post. Really, read them. Both. Carefully.
C) Feel free to comment again, correcting yourself.
-
chriskoz at 12:36 PM on 15 March 2015Scientists link Arctic warming to intense summer heatwaves in the northern hemisphere
According to decade old teachings by Kerry Emanuel, the N Atlantic tropical cyclones supposed to increase in intensity. See e.g. Emanuel 2005 showing increase in hurricane power dissipation index (PDI) in all cyclone regions since 1970. Emanuel 2005 found strong correlation of PDI with regional sea surface temperature.
So, a clarification is needed what "decline in storminess" means here. Is it in both frequency and intensity? Certainly the storms in question cannot be cyclones/tropical storms because that would contradict Kerry's findings.
-
Tom Curtis at 12:24 PM on 15 March 20152015 SkS Weekly News Roundup #11A
OPOF @25, sea ice area is also reported, and shows a similar dip to that in sea ice extent:

(Source)
It is, however, not at record low values indicating that the ice is more compact than in 2007.
To be quite honest, however, the minimum variation in extent and area does not occur until mid May. Until that point, any difference between different years can be washed out by occurrences in mid May - ie, they are almost irrelevant for predicting September minimums. So while it is interesting that sea ice extent is at record low values, and sea ice area is at near record low values for the time of year, that is still consistent with a September sea ice extent greater than last year, and probably will not result in a new September sea ice minimum.
-
One Planet Only Forever at 12:02 PM on 15 March 20152015 SkS Weekly News Roundup #11A
Jim Hunt@6
The Arctic ice extent reported by NSIDC has held fairly steady for the past several days rather than continuing the stead decline that occured from Feb 25 to March 8. And the value for March 13 is a notable increase of the extent. However, it is still well below any of the previous years in the record. A temporary condition seems to have been producing the reduction of the 15% sea ice extent. Maybe an event was pushing areas of broken up ice into a tighter packing.
I appreciate that the 15% and 30% sea ice extents are important for navigation. So I understand why the systems are set up to provide that information on a daily basis. And I can see the logic and importance of monitoring the trend of changes in ice extent and trying to develop better ways to predict upcoming ice extents. However, I believe an evaluation of the total ice area, meaning that in areas that are not solid ice only the amount of ice area would be calculated as part of the total ice area would eliminate fluctuations of extents of broken up ice that could occur. Is the Cryosphere Today area calcualted that way? I only quickly reviewed the website and could not see any obvious indication of how he ice area in the chart was determined.
-
bcglrofindel at 11:35 AM on 15 March 2015Measuring Earth's energy imbalance
@scaddenp, thanks I had started there actually and was only able to find stuff on Ceres from 2000 onwards.
@MA Rodger, thanks for that, pretty much exactly what I'd been looking for. The articles I had found so far already had me suspecting your observation about troubles combining the series for instrumentation/calibration reasons. Even just having the two separate trends as you provided though is just what I was trying to learn. I'm still reasing through, but is it generally true then that the satellite observed energy imbalance has been largely without a trend at the inter-annual/decade level? Sure doesn't appear to be trending much in in the ERBE set, and the Ceres post 2000 data is declared unlikely to have a trend by the IPCC. I find that result counter intuitive though as CO2 concentration over that same time has verg steadily been increasing...
-
PluviAL at 07:23 AM on 15 March 2015So what did-in the dinosaurs? A murder mystery…
@ 18, 20, Thanks for the info. I just ordered "Waking the Giant" looks really interesting. I expect that this view will grow as we get more information about this feedback loops, and more interest on the subject. The idea seems to alwasy be played down. I remeber seeing an article on GIA in which the authors concluded that since the chemical changes in the rock only went so far, that the effect could not have gone furhter. That seems narrow minded. Heat, and mechanical distortioins might be expressed otherwise. Bill McGuire, also poopoos the idea that the feedback loops may go far from the source. My expectation is that it is way underestimated. Exited to read his book soon.
-
wili at 03:52 AM on 15 March 2015Scientists link Arctic warming to intense summer heatwaves in the northern hemisphere
Thanks, dorlomin. That makes a lot of sense. That _was_ quite a train of storms that came through Great Britain and environs last year.
I wonder what a general decrease in winds portends for all that wind power we are putting in, though.
-
dorlomin at 03:14 AM on 15 March 2015Scientists link Arctic warming to intense summer heatwaves in the northern hemisphere
@Wili. Windstorms are driven by differences in air pressure. Air pressure differences are caused by temperature differences. As the Arctic warms in summer the differnces between it and the "mid latitudes" will drop, this could lead to a drop in certain types of windstorm.
This is not about the autumn\winter windstorms that make the news, or increases in thunderstorms into the mid latitudes. Last year (winter 2013/14) we seen how a big kink in the boreal polar jet dragged lots of warm moist air from around the US "South Atlantic" states and spun monster storms into the UK and Europe.
A changing climate will mean some kinds of weather become less frequent including some storm types.
-
Dean Morrison at 01:18 AM on 15 March 2015Global warming stopped in
1998,1995,2002,2007,2010, ????
Surely this article in need of another update, since all global temperature datasets now show 2014 as the hottest on record?
-
funglestrumpet at 00:23 AM on 15 March 2015So what did-in the dinosaurs? A murder mystery…
@ billthefrog #19
Thanks! I never thought of that. It makes a lot of sense.
-
It's the sun
PS - In all fairness, Pangburn hasn't been arguing on SkS for very long, and has yet to make a clear causal claim (something I've been trying to extract). But given his history on other sites and his own blog posts, I'm not sanguine about better results here.
-
ranyl at 16:35 PM on 14 March 2015So what did-in the dinosaurs? A murder mystery…
Thanks Howardlee, it is further;y concerning that for this Co2 induced warming assault on biodiversity that the earth has already lost 30-50% of its biodivesity and has extinction levels that geologoically noteable, before the warming infliuences are even really starting to bite.
For an analogy it seems we've given th eearth leuakeamia and now its caught a high fever producingknown to be deadly virus.
Whilst our dicision makers moan about 2C cuts and many of the so called solutions are laced with mining, toxic waste and have direct biodiversity harming impacts (e.g. PV panels).
Seems Volacnoes could possibly be woken up on land but put to sleep in the ocean.
WOnder if th erate of change in the oceans weight and uplift make any difference?
Wonder if the the rate melt makes any difference?
-
jja at 15:31 PM on 14 March 2015Scientists link Arctic warming to intense summer heatwaves in the northern hemisphere
This work definatively shows the "new normal" patterns of standing wave high/low pressure regions and cut-off blocking regimes that have grown to dominate the mid-lattitude region with unprecidented temperature and precipitation extremes. Just wait until China has effective reduced its aerosol emissions. . .
-
It's the sun
Dan Pangburn's argument appears to be one I've seen before - where a 'break-even' point is defined in some fashion (TSI, or a particular sunspot number as in an earlier Pangburn post here, etc.) - it's assumed that any energy above that breakpoint will integrate and accumulate positively, and any below that breakpoint will integrate negatively.
Utterly neglecting the other side of the equation, the outgoing LWR which scales with temperature and effective Earth emissivity, and that climate energy is driven by the difference between incoming and outgoing energies. There is no fixed break-even since temperatures change in response to forcing, the difference is between two moving values, and hence no fixed threshold.
In fact, since the sign of the speculative integration against a particular 'break-even' is solely and rather arbitrarily set by where that breakpoint is defined, different breakpoints can suggest either ridiculously large warming or cooling depending on how they relate to the time series as a whole. It's a hypothesis focused entirely on the climate energy input, wholly ignoring energy output - and therefore it's meaningless.
Pangburn has been pushing this hypothesis for several years, in the face of multiple replies pointing out these issues - it's unlikely he's going to change his mind now. But readers should be aware of the difference between a fixed integrative threshold, and an imbalance (the case in reality) between two moving values. And judge such simplistic hypotheses accordingly.
Moderator Response:[PS] Thank you for bringing up Dan's previous posting history. This shows excessive repetition and amount now to just sloganeering without supporting evidence.
-
DSL at 12:52 PM on 14 March 20152015 SkS Weekly News Roundup #11A
February GIS L-OTI is out: 0.79C. That's the second warmest February (1998) on record and the 7th warmest month overall. The last 12 months are now the warmest (0.71C) on record, beating Feb 2014 - Jan 2015 (0.68C).
-
Tom Curtis at 12:09 PM on 14 March 2015It's the sun
PS inline @1121, no, there is no point in putting up the time integral of CO2 forcing. The correct relationship is Heat Content (not temperature) to the time integral of (Incoming energy - outgoing energy). CO2 changes the time integral of outgoing energy by reducing OLR. Increasing temperature changes the time integral of outgoing energy by increasing OLR. Because Pangburn persistently ignores OLR, his formulation is nonsense. However, it is his formulation I wanted to test, hence the first graph.
Moderator Response:[PS] frankly not much point to time integral of TSI either but I thought that might help see the issue.
-
ubrew12 at 11:34 AM on 14 March 2015Scientists link Arctic warming to intense summer heatwaves in the northern hemisphere
Just speculating: From the paper's abstract: "Weakening of the zonal wind is explained by a reduction in poleward temperature gradient". In Fluid Mechanics, turbulent eddies get their strength from the main fluid flow (here, the 'zonal wind'). If that wind weakens, the eddies themselves should weaken: the overall flow becomes less 'turbulent' and more 'laminar' (undisturbed). With less turbulent mixing, if you happen to be in a heatwave, there's less chance of a disturbance to relieve you. Like a river cascading down a sharp incline breaks into turbulence: its hard to find a spot where a floating leaf can remain stuck in place for awhile. But as the river approaches the sea, the incline becomes imperceptable. The river meanders in long ox-bows, left and right, and becomes much less turbulent. Now a leaf can drift to a still area and remain stuck there for days.
-
Tom Curtis at 10:26 AM on 14 March 20152015 SkS Weekly News Roundup #11A
Riduna @22, I have no doubt that fresh water runoff from ice sheets contributes. Never-the-less, the theory as explained in the literature was (from memory) increased surface fresh water from precipitation.
-
Tom Curtis at 10:23 AM on 14 March 2015It's the sun
As Dan Pangburn does not appear interested in following reason, I thought I would short cut the argument. His claim is that the integral of TSI explains the temperature history since 1880. Therefore, I took the record of TSI forcing used in Kevin C's simple response funtion climate model (default setting). I tested the regression of offsets of that forcing to 1960 to determine which best correlated with the GISS LOTI. As it happened, 0 offset was best. I then regressed the resulting integral of TSI against the GISS LOTI up to 1960, and projected the regression on to 2010:
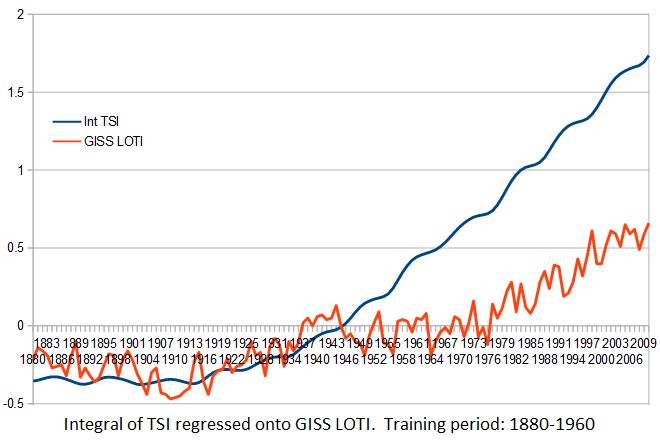
For the record, the correlation over the full interval is 0.917 and the r squared is 0.841. I did not calculate the Root Mean Squared Error, but as you can see it is lousy. Sufficiently so as to falsify the model.
For comparison, here are the full forcings with a simple, two box response function as shown with default settings minus ENSO from Kevin's model:

R squared is given as 0.877. Better than the integral of TSI, but not stunningly so. The overall fit, however, smashes the Pangburn model. If you hold to the quaint notion that scientific results should be determined by empirical evidence, then there is no question as to which model is superior.
Dan Pangburn may not be happy with my regression. If not, however, it is incumbent on him to do better - and to tell us how he did it. Absent such an attempt, his counter theory is not science. It is merely a thought bubble. And until he does better, showing us the graph of the regression and explaining his methods, we are quite right to ignore that thought bubble.
Moderator Response:[PS] As you pointed out earlier, there is rather large gap in Dan's physical understanding. Are you going to put up the CO2 time integral as well?
-
Riduna at 09:45 AM on 14 March 20152015 SkS Weekly News Roundup #11A
Tom @ 10 … “increased rainfall”. More likely fresh water run-off from increased ice sheet mass loss?
-
mancan18 at 09:28 AM on 14 March 2015So what did-in the dinosaurs? A murder mystery…
Excellent article Howardlee.
Always wondered about an asteroid impact being solely to blame for the extinction of the dinosaurs. This thesis seemed to become entangled with the nuclear winter arguments regarding the impact of a nuclear war. Hence the reason it became the accepted idea as to what caused the demise of the dinosaurs. I would have thought that if there had been significant climate cooling due to blocking out the sun from the aerosols ejected into the atmosphere from an asteroid impact, then there would have been a significant drop in the CO2 levels due to the reduced activity of plants before the vulcan outgassing of CO2 had its full impact. A large asteroid impact on the scale of Chixulub should have a similar climate impact as a single LIP, and it seems that you need a few LIPs occuring over a short geological period to actually trigger a mass extinction event.
Perhaps, now that it is possible to date geological evidence more accurately, then a more refined history of of the sun's orbital dynamics, maturity and radiation levels; atmospheric composition; continental drift; vulcanism; climate change; and extinction events can be done. This may help put some of these controversies to rest.
-
billthefrog at 08:40 AM on 14 March 20152015 SkS Weekly News Roundup #11A
@ scaddenp #20
Yep, that's what my gut-feel says - it's just that I've never seen anything formal, and certainly don't expect to be right about anything just on gut-feel.
-
billthefrog at 08:35 AM on 14 March 2015So what did-in the dinosaurs? A murder mystery…
@PluviaL #14
Last year I went to a lecture given by Bill McGuire, the Emeritus Professor of Geophysical & Climate Hazards at University College London. His talk was entitled "Waking the Giant", and it examined the effects wrought by isostacy as a direct consequence of past climate change. (And I've got a signed copy.)
cheers bill f
-
billthefrog at 08:24 AM on 14 March 2015So what did-in the dinosaurs? A murder mystery…
@ funglestrumpet #16
I'm pretty sure that ubrew12's point was that a longitudinal shock wave emanating from Chicxalub could have had percussions (pun intended) at the hot spot responsible for the basaltic mega-eruptions at the Deccan Traps. I don't for one moment think that some form of planetary-scale exit-wound was being mooted.
I once did some sums in preparation for an astronomy presentation, and calculated that the kinetic energy of the impactor was roughly equivalent to the total solar energy hitting TOA for about one month. The term "made the planet ring like a bell" is one that I have seen applied to this little nudge.
@ Howard
One of my chums, sadly no longer with us, was a Fellow of the Geological Society of London, and he always had a soft spot for the Deccan Traps as the "culprit".
There is, of course, another "suspect" - namely the so-called Shiva Crater Impact Spot. Does this have any real support in the rock-bashing community? (Those with any familiarity with the Hindu pantheon will appreciate the name.)
cheers bill f
-
howardlee at 07:07 AM on 14 March 2015So what did-in the dinosaurs? A murder mystery…
Pluvial @ 14:
On climate afffecting volcanism yes there is, but in a tiny way. The first is a feedback in which melting ice reduces pressure on magma chambers in glaciated parts of the world, encouraging them to erupt. Example: Iceland today. The other is in rising sea levels supressing mid-ocean-ridge volcanism (and the converse). This is a mild, slow, long-term negative feeback completely dwarfed by human emissions. Minus the cosmic periods, your complex medium waves idea is very similar to this feedback.
Asteroid storms - I have seen a suggestion of long term periodicities in asteroid impacts but would have to dig further to find that paper. As is clear in the article, there is no evidence that they have much effect on the inner workings of the Earth or even its long-term climate, which is surprising.
Cosmic periods - there was a suggestion a while back that there was a periodicity in the cosmic ray flux into the atmosphere based on the motion of our solar system through the arms of the Milky Way galaxy, but that has been refuted by more accurate mapping of the arms and our place within them.
Prev 602 603 604 605 606 607 608 609 610 611 612 613 614 615 616 617 Next


