


 Arguments


Recent Comments
Prev 601 602 603 604 605 606 607 608 609 610 611 612 613 614 615 616 Next
Comments 30401 to 30450:
-
wakeup at 17:22 PM on 18 March 2015There is no consensus
Advance apologies if this question has been asked and answered many times. I just discovered the site while searching for the source of the oft-quoted 97% consensus and was disconcerted to read that the consensus refers to 97% of the 33% of authors who stated a position on human-caused warming, while the remainding two-thirds made no finding as to cause. The reality, then, is that twice as many climate researchers do not agree that gw is human-caused, do not know, or are unwilling to take a position. I read one comment here that seemed to say that the 66% didn't need to state an opinion because it is so obviously human-caused - the "everyone knows" argument. This wouldn't be acceptable in a courtroom or a school science project so I hope it is not the case.
Many non-scientists are bewildered by the volume of conflicting information on this subject, by fuzzy numbers and apparently authoritative statements that amount to gobbledegook when subjected to rigorous analysis. Anyone?
-
Glenn Tamblyn at 11:35 AM on 18 March 2015It's the sun
Leto @1136
Further to Tom's comment, this paper is interesting
Particularly fig 11b.
Significant step changes in the percentage of SST measurements from US ships with a significant rise during the war and a sharp drop in Aug 1945. The paper is using the older HadSST2 dataset for SST's. The more recent version has some correction for this but perhaps ot completely.
Moderator Response:[RH] Shortened link.
-
Tom Curtis at 09:07 AM on 18 March 2015It's the sun
Leto @1136, 1944 (-3.27 SD), 1938 (-2.81 SD), 1943 (-2.45 SD) and 1963 (-2.02 SD) are the only years with greater than two standard deviations below the mean error between model and observed temperatures. We would expect values exceeding SD of 3.29 from the mean, assuming a normal distribution, just 0.1%. Ergo, with 131 observations, we expect to see such a value 12.3% of the time. So, while the observation is unusual, it is far from clear that the model has come "unstuck" in 1943.
There is, however, a better than even chance that there is a problem with the 1944 values, and given the closeness in time, possibly also those of 1938 and particularly 1943. Curiously two of those years are at the height of WW2, and one immediately preceeds it. This raises several issues.
First, there were large, and unevenly distributed changes in shipborne traffic in WW2. Specifically, there was a large reduction in shipborne traffic outside of military convoys in the Pacific. In the Atlantic traffic from the US to Brittain and back diverted substantially north or south of normal routes to sale near airbases that provided aircover against submarines. There is a very real possibility that these factors have distorted WW2 SST records. There are also likely to have been disruptions of land records at the same time.
Second, there was a very rapid change in the proportion of SST records taken from engine manifolds rather than by buckets in WW2, with an abrupt change back immediately after. It is not certain the correction for these factors is entirely accurate, with again the possibility of WW2 SSTs being too hot.
Third, one area that certainly saw a marked loss of traffic was the NINO3 to 4 region of the Pacific. That means ENSO records of the period are likely to be unreliable resulting in a potential erroneious ENSO correction.
Fourth, WW2 saw extensive production black carbon and oil slicks, both of which may have markedly reduced albedo. It is not clear that this has been picked up in the forcing records. If they have not been, it may be the case that the WW2 records underplay the forcing in that era.
I suspect the larger errors in the model in and near WW2 are due to some combination of these five factors (chance plus the four potential sources of error). Of the four potential sources of error, two represent potential errors in the temperature record, and two potential errors in the model. Given all of this, it is not clear that there is a problem, and if there is it is not clear that the problem is in the model. It is also possible that some other factor in what was an unusual period (to say the least) was involved.
Given all of this, my inclination is to not give too much weight to errors in the WW2 period. Where I a scientist looking at the temperature record, or the forcing or ENSO history, I would be looking at that period in detail to try and resolve the issue, but the error is not so large that it would trouble me if I could not.
-
Tom Curtis at 08:35 AM on 18 March 20152015 SkS Weekly News Roundup #11B
ryland @18, nuclear and fusion are simply off topic in this thread as none of the news articles above discuss them. There is, however, extensive discussion of both options on other SkS threads.
Moderator Response:[PS] Serious discussion of nuclear is probably better conducted at http://bravenewclimate.com/.
-
Tom Curtis at 08:24 AM on 18 March 20152015 SkS Weekly News Roundup #11B
ryland @18, the lifetime energy costs of producing solar cells is a very limited look at EROEI. Done properly, that should be a whole of project investment, including in the comparison the costs of refining the steel, manufacturing the pipe, and building oil refineries etc for comparison, not to mention the energy cost of refining and transport. It should also include the energy cost of the transmission infrastructure. By picking only on the cost of PV cells, you appear to assume that oil goes from the well to our use without any energy cost. Because many of these costs vary by project, the overall cost can only be assessed project by project.
As it happens, assessments of relative EROEI of fossil fuels and solar are quite varied. Never-the-less, the EROEI of PV solar in Germany is greater than 1. Ergo, even in Germany solar could provide all energy needed for industrial purposes, including the manufacture of new PV cells. Given that, and given the size of the total energy resource base from solar, a pure solar powered civilization is feasible, even at current technologies. As it happens, however, the EROEI of fossil fuels is declining with time, while that of solar is improving.
-
Tom Curtis at 08:12 AM on 18 March 20152015 SkS Weekly News Roundup #11B
Wol @17, apology accepted.
From 15:
"One might as well argue that all the energy involved in laying down the deposits of the various elements that are used to make PV panels - moving tectonic plates, weathering, sedimentation and the like, should be included in PVs energy budget."
Only if you also include the energy involved in processing animal and vegetable matter to oil or gas (which involves sedimentation, massive burial to quite deep depths where a combination of pressure and geothermal energy make the transformation). Further, for an apples to apples comparison, pushing that far back, you would have to quantify the energy involved in forming and moving into exploitable veins, the minerals used in manufactoring oil and gas refineries, pipelines, tankers etc. I don't know how to quantify all these additional factors, but the net balance certainly won't make our equation show fossil fuels as more efficient than solar, and in fact is likely to make the comparison less favourable for fossil fuels.
Further, including these factors only detracts from the simple point I was making. Specifically, fossil fuels are a very energy inefficient way to store energy but are only viewed favourably because the energy in storing them is largely already expended. Put another way, standard energy efficiency comparisons cherry pick an irrelevant comparison while neglecting far more imporant issues of sustainability. The comparison is irrelevant because the denominator for the energy efficiency equation for solar is so large (considering total resource) that even ridiculously low energy efficiencies provide more than enough energy.
Finally, for completeness, there are two relevant comparisons. The first is a gateway comparison only. Is the energy returned greater than energy used in gathering the energy (technically, Energy Returned on Energy Invested or EROEI). If not, the resource cannot be a primary energy resource for society. Solar comfortably meets this margin for most projects south of the Artic Circle, and wind does better. Second, what is the relative levalized cost of the two energy sources including all externalities. Solar and Wind comfortably win this comparison as well (though they loose it if you exclude fossil fuel externalities).
-
william at 05:30 AM on 18 March 2015Climate change in the Arctic is messing with our weather
Despite the reduction of the arctic ice, there is still an awful lot of it reflecting EM radiation back into space. Even now we see the jet stream weakening and wobbling, presumably due to the slower rotation of the Polar Hadley cell. The PHC is powered in the same way the air coming out of an open fridge is. The air radiates heat into space, the air gets heavy, flows downward and south as it hits the ground. What happens when the Arctic is open water for, say, all of August and half of September. Will this not reverse the Polar Hadley cell and suck climate zones northward. This effect should also be seen in the fall as the land rapidly cools off but the huge store of heat in the ocean is warming the air above it. It would likely be extended as freezing starts and Latent Heat is released. Interesting that if this happens it will be just as the grain crops of the Northern Hemisphere are ripening.
http://mtkass.blogspot.co.nz/2008/07/arctic-melting-no-problem.html
Moderator Response:[JH] Link activated.
-
Watchdog at 04:21 AM on 18 March 2015So what did-in the dinosaurs? A murder mystery…
The causes of the deaths of living organisms wrought by the Chicxulub Impact and the Deccan Traps Emissions are clearly manifold. Here's another for instance: A paper published in Nature GeoScience by 12 scientists "Production of sulphate-rich vapour during the Chicxulub impact and implications for ocean acidification " indicates that huge amounts of Sulphur Trioxide were formed by the impact which in turn formed into Sulfuric Acid.. resulting in intense global acid rain, which for starters, is the major culprit in eliminating most of the planktonic foraminifera populations in the oceans.
-
ranyl at 23:41 PM on 17 March 2015So what did-in the dinosaurs? A murder mystery…
"According to figures I have seen, the Chicxulub bolide was estimated to have a mass of about 23/4 trillion tonnes and was shifting at about 20 km/sec (straight down). That equates to a kinetic energy conversion of about 5.5x10²³ joules, and therefore suggests that the energy release was roughly equivalent to about 130 million megatonnes TNT"
I'll take your words for it BtF.
Really illustates just how lethal a large CO2 injection is.
Mind you CO2 releases is the mechanism with the long rep for mass extinctions and near mass exticntions.
And we've put 2billion Hirosh bombes worth since 1998 alone and lots of sulphur and aerosols, just like ahuge volcanic offgasing just we;'ve done it really really quickly in comparison to the past events.
-
swampfoxh at 22:06 PM on 17 March 2015So what did-in the dinosaurs? A murder mystery…
I'm going to need a bigger recycle bin to handle the obsolete lecture notes I use in my climate change classes. I just put forth the bolide theory in last week's session. I have learned to warn the students that change is inevitable in the realm of good science, so an abiding speculation is a valuable asset.
Thanks to the efforts at explaining the Deccan Traps events alongside the bolide impact and thanks for y'alls voluminous comments.
-
Watchdog at 22:01 PM on 17 March 2015So what did-in the dinosaurs? A murder mystery…
@ ubrew12 - Perhaps if a group of geophysicists were given access to a military ballistics testing facility, the Questions surrounding the Chiculub->Earth->Deccan Traps Connection? could be settled once and for all.
-
Leto at 18:13 PM on 17 March 2015It's the sun
Tom @1134 (or others), do you have any idea why the otherwise excellent model-data match for the Cowtan model comes a little unstuck around 1940?
-
ubrew12 at 13:53 PM on 17 March 2015So what did-in the dinosaurs? A murder mystery…
billthefrog@19 said: "Chicxalub could have had percussions... at the hot spot" Yup. As I said, as non-scientist, I feel free to speculate. I was just speculating that maybe, given a molten core of a certain diameter, the shock of Chicxalub could have attenuated in solid matter, most probably, JUST outside that core diameter, and focused itself on a ring on the planetary opposite, of diameter commensurate with the diameter of that molten core. But, no, likelihood that the two events are related remains extremely low. Having said that, Dashiell Hammett would certainly have made that relation.
-
wili at 12:52 PM on 17 March 20152015 SkS Weekly News Roundup #11B
"the only player on the pitch bereft of hair"
btf, thankd for that literally lol moment (much needed right now). I think we've all had similar experiences but mostly don't want to admit them even to ourselves.
Meanwhile, what's freaking me out at the moment is another Mauna Loa reading over 403 ppm (March 15).(Does anyone else notice these things, or do I live alone in my horror at watching the world coming apart at the seams?)
-
John Hartz at 09:31 AM on 17 March 2015It's the sun
Moderation Comment
All: Please do not respond to any future posts by Dan Pangburn until a moderator has had a chance to review them for compliance with the SkS Comments Policy.
Thank you.
-
Tom Curtis at 09:28 AM on 17 March 2015It's the sun
Here is the default Cowtan model including ENSO:

It has an R squared of 0.932, superior to that obtained by Pangburn. I also uses just three parameters, compared to the five used by Pangburn to obtain his fit. In other words, it is a superior model by every measure. Yet Pangburn says of the theory underlying this model that it does not fit the observations.
For comparison, here is Pangburn's own presentation of his model matched against HadCRUT4 and the 95% confidence intervals of Loehle and McCulloch 2008 (a paper fraught with its own problems, but Pangburn's chosen empirical measure):
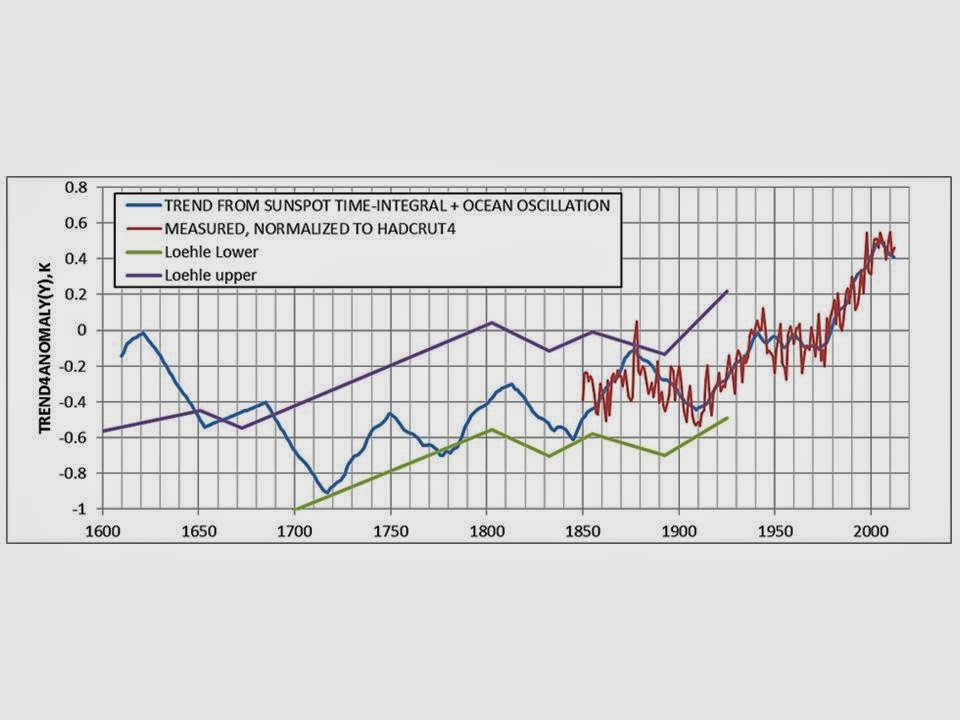
You will notice that in 1625, the retrodicted temperature by his method is 0.5 C above the upper confidence bound of his chosen paleo-reconstruction. Granted, he has another graph later chosen for its lower sunspot numbers in the 17th century in which his retrodicted temperatures only exceed the 95% value by a small amount (and drop below the lower value later on). Use of that graph, however, constitutes a cherry pick. It follows that Pangburn's model (unlike the IPCC models) has been falsified - and he knows it. You know that he knows it because he truncates the graph so that you cannot see just how far his model falls below the lower bound.
Even with the cherry picked sunspot data, the 17th century trend in Pangburn's model is of opposite sign to the data for a century. Contrast Pangburn's evidentiary standard for his own model, which accepts this discrepancy without qualm, to his standard for the IPCC models - which he claims are falsified by a reduced but same sign trend for 15 years.
And this just glances at the evidentiary contradictions in the empirical results of Pangburn's model. (If you want more, and a laugh, check out his predicted temperature for 2014.) It pays no attention to his assumption of constant outgoing energy over time, his ignoring of the relative strengths of forcings, his insistence that CO2 has no effective greenhouse effect contrary to very direct data - all of which fall into the category of simply unphysical mistakes.
Why is Panburn trying to insult our intelligence so with his hypocrisy?
-
rkrolph at 08:51 AM on 17 March 2015It's the sun
Dan,
"mislead the gullible public"
Because someone believes what the vast majority of climate experts believe makes them gullible? If the scientific understanding changed and some other mechanism (non-human) is determined by science to be the cause of global warming then I would believe that. Would that still be gullible? But I don't see how you can call the public gullible for believing what the experts are saying.
-
Leto at 08:37 AM on 17 March 2015It's the sun
edit:
Many of those processes have been discussed extensively on this site, and before making pronouncements that you know better than others you should show evidence of having at least done the basic reading that would let you enter the conversation at anything but newbie level.
-
Leto at 08:32 AM on 17 March 2015It's the sun
Dan,
You greatly underestimate the complexity of the issues.
If you want to take the flattish trend in global surface temperatures since 2001 as proof that the IPCC are mistaken, first you have to demonstrate that you understand what the experts in the field say about fluctuations in those surface temperatures. No-one (except you and other deniers) is claiming that there should be a tight one-to-one correlation between CO2 and global surface temperature over the scale of a few years, because of all the various processes that shuffle heat around. Many of those processes have been discussed exetensively on this site, and before making pronouncements that you know better than others you show evidence of having at least done the basic reading that would let you enter the conversation at anything but newbie level.
You are basically attacking a straw man - and not even an interesting or novel straw man, as this is an issue on which hundreds of articles have already been written, and to which you have added no new understanding.
BTW, I had a look at your blog site, and found it full of similar simplistic musings. The most blatant was a graph in which CO2 and temperature were plotted on the same graph, but with the scales adjusted to make the CO2 curve steep and the temperature curve flat. This is the so-called "World Climate Widget", the use of which is a clear marker of someone who is not interested in the truth, but in mathturbation. This graph has been discussed is several places online, including here:
http://www.realclimate.org/index.php/archives/2014/12/the-most-popular-deceptive-climate-graph/
Any claims you had of knowing beter than the world experts on this topic are completely undermined by your use of such cheap parlour tricks.
Leto.
-
Dan Pangburn at 08:01 AM on 17 March 2015It's the sun
OK, apparently you don't grasp or at least don't believe what I have done.
Paraphrasing Richard Feynman: Regardless of how many experts believe it or how many organizations concur, if it doesn’t agree with observation, it’s wrong.
The Intergovernmental Panel on Climate Change (IPCC), some politicians and many others mislead the gullible public by stubbornly continuing to proclaim that increased atmospheric carbon dioxide is a primary cause of global warming.
Measurements demonstrate that they are wrong.
CO2 increase from 1800 to 2001 was 89.5 ppmv (parts per million by volume). The atmospheric carbon dioxide level has now (through December, 2014) increased since 2001 by 28.47 ppmv (an amount equal to 31.8% of the increase that took place from 1800 to 2001) (1800, 281.6 ppmv; 2001, 371.13 ppmv; December, 2014, 399.60 ppmv).
The average global temperature trend since 2001 is flat (average of the 5 reporting agencies http://endofgw.blogspot.com/). Graphs through 2014 have been added. Current measurements are well within the range of random uncertainty with respect to the trend.
That is the observation. No amount of spin can rationalize that the temperature increase to 2001 was caused by a CO2 increase of 89.5 ppmv but that 28.47 ppmv additional CO2 increase did not cause an increase in the average global temperature trend after 2001.
What do you predict for 2020?
Moderator Response:[PS] Please carefully read the Comments Policy. Compliance is not optional. Note in particular accusations of fraud, and sloganneering. Repeating long debunked myths without offering evidence and demonstrations that you have not even read the science let alone understood do not progress any argument. You would do well to read the IPCC report before making strawman claims about what is and is not predicted.
-
Watchdog at 06:22 AM on 17 March 2015So what did-in the dinosaurs? A murder mystery…
@ billthefrog .. Yes. 130,000,000 MegaTons is equivalent to 9 Billion Hiroshima A-Bombs (@ 15 kilotons apiece); nothing to sneeze at.
Plate Tectonics of 65MYA place the Deccan Traps on the opposite point of the Globe from Yucatan! Exact Aging of the Chronology of the Deccan Traps and Chicxulub remains IMO a subject of some science disagreement - such as indicated by extensive Geochronological research on Deccan Trap Aging from Kanchan Pande in Journal of Earth System Science. ALSO, during that rough time, as one might anticipate from either Asteroidal and/or Volcanic Ejecta/Emissions into the Atmosphere, Earth's Temperature dropped by as much as 8°C - resulting in a lowering of the oceans by c.40 meters - a definite sign of glaciation//global freezing - all resulting in decreased habitable land, rainfall, vegetation, and death from all the above. -
billthefrog at 05:48 AM on 17 March 20152015 SkS Weekly News Roundup #11B
Wol #17
"Having looked it up I see it refers to..."
I know that feeling all too well.
A year or so after leaving Glasgow Univ, I was down in England watching the highlights on TV of a game of football. (That's football - as in played mainly using one's feet.) The commentator, perhaps in a misguided attempt to introduce some polysyllabic terminology into a rather drab encounter, referred to one of the players as "the ubiquitous Andy Lochhead".
As I was later to discover, the context was that the player had, after an initial stable period of 8-9 years at Burnley, changed clubs every 2 or 3 years. Unfortunately, the word "ubiquitous" was one with which I was totally unfamiliar. What, on reflection, I should have done at this point, was to have cracked open the old Oxford English Dictionary.
Instead, I refused to admit to myself that some bloody football commentator had just used a word I didn't know. So, the challenge was to work out what he could have meant, using only the information available.
After some rumination, the (false) Eureka moment arrived. The only distinguishing characteristic possessed by Andy L seemed to be that he was the only player on the pitch bereft of hair.
So, for many years afterwards, I laboured under the delusion that "ubiquitous" was some form of polite euphemism for baldness. It was only when I happened to say to one of chums something along the lines of "... you seem to be getting a little ubiquitous these days ...", that the horrible truth finally dawned.
cheers bill f
-
2015 SkS Weekly News Roundup #11B
In the words of J. Wellington Wimpy: "I'll gladly pay you Tuesday for a hamburger today." We should work on what we have available now to reduce our emissions (renewables), and if we have fusion further down the road that would be just ducky. But we can't depend on a technological Deus ex machina to save us, and we can't just go further down the CO2 hole without paying for it later.
Fusion power has been projected to be available 20-25 years out for half a century - and it remains 20-25 years out. I'm not holding my breath.
-
knaugle at 05:43 AM on 17 March 20152015 SkS Weekly Digest #11
May want to fix the typo in the 1st line "Antractic"?
Then delete my post if you want.
-
It's the sun
Dan Pangborn - I would suggest reading Lean and Rind 2008, who performed multiple regression on temperature data since ~1889, and who conclude:
None of the natural processes can account for the overall warming trend in global surface temperatures. In the 100 years from 1905 to 2005, the temperature trends produce by all three natural influences are at least an order of magnitude smaller than the observed surface temperature trend reported by IPCC [2007]. According to this analysis, solar forcing contributed negligible long-term warming in the past 25 years and 10% of the warming in the past 100 years... [Emphasis added]
They certainly found multiple linear regression both possible and useful, as did Foster and Rahmstorf 2010. If your regresssion neglects multiple factors that physics indicates are significant, your model doesn't describe reality. If you're not including the outgoing energy to space, which scales linearly with effective IR emissivity (which changes with GHG concentrations) and by T4, then you aren't accounting for energy conservation. And if your results indicate that CO2 las little or no effect in complete defiance of radiative physics, that should be a huge red flag regarding your analysis.
Quite frankly, I don't see much of use in your analysis. You might try some hold-out tests (derive your model from perhaps the first half or the second half of the temperature data, and using those computed coefficients see how well you can follow the other half) to see just how dependent your fit is on the initial data presented. I suspect you won't be happy with the results.
-
michael sweet at 05:23 AM on 17 March 20152015 SkS Weekly News Roundup #11B
Ryland,
For my entire life fusion researchers have said they would be commercial in 20 years. I can remember reports from 45 years ago and they are no closer now than they were then. It is better to emphasize technologies that currently work and use fusion when (if) it becomes available.
Fission is always a controversial topic. Some people feel strongly that it is successful and others that it is unsuccessful. Discussions are usually long and do not change anyone's minds.
Since SkS is really dedicated to discussing the science of climate change these solutions are tangential to the basic point of the site. They can be discussed at length at other sites.
-
Rob Honeycutt at 05:04 AM on 17 March 20152015 SkS Weekly News Roundup #11B
...development of trial nuclear fusion power stations is underway and it is hoped the technology will be commercially viable before 2050.
I would say the challenge comes with the unpredictability of when the technology will be commercially viable. And even then, how long after that it takes to bring full scale power plants online.There are an awful lot of unknowns in that package. We all have high hopes for that technology for sure, but it would be a huge mistake to toss too many eggs into that particular basket.
-
billthefrog at 04:04 AM on 17 March 2015So what did-in the dinosaurs? A murder mystery…
@ watchdog
Just to put some numbers to it...
A one megatonne TNT energy release equates to about 4.2x10¹⁵ joules.
According to figures I have seen, the Chicxulub bolide was estimated to have a mass of about 23/4 trillion tonnes and was shifting at about 20 km/sec (straight down). That equates to a kinetic energy conversion of about 5.5x10²³ joules, and therefore suggests that the energy release was roughly equivalent to about 130 million megatonnes TNT.
So it would probably have made for quite a good barbeque.
As the legendary Tzar Bomba only (?) had a yield somewhere around 50 megatonnes, that's why Novaya Zemlya still exists.
cheers bill f
-
Dan Pangburn at 03:19 AM on 17 March 2015It's the sun
KR - The correlation equation initially included CO2 and T^4 considerations but they made no significant improvement in the coefficient of determination (R^2). The correlation with measurements is obviously not linear. Multiple linear regression on the period since 1700 is misleading.
Effectively there are only two free variables in the equation that gives R^2 = 0.9049. C is set to 0 so it has no influence and D simply compensates for the arbitrary reference temperature for the measured temperature anomalies.
The equation was derived using the first law of thermodynamics as described in Ref. 2 in the linked paper.
As shown in Table 1 of the linked paper, R^2 is quite insensitive to the 'break-even' number. 34 gives the highest R^2 1895-2012 and credible estimate back to the depths of the LIA.
The equation allows prediction of temperature trends using data up to any date. The predicted temperature anomaly trend in 2013 calculated using data to 1990 and actual sunspot numbers through 2013 is within 0.012 K of the trend calculated using data through 2013. The predictions depend on sunspot predictions which are not available past 2020
I have made public exactly what I did and the results of doing it including prediction. It will be interesting to see how it plays out.
Moderator Response:[JH] You are now skating on the thin ice of excessive repition which is prohibited by the SkS Comments Policy.
-
ryland at 02:51 AM on 17 March 20152015 SkS Weekly News Roundup #11B
Apologies that should read fossil fuel derived energy
-
ryland at 02:50 AM on 17 March 20152015 SkS Weekly News Roundup #11B
Tom Curtis @5 In your discourse you don't include an assessment of the energy costs of producing the PV cells. Should you do so for completeness? I'm rather surprised that, so far, there is no discussion or even mention of nuclear fission or nuclear fusion. Surely these, and particularly the latter, are of considerable relevance to the supply of non-fossil fuel deived energy. As I expect is common knowledge here, development of trial nuclear fusion power stations is underway and it is hoped the technology will be commercially viable before 2050.
-
Watchdog at 00:03 AM on 17 March 2015So what did-in the dinosaurs? A murder mystery…
howardlee @ 29 I fully concur that Deccan Traps is (IMO at least part of) the demise of dinosaurs.. And, Yes, a quantification of the impact effects of Chicxulub are in order - in order to determine just how "regional" in size it was.. A very rough comparison of Chicxulub with the largest H-Bomb tested by the US (Castle Bravo - 15MT): The area of Castle Bravo's crater is c.3.25 sq km, and its Zone of Destruction extended way beyond its crater. The area of Chicxulub's crater - variously estimated at 180-300 km in diameter - is, conservatively, 10,000 Times Larger than the area of C.Bravo's crater. Tunguska's Energy (Siberia, 1908) is estimated as high as 30MT-TNT (similar to C.Bravo). It leveled c.80 Million trees in an area of 2,150 sq km. POINT? The "region" of Destruction wrought by Chiculub must be far larger than "just" its crater..
-
It's the sun
Dan Pangburn - "Everything not explicitly considered..." - I suggest you read up on omitted-variable bias, which leads to over or underestimating the effect of the factor(s) you regress upon when you leave out other important causal factors. You've only regressed upon sunspot numbers, but it's impossible get correct results by sequential regression when there are multiple factors in play. You need to regress against all of them at once (hence the use of multiple linear regression).
The physics indicate that insolation is a factor. But the physics also indicate that GHGs, natural and volcanic aerosols, albedo, land use, black carbon, etc., are also causal factors. Physics informs any regression analysis - ignore causal factors, and your analysis will be in error.
I will also note that your equation appears to have roughly 4 free variables (your constnats) to relate a sunspots and a cyclic pattern to a single temperature value - that appears to be more a curve-fitting exercise then a causal analysis. As John von Neumann said,
With four parameters I can fit an elephant, and with five I can make him wiggle his trunk.
A 'break-even' point of 34 sunspots (darn, I was hoping the number would be 42) might fit the data and your equation over a particular period, but you are again utterly ignoring the output side of the equation. Under a doubling of CO2 radiative physics indicates a direct forcing of 3.7 W/m2, and a direct warming of 1.1C (ignoring feedbacks for now). Under those conditions your 'break-even' of 34 sunspots will still lead to a radiative imbalance, a warming; the actual balance point would be where the TSI was 3.7 W/m2 lower to match the decreased energy leaving the climate. There is no fixed breakpoint, what matters is the balance between climate energy input and climate energy output, conservation of energy, and ignoring the output makes your analysis simply a curve-fitting exercise on one aspect of energy input.
And as such, your equation(s) have no predictive power. There is no physical basis for your prediction of a 0.3C temperature drop by 2030 - you've simply ignored multiple causal factors and the energy relationships involved.
-
MA Rodger at 22:29 PM on 16 March 2015Arctic sea ice has recovered
Further to #77, it occurred to me that the Feb & Mar SIE data would allow this "late maximum trend" to be examined all the way back to 1979. Plotting SIE(Feb)-SIE(Mar) shows a trend for a freezier March beginning about 20 years ago (1995-2014). That period does yield a statistically significant trend, but not as a date of maximum SIE. Over that period March is getting icier compared with February by 24,000 sq km per year +/-10,000(2sd).
-
howardlee at 22:25 PM on 16 March 2015So what did-in the dinosaurs? A murder mystery…
Joe @ 27 - I have to admit that I just don't know. This post from 2 years ago has some intersting ideas, essentially (a) body size, (b) smart brains, (c) genetic 'evolvability'. This paper suggests mammals may have survived by hibernating through the worst of the catastrophe (no explanation for birds' survival). This paper suggests that creatures able to sustain themselves by eating earthworms survived.
The body size theory is interesting because when you look at the more recent PETM global warming event, evolution tended to select for small body size. But there were small dinosaurs in the Cretaceous, so that can't be the whole explanation. Over to the biologists on that one, but I'm not sure there are clear answers yet.
-
Dan Pangburn at 21:54 PM on 16 March 2015It's the sun
KR – There have been some refinements in the 3+ years since the paper you linked to. The current version of the equation has R2 = 0.9049 (95% correlation) when compared to a normalized average of reported averages of average global temperatures. Everything not explicitly considered (such as the 0.09 K s.d. random uncertainty in reported annual measured temperature anomalies, aerosols, CO2, other non-condensing ghg, volcanoes, ice change, etc.) must find room in the unexplained 9.51%. If the effect of CO2 is included, R2 = 0.9061, an insignificant increase.
The analysis includes an approximation of ocean cycles that oscillate, with a period of 64 years, above and below a long-term trend calculated using the time-integral of sunspot number anomalies as a forcing proxy. The ‘break-even’ sunspot number is 34. Above 34 the planet warms, below 34 the planet cools.
Graphs of results, the drivers, method, equation, data sources, history (hind cast to 1610), predictions (to 2037) and a possible explanation of why CO2 change (fossil fuel burning) is NOT not a driver are at http://agwunveiled.blogspot.com.
Moderator Response:[JH] The use of "all-caps" is akin to shouting and is prohibited by the SkS Comments Policy.
-
howardlee at 21:44 PM on 16 March 2015So what did-in the dinosaurs? A murder mystery…
Watchdog @ 25 - the dates have been refined since then. Also the idea of "antipodeal focusing" of impact energy has been ruled out by scientists who have looked at the association. See @9.
Watchdog @ 28 - You are correct - there's a large crater and it must have been at least a regional disaster. But as I explain in the article, when the evidence for its global reach and its synchronicity with the mass extinctions is examined, it comes up short. Absolutely it's a puzzle, but one that fits in with the fact that the earth has been peppered with impacts (admittedly few as large as Chicxulub) throughout the phanerozoic, and so far none has been linked to a mass extinction except Chicxulub. The point of the article was to highlight that the previously assumed global impacts of the Chicxulub impact are not supported by the geological evidence reported to date, whereas the Deccan eruptions do have very strong date and environmental evidence supporting their role.
As is so often the case, more research is needed, especially on the impact, its high-resolution absolute date, and it's effects.
-
MA Rodger at 20:45 PM on 16 March 2015Arctic sea ice has recovered
bozzza @76.
I think the 'trend' is probably very small, far less than those weilding mention of it appear to imply, as I was myself doing @74. It is probably used more a cautionary note that there can be a very late daily maximum.
The daily data from JAXA fails to give a statistically significat trend (and I use 9-day averages to reduce the noise), yielding a rather large +7days per decade +/-15 days. The average for the JAXA data (2003-14) is day 72.4. The climatology from NSIDC (1981-2010) gives the maximum 9-day period as day 70. These two suggest a trend of 1.8 days per decade.
That said, I have elsewhere now bravely called this years maximum as having happened in February (coz I hate faffing about) which would put the 2015 maximum as a very early day 55.
-
Leto at 17:52 PM on 16 March 2015Sea level rise predictions are exaggerated
bozzza:
www.skepticalscience.com/Extreme-Flooding-In-2010-2011-Lowers-Global-Sea-Level.html
-
bozzza at 17:23 PM on 16 March 2015Arctic sea ice has recovered
MA Rodger @ 74, How strong is the trend toward a later maximum freeze?
-
bozzza at 15:36 PM on 16 March 2015IPCC is alarmist
The reason the IPCC projections are necessarily conservative is that all participating countries have to agree on the information included!
-
bozzza at 15:20 PM on 16 March 2015Sea level rise predictions are exaggerated
@ comment 5, is there any particular explanation for the drop in sea level circa 2011 in both the original graphic and the updated graphic? I looked up sunspots and there is some correlation but could that even make sense why it should?
Are there any other explanations that work better?
-
bozzza at 14:18 PM on 16 March 2015Animals and plants can adapt
To Anthony @50: Don't know much about birds but mentioning "migration" reminded me of a doco I saw the other night(about "song-birds" I think!?!) that said birds in the Northern hemisphere and the Southern hemisphere act differently. I think there may be a climatic reason to it but I can't remember what it was!
-
bozzza at 12:46 PM on 16 March 2015Animals and plants can adapt
Once desertification takes hold it is an irreversible process. That is not to say the rain won't fall elsewhere yet where and in what proportion?
The concept of non-linearity means there are no promises!
Who can tell me if the economic rise of China has yet been reflected in the Keeling curve, for instance?
-
Wol at 12:24 PM on 16 March 20152015 SkS Weekly News Roundup #11B
Tom Curtis @ 16.
I apologise: my understanding of "disingenuous" was slightly incorrect in that I have always thought of it as a soft, slightly ironic way of advancing a proposition. Having looked it up I see it refers to insincere, dishonest, untruthful, false, deceitful, duplicitous, lying, mendacious;
hypocritical. Hence the apology.Far from what I intended.
-
bozzza at 11:24 AM on 16 March 2015Review of Climatology versus Pseudoscience
The anti-cyclones coming off of Antarctica do not reach into the Australian continent like they once used to and it is a long term observation delivering decreased rainfall to the south of Western Australia. The wind patterns are changing in the Southern Hemisphere aswell --> PURE FACT!
Question: has the economic rise of China been reflected in the Keeling curve yet? DON'T PANIC YET WILL YA!!
Moderator Response:[JH] The use of "all-caps" is akin to shouting and is prohibited by the SkS Comments Policy.
-
bozzza at 10:40 AM on 16 March 2015Examining Hansen's prediction about the West Side Highway
It pains me to read that a scientist of any qualification could imagine a regular doubling of a rate of sea level rise i.e. a faster than exponential rate of change!
No wonder he corrected himself.. (He did correct himself, didn't he!??!)
-
Tom Curtis at 09:30 AM on 16 March 20152015 SkS Weekly News Roundup #11B
Wol @15, I have read your post, and cannot see any coherent argument. Nor can I see any reason for your offensive comments regarding me. Therefore, other than to note that I have read it, I see no reason to respond.
-
Wol at 09:13 AM on 16 March 20152015 SkS Weekly News Roundup #11B
@Tom Curtis:
You are right but IMO a little disingenuous. As a historical fact yes, the sun has made gas available at a tiny overall efficiency, but who cares?
One might as well argue that all the energy involved in laying down the deposits of the various elements that are used to make PV panels - moving tectonic plates, weathering, sedimentation and the like, should be included in PVs energy budget.
The sun's energy is, whichever way you look at it, essentially unlimited. Making full use of the small percentage that we can tap through wind, wave and solar is really only a matter of scale when you get down to it.
If it is "merely" a choice between an uninhabited earth and more expensive energy, perhaps the latter might be seen as the sensible choice. So many of the deniers' arguments centre on the cost side of the equation, and too many people spend time fruitlessly arguing on their terms.
I will omit mentioning population growth as it seems to be a taboo topic even here.
Moderator Response:[PS] All comments must conform to the comments policy and the closest to a taboo subject is politics. Provided your comments conform to all aspects, then they remain. However, it is hard to see how any discussion about the problem of too many wealthy high-energy consumers could progress without moving into politics.
-
Jim Hunt at 08:00 AM on 16 March 20152015 SkS Weekly News Roundup #11A
OPOF @25 - The assorted area measures are based on a grid of sea ice concentration numbers. If a particular grid "square" has 75% concentration then 0.75 x the area of the grid "square" are added to the total. Sum over the entire Arctic.
"Wipneus" at the Arctic Sea Ice Forum calculates the area/extent metrics for a wide variety of satellites and algorithms. For an overview see:
http://GreatWhiteCon.info/resources/arctic-sea-ice-graphs/#Area
Volume is of course the best measure of the "amount" of sea ice left, but it is notoriously difficult to measure!
Bill @30 - Different folks use different satellites, different "algorithms" and different "masks" when doing their sums. On top of which the Scandinavians include the Great Lakes and other obscure places in their "Arctic" calculations!
Prev 601 602 603 604 605 606 607 608 609 610 611 612 613 614 615 616 Next


