


 Arguments


Recent Comments
Prev 593 594 595 596 597 598 599 600 601 602 603 604 605 606 607 608 Next
Comments 30001 to 30050:
-
Rhoowl at 00:59 AM on 6 April 2015Models are unreliable
ask yourself what is the purpose of climate models. As I see it the purpose is to predict the future of climate. However, the future of climate can not be predicted because it is a non linear chaotic system. The idea of increased co2 in the atmosphere causing increased temperature is a linear concept. Increasing the temperature causing sea level rise is a linear concept. In fact increasing temperate may set off a series of events that leads you into an ice age. Can the models predict these occurances, no they can not. in fact the use of models already have proven to be ineffective for prediction of global temperatures. they are unable to deal with chaotic events such as el ninos, volcanic eruptions, etc.
in fact we don't really know what the future will bring and therefore it is easier to adapt to the change than to prepare for and event that is not likely to occur,
Moderator Response:[TD] See the response to the myth "Climate is Chaotic and Cannot Be Predicted." After you read the Basic tabbed pane there, read the Intermediate tabbed pane. If you have questions or comments about chaos, please make them on that thread, not this one. Everybody who wants to respond to that particular aspect of Rhwool's comment please do so over there, not here. Other aspects of Rhwool's comment are legitimately responded to on this thread.
[TD] Rhwool, please read the original post at the top of this thread, which presents empirical evidence of the success of climate models. After you read the Basic tabbed pane, read the Intermediate one. Please restate your claims that climate models cannot predict, in specific, concrete ways that confront that empirical evidence. Vague, evidence-free, and especially evidence-contradictory, claims have no place in a scientific discussion and therefore no place on this Skeptical Science site.
-
Bob Loblaw at 00:52 AM on 6 April 2015It hasn't warmed since 1998
Peter:
You've already had Tom and DSL give you fairly lengthly replies. I will not add to much to the fray, as one of this site's policies is to try to prevent "dog-piling" - a case where an individual gets a large number of responses from many people, which can be overwhelming.
...but, in comment #326, you said "Selecting 2001 as a start date seems to me to be a fair compromise". Taking a skeptical approach, what does the following suggest to you:
- picking 1998, 1999, 2000, or 2001 as the starting year makes a large difference in the trend that is calculated.
Should this not be a warning signal that you should not put a lot of trust into any of these numbers, when trying to examine a long-term warming signal?
-
DSL at 23:04 PM on 5 April 2015It hasn't warmed since 1998
Further, Peter, you claim to be an "AGW skeptic," but your argument is in regards to climate modeling. The theoretical basis of AGW does not emerge from climate modeling. The theory of AGW is simply that humans have enhanced the greenhouse effect, causing greater-than-natural warming. Climate modeling--and here I'll refer specifically to comprehensive general circulation modeling--projects climate change on the multidecadal scale and at fairly low resolution. The resolution is getting better (in some ways) in both time and space, but accuracy is not at the subdecadal scale yet.
All models of real world phenomena are inaccurate. Are they also then failures? If you take a step back and look at where the observed trends could have reasonably gone based simply on past history (a layperson's heuristic), you'd be forced to come to the conclusion that climate modeling has done remarkably well with projecting temp, sea level rise, OHC, etc. (not Arctic sea ice area/extent).
Consider this. Here's the key quote from Easterbrook:
"I find these similarities remarkable, because none of these patterns are coded into the climate model – they all emerge as a consequence of getting the basic thermodynamic properties of the atmosphere right. Remember also that a climate model is not intended to forecast the particular weather of any given year (that would be impossible, due to chaos theory). However, the model simulates a “typical” year on planet earth. So the specifics of where and when each storm forms do not correspond to anything that actually happened in any given year. But when the model gets the overall patterns about right, that’s a pretty impressive achievement."Anyway, any further discussion of modeling should be taken to one of the modeling threads. You can see all new comments across all threads by clicking on the "comments" link below the middle of the SkS header.
-
Tom Curtis at 19:09 PM on 5 April 2015Climate sensitivity is unlikely to be less than 2C, say scientists
bozza @5, the IPCC acceptance procedure is outlined in the figure below:

The key involvement of government is that they, along with "experts" can review and comment on the first order draft. As experts can also review and comment on the first order draft, and to be an expert so far as the IPCC is concerned, you merely need to register as one, that is not a channel of unusual government influence. This is particularly the case in that authors can respond to comments simply by noting why they think they are wrong, or ill informed. Governments also get to vote to accept the WG1, WG2 and WG3 reports. However, they do not get to reject part of the report, or rewrite it in any way. They either accept the report as a whole, or reject it as a whole. That severely limits any influence they can have on the reports, and in particular on individual items within the report. Finally, governments do get to vote on and accept the Summary for Policy Makers line by line. As, however, that is a summary of the report which stands independently of whatever they do to the Summary for Policy Makers, it can have no influence on the report outside of that summary. Finally, all such votes are very public affairs. Fighting too hard against the scientific consensus as reported in the report itself will come at a diplomatic cost.
The idea of political interference making IPCC reports too conservative may be convenient but it does not have much evidentiary support.
-
bozzza at 18:08 PM on 5 April 2015Climate sensitivity is unlikely to be less than 2C, say scientists
'Bias' might indeed be a suitable word because it is actually well assumed that all figures in IPCC reports are 'conservative' due to the process of all participating governments first having to agree as to what is included.
-
Tom Curtis at 15:21 PM on 5 April 2015It hasn't warmed since 1998
Petter99 @324, the UAH trend from 2001 to current is 0.070 ±0.217 °C/decade. That compares to an IPCC projected trend over the interval of 0.2 °C/decade. That is, it is well within error of the IPCC projection. That the error margin on measurement is larger than the projected temperature rise, however, tells you that it is too short a period to test the theory.
The RSS data should be ignored. It uses the same basic data as UAH but the processing results in values distinctly different not only to UAH, but also to all other temperature records. Until it is found out why that is, and a correction made, it must be regarded as inaccurate for short term trends.
Beyond that, by shifting forward the start point to 2001, you eliminate the large El Nino at the start of the series, but increase the impact of the large La Nina at the end of the series. Ergo, based on what we know about climate states about the world, we know that that trend is low due to short term variability rather than due to a low value in the underlying trend. Indeed, without AGW, we would have expected the trend to be strongly negative. (That still makes it an improvement over the previous post. The claim based on 1998 can be refuted by statistics alone. With regard to a 2001 start, you need to know something more about the climate system than is contained in the temperature data itself.)
If you want to know what the trend is like without the impact of ENSO states, the simplest method is to compare the trends for El Nino year, La Nina Years, and neutral years:
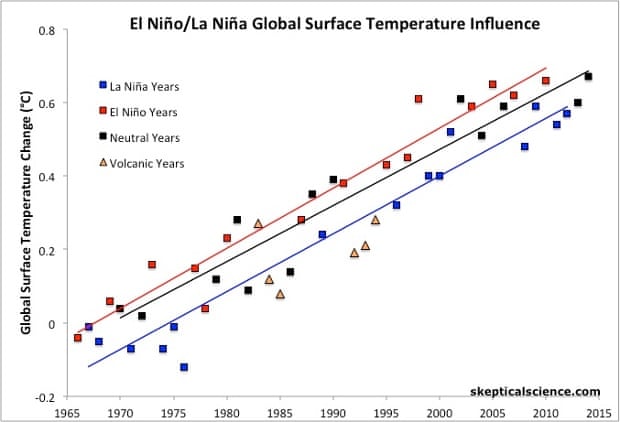
As you can see, they are very similar, quite close to the IPCC projection, and have not changed in recent years. What has changed is that we have got more than usual La Nina years of late following on froma period of slightly more than usual El Nino years.
As to why we shoud not simply project the recent temperature trend, the forcing from GHG is not expected to remain constant, or increase linearly over the 21st century. Ergo it is silly to expect temperature trends to continue as though they are going to increase linearly. Particularly if you take a short term trend known to be reduced by a late occuring La Nina to project it. If you are going to project statistically from the temperature record, you should determine the relationship between forcings and that temperature record and then project according to the assumption that the relationship between forcings and temperature record will remain fairly constant. Dr Cowtan has a model that allows you to do this. You can even scale the forcings to see if you can get a better fit to temperatures than that embodied in the assumption that temperatures respond equally to all forcings. Good luck finding a fit that doesn't either obviously fail relative to the intuitive assumption of equal effect from different forcings over past temperatures, or else more or less reproduce IPCC projections.
-
Peter99 at 14:49 PM on 5 April 2015It hasn't warmed since 1998
Sorry again as I've been rushing this as I have to go out just now. The start date I chose was 2001 becasue to pick 2000 would have been cherry picking for AGW as there was a steep decline after the El Nino. Selecting 2001 as a start date seems to me to be a fair compromise if you look at the graphical trend.
-
Peter99 at 14:37 PM on 5 April 2015It hasn't warmed since 1998
Sorry, another typo...."2000 and end date of 2105" should be "2000 and end date of 2015" -
Peter99 at 14:35 PM on 5 April 2015It hasn't warmed since 1998
OK, points above taken. Let's eliminate the 1998 El Nino and only do a calculation for this century. I used your calculator and put in start date of 2000 and end date of 2105 for both RSS and UAH.RSS gave -0.0048/year and UAH gave +0.0066/year.Let's use the high figure of 0.0066/year which of course means 0.66 DegC rise for 2000 to 2100. Let's add that to the 0.8DegC rise up to 1999 and that gives 1.46 DegC rise from 1900 till 2100.Of course the above assumes that the current rate so far this century will continue. But getting back to the point I made in my original comment, this will be significantly less than the IPCC target of 2.0DegC. So should this target be retained or changed to reflect heat entering the ocean? -
Tom Curtis at 14:12 PM on 5 April 2015It hasn't warmed since 1998
Peter99 @316, you are not a skeptic of the theory until you apply as much skepticism to criticisms of the theory as you do to the theory itself. Had you done so, and using the HadCRUT4 data, you would have noted that the temperature trend from 1975 to 1997 was 0.16 C per decade, while the temperature trend from 1975 to current is 0.17 C per decade. That is, the seventeen years of "temperatures [being] plateaued" has increased the trend by 6.25%.
This must be the first time in history that a decrease in the slope (the temperature plateauing) has actually increased the slope.
The reason for this unusual result is not hard to find. It is that you have been conned. Specifically, if you take a series with no overall trend and random fluctuations about the mean value, and look only at those segments which start at a local peak value above the mean, on average those segments will have a negative trend. If you only look at those segments that start well above the mean value and finish well below the mean value you might even find segments that show a statistically significant negative slope. That will not prove that the line does not exhibit no trend. It will only prove that you have cherry picked your start and end points.
That is exactly what the purported "skeptics" of AGW have done. They take an interval starting with a random fluctuation above the trend value due to the strongest or second strongest El Nino event on record (depending on which index you use). You then take the interval to a period containing one of the strongest La Nina events on record (2011/12), and which is consequently below trend values. They then treat that segment as important, even though the trend in that period is not statistically different from IPCC projections, let alone the ongoing long term trend.
On top of that they add a little verbal legerdemaine. They start by saying that in that period the trend is not statistically different from zero; and end by talking about a period with no trend ("trend has plateaued", "global warming has stopped"). The trend, however, is not statistically distinguishable from IPCC projections, so that it is no more true to say the trend has plateaued than to say it matches IPCC projections. This they are carefull not to mention.
So, please prove that you are in fact a skeptic about AGW, and apply your skepticism both ways. If you do so, you will stop buying the rubbish you just tried to propogate here and start wondering why the arguments of so-called AGW skeptics are so often indistinguishable from bald-faced lies.
-
DSL at 14:10 PM on 5 April 2015It hasn't warmed since 1998
The full quote from the Met in response to David Rose:
Q.1 “First, please confirm that they do indeed reveal no warming trend since 1997.”
"The linear trend from August 1997 (in the middle of an exceptionally strong El Nino) to August 2012 (coming at the tail end of a double-dip La Nina) is about 0.03°C/decade, amounting to a temperature increase of 0.05°C over that period, but equally we could calculate the linear trend from 1999, during the subsequent La Nina, and show a more substantial warming.
"As we’ve stressed before, choosing a starting or end point on short-term scales can be very misleading. Climate change can only be detected from multi-decadal timescales due to the inherent variability in the climate system. If you use a longer period from HadCRUT4 the trend looks very different. For example, 1979 to 2011 shows 0.16°C/decade (or 0.15°C/decade in the NCDC dataset, 0.16°C/decade in GISS). Looking at successive decades over this period, each decade was warmer than the previous – so the 1990s were warmer than the 1980s, and the 2000s were warmer than both. Eight of the top ten warmest years have occurred in the last decade.
"Over the last 140 years global surface temperatures have risen by about 0.8ºC. However, within this record there have been several periods lasting a decade or more during which temperatures have risen very slowly or cooled. The current period of reduced warming is not unprecedented and 15 year long periods are not unusual."
-
DSL at 14:06 PM on 5 April 2015It hasn't warmed since 1998
The "testing" comment could have been read as impatience. I was signaled to read it that way by your substantial comment. In that comment, you focus on the language being used and do not show how the language is at odds with the science. You simply pit the language of those linked against the language of SkS. If you were truly skeptical, you'd be checking the language used against the actual science.
I did not claim there was no "pause." Indeed, I pointed out that there were others. However, my claim was that the pause was in global mean surface temperature and not in the overall (well, sub-stratospherical) climate system.Hans Von Storch is simply wrong in applying "pause" to "climate change." Climate change and global warming aren't even the same thing (rather obviously, as there is more to climate than temp). Even if the enhanced greenhouse effect was done being enhanced, climate change would still be taking place--and would until the entire system came to equilibrium with the new level of forcing. Von Storch was being careless.
As for the Met Office quote, I can only assume that you snagged the quote from somewhere other than the Met blog post, as the post explains everything in detail.
-
Peter99 at 13:56 PM on 5 April 2015It hasn't warmed since 1998
DSL,
Bit puzzled by your incredibly hostile and accusatory tone. This is my first time at your site and he two "testing" comments were because I was on page one and didn't see my comment appear as it was on page 7. Bit thick of me but why do you instantly attack me.
You say I have got the pause wrong but I quoted the UK met office and Hans Von Storch of the IPCC saying that the pause is real. Why attack me for their quotes?
Instead of personal attacks on me, could you please address specifically what I said in my first comment. Thanks.
-
DSL at 13:41 PM on 5 April 2015It hasn't warmed since 1998
Correction: elevator > escalator. Also, ocean heat content: http://www.nodc.noaa.gov/OC5/3M_HEAT_CONTENT/heat_content2000m.png
And sea level rise (supporting OHC measures): http://sealevel.colorado.edu/ -
DSL at 13:36 PM on 5 April 2015It hasn't warmed since 1998
Peter, your account will be deleted if you persist with the "testing" garbage.
You're going to get plenty of response, and hopefully you'll engage honestly in dialogue. Here's the short version of what you're going to get:
1. Regardless of the language people are using, 93%+ of the thermal capacity of the climate system is wrapped up in the oceans.2. Surface temp is noisy. As you can see from the "elevator," there have been many 6-8 year periods of insignificant or even negative trend over the last forty years.
3. 1998 is a cherry pick with regards to statistial significance. If you start a trend on a massive outlier, statistical significance is going to be hard to establish for a while.
4. Even so, look at the surface trend from 1970-2008. It's 0.178C per decade, right about the expected trend. How can that be! How can it be thus if there has been no significant warming for 17 years! It can be thus because the actual "pause" is not 17 years but more like seven years.
5. Start with the physics, like a real skeptic. Do you understand the greenhouse effect?
-
Peter99 at 13:33 PM on 5 April 2015It hasn't warmed since 1998
Correction above...."atmospheric CO2 concentrations to within 2Deg C of preindustrial levels" should be "atmospheric temperatures to within 2Deg C of preindustrial levels
-
Peter99 at 13:23 PM on 5 April 2015It hasn't warmed since 1998
I am a recent convert to AGW skepticism but am still trying to keep an open mind.
Following are two quotes by prominent global warmists accepting that atmospheric warming has had no statistically significant increase since the El Nino of 1998
Met Office Blog – Dave Britton (10:48:21) – 14 October 2012
“We agree with Mr Rose that there has been only a very small amount of warming in the 21st Century. As stated in our response, this is 0.05 degrees Celsius since 1997 equivalent to 0.03 degrees Celsius per decade.”
Source: metofficenews.wordpress.com/2012/10/14/met-office-in-the-media-14-october-2012Dr. Hans von Storch – IPCC lead author - Spiegel – 20 June 2013
“…the increase over the last 15 years was just 0.06 degrees Celsius (0.11 degrees Fahrenheit) — a value very close to zero….If things continue as they have been, in five years, at the latest, we will need to acknowledge that something is fundamentally wrong with our climate models….”“So far, no one has been able to provide a compelling answer to why climate change seems to be taking a break.”
But your article above is saying that we should be looking at the heat going into sea to determine "global warming".
However the IPCC's sole target is to keep atmospheric CO2 concentrations to within 2Deg C of preindustrial levels and if we add the 0.8DegC that the planet warmed prior to this century(0.8 degC), to the projected increase based on Hans Von Storch's figure above of 0.06 per 15 years then that gives us 0.8 + 0.06* 100 / 15 = 0.8 + 0.4 = 1.2 DegC which is well within the 2.0 DegC limit.
Seems to me that AGW is unfalsifiable. When temperatures were rising in the 1990's that was proof of AGW, but now that temperatures have plateaud so far this century, the "proof" of AGW moves elsewhere.
One last question...If global temperature increase stays at the present near zero rate until 2100, will the theory of AGW need revision?
-
Tom Curtis at 09:50 AM on 5 April 2015We must defend science if we want a prosperous future
chriskoz @5, what I primarilly had in mind is that on certain key issues in recent Australian federal politics (refugees, global warming, NBN, response to the GFC) the evidence from experts clearly favours the position adopted by the ALP, or more left wing parties (in the case of refugees). The same applies to certain "cultural wars" where, for instance, the dispute between the so-called "black arm band" view of history, and that favoured by the right amounts the right refusing to accept evidence other than from written documents as regards the treatment of aborigines in the past; and the refusal to teach events that do not bring credit to Australia in Australia's past. (I believe Australia's history is very creditable, with more in its favour than against it. I do not think, however, that is an excuse to not teach that Queensland practised slavery (call blackbirding to create a legal fiction) up until federation, or to not teach that the last official (as in carried out by a policeman, and condoned by a later official enquiry) massacre of aborigines occurred in 1928, or the host of other facts inconvenient to Australian triumphalism.
However, I think you can go further than that. Specifically, certain areas of knowledge (and Economics in particular) are, IMO, clearly value ladened, despite a claim to be value neutral. That value laddened nature is used by the right in support of a lot of their economic policies, whereas a value neutral economics would more strongly favour a left wing (but not Marxist) perspective. Further, I believe that you can have an objective ethics, which pretty much rules out a right wing perspective in politics. However, while I think these points are evidence based, the emperical evidence that they are valid would rely on their actually being practised, and even then would be unlikely to be acknowledged by most of those favouring a right wing perspective (for the obvious reason that while society would be better of, the rich would not necessarilly be better of).
Finally, beyond, that - I think it is trivially easy to show that may right wing politicians act in direct contradiction of their purported values. This is not directly evidence based as it accepts the purported values at face value. It is based, however, on reason. As one example, most right wing politicians in Australia purport to be Christians, and certainly Tony Abbot and John Howard do. Therefore, they purport to accept the values shown in Matthew 25: 40-44, in particular the value that turning away a stranger in need deserves hellfire. And what is the coallition refuge policy except the institutionalized turning away of strangers in need?
-
Tom Curtis at 09:21 AM on 5 April 2015Climate sensitivity is unlikely to be less than 2C, say scientists
PluviAL @3, I do not see any consistent evidence that the IPCC has a systematic bias to be conservative. Obviously there are instances in which they have underestimated responses to climate change, of which the most famous is Arctic sea ice extent, but there are also other areas in which they have overestimated the response. One of these is Global Mean Surface Temperature, where their predictions have been consistently warm relative to observations (if only by about 15%). The pattern of some areas underestimated and some overestimated is what we would expect with imperfect knowledge and no institutional bias. Of course, it is possible that if all areas are taken into account, a bias exists; but no meta-study comparing IPCC projections with observations across all areas of climate science exists (if we exclude the IPCC reports themselves). What is more, such independent reviews of the science as exist, while less comprehensive than the IPCC, tend to agree with the IPCC in the areas of overlap.
More importantly, climate scientists have been surveyed about the accuracy of the IPCC reports, and while some think it conservative, others think it to adventurous, but the majority think it reasonably accurate. As the IPCC is supposed to report on the scientific consensus, that suggest they are doing their job well.
-
PluviAL at 04:22 AM on 5 April 2015Climate sensitivity is unlikely to be less than 2C, say scientists
My simple reading of the process, is that the IPCC has a systematic bias to be conservative. What this mean is that we are more likely to continuously find that they produce underestimates.
By my same simple outlook, we must develop tools to address, and use all feedback mechanisms; not just such clumsy ideas as ocean clouding with salt spray, or high atmosphere areoles. We can develop powerful tools that use the energy in the atmosphere itself to produce feedback mechanisms at the desirable levels to attain the adjustment we must have, and to change it when a different outcome is desired as we find that we made a mistake or, we need one effect in one region but the opposite in another.
For example: If the gulf stream slows or stops, we may have to warm Europe, and cool Australia at the same time. Such tools must be developed and advanced. We can do it; don’t just say it is impossible without knowing the relevant arguments.
-
Elmwood at 02:46 AM on 5 April 2015Climate sensitivity is unlikely to be less than 2C, say scientists
I thought ECS as found in the geologic record averages around 3 degrees celcius? Models should not be used as the only line of evidence for estimating what ECS will be.
-
denisaf at 22:48 PM on 4 April 2015We must defend science if we want a prosperous future
The article deals with why society should take more notice of scientific findings. i am a retired aeronautical research scientist so have an interest in this issue. It is often said that science if advancing the frontiers of knowledge. The reality is that advances in physical science are illustrating how much knowledge of physical operations were unknown, so by extrapolation, how much is still unknown. Science has only fairly recently provided understanding of the deleterious aspects of the combustion of fossil fuels to supply energy. That has been a major failing of science but there are many others.
-
ranyl at 22:01 PM on 4 April 2015Sea Level Rise is Spiking Sharply
Thanks Tom,
I never thought iceshelf per se collapse would cause a sea level rise for sure, th ebreak up of the above sea level icesheet itself.
The natrue image is quite schematic also mind :), and the line number 3 in the Antartica Glaciers image does seem to show quite a hollow developing, as for Icesheet section break up due to undermining, it is all going to depend on the rate of underwater melt, the slope of dropoff and the rate thinning on top.
Overall however do still the potential for sudden icesheet edge instability due to undermining. Looking at the topography here past the GL point is melting at bottom, still do wonder about an undermined column scenario?
And looking at Thwaites, past that 150km ridge and it looks like a steep column again, with a very thick above sea level icesheet.

Anyway can't help suspecting that the melting of these seabed grounded icesheets is going to be interesting to watch, full of little surprises and is an accelerating situation as things aren't going to cool down anytime soon.
-
bozzza at 18:35 PM on 4 April 2015We must defend science if we want a prosperous future
How can all Labor voters be called intellectual?
Moderator Response:[GT]
Bozza
If you have something of substance to say wrt this piece fine, but one-liner drive-by's don't cut it and breach site guidelines.
-
bozzza at 18:30 PM on 4 April 2015Understanding adjustments to temperature data
..more like a "repetition versus error-of-repetition"(my summation atleast) concept according to him... but I only read 3/4 of it I must admit before I lost the thread so,..!!
-
bozzza at 18:25 PM on 4 April 2015Understanding adjustments to temperature data
@ 57, I read The Mechanism of Mind by Edward Debono once and he was saying that the error of the mind was what made it work so efficiently and/or effectively plus or minus a few definitions of accuracy(lol)... so kind of the same thing!! (...it was a repetition versus error type scenario like what you are saying, perhaps!)
- perhaps not, but I'm willing to bet the book has bred ideas!
-
Glenn Tamblyn at 17:30 PM on 4 April 2015Sea Level Rise is Spiking Sharply
Pluvial.
There is another aspect to consider. We have also increased our above ground water storage, our empoundment. I don't have the figures to hand (maybe someone else can find them) but I seem to recall that a study found that the depletion of groundwater is , seredipitously, roughly balanced by the increase in above ground water storage in dams etc.
Another factor to consider. Although we aren't in much of an El Nino at present we have had 'the El Nino you are having when you aren't having an El Nino' for some time now. This might be a factor.
Look at Figure 1 in the post, around 1997/98 when the big El Nino happened. Sea level spiked up for the opposite reason to the drop in 2011. Maybe an El Nino-lite is contributing to current SLR.
Also, we have had high sea surface temperatures in the north Pacific recently. If this reflects recent heating of the upper levels of the ocean there this might be a factor. The Coefficient of Thermal Expansion for water varies significantly with temperature. Warming already warm water produces greater expansion (which we would see as SLR) than warming cold water by the same amount.
-
PluviAL at 14:54 PM on 4 April 2015Sea Level Rise is Spiking Sharply
Underground water is roughly equal to the water content in the cryosphere. If we have drawn 65 km3 from 2004 to 2013, then India, China, Arabia, Brazil, Argentina, Australia, and central Asia, probably have overdrawn a ground water by similar figures. At 65 km3 by each area, that only accounts for 1 mm of SLR.
Somehow it seems that this figure is under-considered, and thus under-estimated. If the potential contribution from ground water is equal to the cryosphere, and we have been sucking on that tit as hard as on the fossil fuels, then it might be that there is a lot more SLR that has to be accounted for. Thus, this “spike” might not be an anomaly, but what it looks like; a real rise in sea level.
-
chriskoz at 13:24 PM on 4 April 2015We must defend science if we want a prosperous future
I have hard time understanding the authors association of "deconstructionist mind-set" with "intellectual Left". The definition of "deconstructionism" apears in here:
But from the Left, or some segments of the intellectual Left, a deconstructionist mind-set has partly undermined an evidence-based approach to policy making or problem solving
and here:
The pluralist or deconstructionist or post-modern theory of knowledge is contemptuous of expertise, rejects the idea of hierarchies of knowledge and asserts the democratic mantra that –- as with votes in elections –- every opinion is of equal value, so that if you insist that the earth is flat, refuse vaccination for children or deny that HIV-AIDS is transmitted by virus, your view should be treated with respect.
That has nothing to do with "intellectual Left" which, at least in Australia, means support of pro-labour, pro-social, and pro-environmental policies.
The deconstructionism, as described above, can be attributed equally to both Left and Right. E.g. current PM, Tony Abbott, a hard-core right winger, can easily be described as a "deconstructionist" literally as described above. As an opposition leader, he used to critique all policies of the governing Labor party very successfully. In fact he built his entire political career on the deconstruction of his political opponents.
-
chriskoz at 12:45 PM on 4 April 2015We must defend science if we want a prosperous future
Tom@3,
The tragedy is that straightforward evidence based reasoning strongly supports a left wing point of view.
Can you elabrate that point? I have not heard such opinion yet. Do you mean, that right wingers are unable/less able to accept evidence than left wingers? Do you mean such observation aplies to Australian/Westminster political system, or any contemporary system in general?
-
Tom Curtis at 12:33 PM on 4 April 2015Sea Level Rise is Spiking Sharply
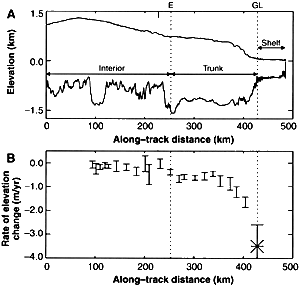
ranyl @25, that image is very schematic. A more detailed image is avialable from Nature:

As you can see from the third panel, by "thinning" they mean the reduction of the domed section. That is a direct consequence of the faster flow, which in turn is a consequence of the reduction in the extent of the floating ice shelf along with the retreating grounding line. Because the Pine Island Glacier is in fact a glacier, it will be transversed by a large number of crevases meaning structural support of the ice beyond the grounding line will be virtually non existent, ie, virtually all ice beyond the grounding line will be floating ice.
As to sudden increases, it was calculated by Noerdlinger and Brower that "If all the extant sea ice and floating shelf ice melted, the global sea level would rise about 4 cm." Clearly not all of the floating ice will melt in a year, or even 50 years. Ergo "sudden increases" from the collapse of ice shelves are unlikely to contribute more than a millimetre or two to sea level rise in any given year, and probably not even that. For comparison, Shepherd et al calculate a 0.49 mm contribution to sea level rise from the melting of floating ice from 1994-2004. That comes from a reduction "...that exceeds considerably the reduction in grounded ice over the same period", something we would expect to continue.
-
ranyl at 11:36 AM on 4 April 2015Sea Level Rise is Spiking Sharply

Sorry if the image is too big,
http://cdn.antarcticglaciers.org/wp-content/uploads/2013/07/PIG.ai_.jpg
Thanks Tom,
I agree the ice shelf is definately floating and supporting the icesheet edges.
Looking at the line 3 on this graphic, (present day), it seems that the domed bit above the water line is not floating and is still suported by the ice pillar below, which is looking more and more eaten into.
If the weight of that domed above sea level supported part of the icesheet became such that the water in the cavern and the ice column couldn't support it anymore (the pillar is shrinking and I think the icesheet is gaining weight due to regional warming induced more snow). I know it is only a graphic but on this one more but on yours as well I can imagine a reasonable sized section of above sea level icesheet sort breaking off, and I think those icesheets hold quite alot of ice, up to a 1m Pine Island I think, so I do wonder if a couple of cm's of sealevel rise worth could snap fall off from time to time as the below sealevel WAIS icesheet melts away?
Not sure about the whole topography however thankfully looking at your graphic (23), the undermining may only come from one side, unless that is just a matter of section?
Not sure about the topography of the EAIS marine based glaceirs that are melting and the icesheets there, but they are being under eroded below the sea as well. And I think these basins and similair basins in Greenland are quite big, and are several kilometers deep, so the Ice replacement effect might be putting a very small brake on apparent sea level rise, but might be masking some melt.
I've not read an estimation of the amount or volume of underwater ice being melted on the marine based icesheets and glaciers, just overall icesheet and glacial loses and therefore I don't have any feel for the sieze of the effect, but it will increase as the melting accelerates?
-
Leto at 09:39 AM on 4 April 2015Understanding adjustments to temperature data
Bob @ 58,
Very good points. The common practice of reporting a single error range for an instrument doesn't help general understanding. It would be nice if it were standard practice to separate out components that are random from reading to reading (and hence average out) versus components that are systematic/consistent (and hence irrelevant to measuring changes). There is a spectrum between these types of errors (and other subtleties as explained in your post), but some convenient way of reporting both error dimensions would be nice.
My quick Java example is of course based on an unrealistic error distribution introduced artificially by rounding. In that example, an increase of 0.002 is manifested as a one fiftieth chance of a 0.1 upwards step occurring. In a real instrument, there would be a more complex error distribution.
As someone else said up above, this could be a topic for another SkS post. There does seem to be significant confusion on the issue in denierville.
Tom Curtis @ 57,
Nice pics. The example best known to me is picking up the tiny elecrical signal coming from the first phase of visual processing, and hence measuring the speed of transmission in the optic nerve non-invasively, merely by averaging out the time-locked EEG signal over the back of the head while a subject looks at a flashing checkerboard pattern. Everything evenually averages out to nothing apart from the activity that is locked to the flashing.
-
Kevin C at 09:12 AM on 4 April 2015We must defend science if we want a prosperous future
I'm also unhappy with the significance attached to deconstruction in this article. The same attitudes to knowledge are also symptomatic of a post-modern world view, and I am not convinced that the post-modern worldview has been signficantly influenced by deconstructionism - I think there are probably plenty of other drivers which may have caused it's emergence.
It is entirely possible that deconstruction itself was a response to the same drivers which led to the emergence of a post-modern worldview in non-academic circles.
-
Bob Loblaw at 08:21 AM on 4 April 2015Understanding adjustments to temperature data
Although I am not in disagreement with what has been disucssed in the last few days, there is another characteristic of temperature sensors that has been missed. Although the previously-mentioned accuracy of +/-0.1C is fairly typical of meteorological sensors, that accuracy specification does not quite mean what some seem to be assuming it means.
For example, Vaisala is a manufacturer of very commonly-used meteorological sensors, and they make a combined humidity/temperature probe (HMP155) that is in widespread use. It specifies a +/-0.1C accuracy. That value, however, is not a random error for a single reading from the instrument - it is the random error for a large number of instruments over the temperature range in question. What that means is if that you buy 100 HMP155s, they will all tell you the same temperature to within +/-0.1.
For a single sensor/instrument, however, the error is not particularly random. A specific sensor will typically be a bit high or a bit low, and will remain at a pretty constant offset from the real temperature. So, when looking at a change in temperature, you can accurately detect a very small change, even though you're not quite sure of the exact temperature itself.
Mathematically, the error in the temperature change is related to the error in each reading as follows:
deltaT + errordeltaT = (T2 + error2) - (T1 + error1)
which makes
errordeltaT = error2 -error1
If error2 and error1 are the same, there is no error in the difference. Note that the above equation applies to one specific pair of readings, not the distribution of errors for a large number of readings.
The key factor, when considering the distribution of errors (i.e., what errors are expected from a large number of pairs of readings) is the covariance between errors. If the covariance is zero (the two errors are completely independent) then we have random errors, and the whole averaging process described above will apply. When the two errors vary in lock-step, the sensor can have very poor absolute accuracy and still detect small changes accurately from a single pair of readings. WIkipedia's Propagation of Uncertainty page does a reasonable job of discussing some general principles.
Given that any normal weather station and network of stations will keep a single instrument installed at a single station for a long time, it is the error relationship for that individual that is important. Even at a single station, over a short period of time, temperature changes can be measured accurately.
-
Tom Curtis at 07:04 AM on 4 April 2015Sea Level Rise is Spiking Sharply
anthropocene @22, the impression of increased amplitude of fluctuation arises almost entirely from the reduction in sea level associated with the 2011/12 La Nina. By one measure, that is the strongest La Nina event in on record (for a record going back 130 years). It is also a single event. I would wait a few years to see whether or not it is an aberration or signals the start of greater osscillations before drawing any conclusions about the damping.
-
Tom Curtis at 06:59 AM on 4 April 2015Sea Level Rise is Spiking Sharply
ranyl @19, sorry for the delayed response.
I now get were you are coming from, and yes, the undercutting of grounded ice shelves by warm water at the base of the ice shelf will initially reduce the volume of water and hence promote a fall in sea level. That is due not only to the relative densities, but because the excess water above the undercut remains supported structurally by the grounding of the ice. When the undercut is sufficient, however, that structuraly integrity will be lost, with the result of an overall increase in sea level.
Having accepted that, however, I will point out that most ice shelves are actually floating (as with the Ross Ice Shelf as illustrated below), so that this mechanism does not apply. melt of the underside of a floating ice shelf will result in the ice riding lower on the water, with an overall slight rise in sea level. Because of that, and because the collapse of the ice shelf will progress more or less continuously with melt back even of grounded ice sheets, I do not think the mechanism you indicate will be important, and will always be outweighed by other effects.

You are correct that the reduced volume of the water once melted at the grounding line will draw in more warm water. Further, the newly melted water will be bouyant because less dense then the salt water. Consequently it will rise away from the melt point, thus drawing in more warm water. I suspect that this, by volume, is the larger effect, and is certainly the mechanism discussed in popular explanations by the experts, however, the mechanism you describe will also operate.
Finally, I do not think this will result in sudden jumps in sea level rise, primarilly because the total effect is so small.
-
Tom Curtis at 06:33 AM on 4 April 2015We must defend science if we want a prosperous future
ralbin @1, in Australia at least, deconstructionism is a pervasive feature of the academic left, and consequently highly influential on policy development if not on the thought processes of ordinary Australians. Further, the teaching of deconstructionist perspectives has penetrated deep into the pre-university curiculum. The result is pernicious in both cases. I strongly suspect the same is true in parts of Europe, particularly France. The tragedy is that straightforward evidence based reasoning strongly supports a left wing point of view. The influence of deconstructionism weakens the left wing of politics.
-
DSL at 02:31 AM on 4 April 2015We must defend science if we want a prosperous future
Say rather "deconstructionism" is a largely inconsequential technique or strategy. Unless, of course, it appears as a feature of postmodernity. Postmodernity isn't a choice, though. It's what happens when, to quote Jameson, people "attempt to think the present historically in an age that has forgotten how to think historically in the first place." History becomes a sort of commodity or means to produce exchange value or to protect the flow of capital. History is altered, taken apart, reconstructed to fit and encourage the dominant narrative of the production of capital. The more we help people understand their conditions, and help them understand their own roles in developing the historical narrative that contains but is not manipulated by the narrative of capital, the more we help create a culture capable of collectively grasping the reins of the long-term future of the species.
It seems unlikely that we'll be able to do that. Nature, that overarching narrative we think we've moved beyond, will likely lend a violent hand in encouraging the critical thinking skills of the general public, unless such violence ends up associated with various deities. We're not good at taking responsibility right now.
-
ralbin at 01:51 AM on 4 April 2015We must defend science if we want a prosperous future
A bit of false balance here. Deconstructionism is a largely inconsequential movement, though it may be different in Australia, with very little impact on this particular debate. Any problems produced by the "intellectual Left" pale by comparison with the shameless activities of conservative politicians and their enablers.
-
BojanD at 21:42 PM on 3 April 2015Ipso proves impotent at curbing the Mail's climate misinformation
ryland, I suppose they could do that. But just because they could do something else doesn't make the alternative they chose deceptive. It's not even remotely similar to what Rose did, which was deliberately deceptive.
-
Tom Curtis at 20:42 PM on 3 April 2015Understanding adjustments to temperature data
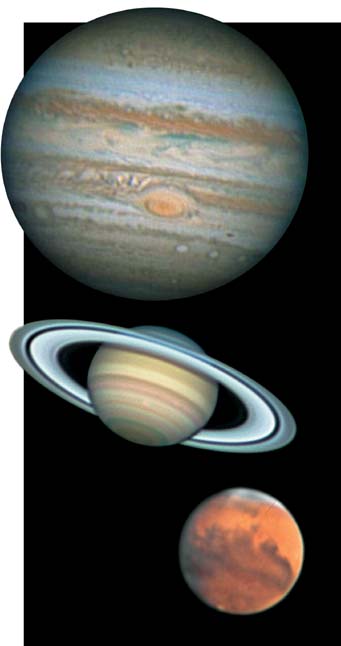
Leto @56, the most stunning use of these principles I know of actually comes from amateur astronomy. In a new technique, amateur astronomers take thousands of images of the object they are interested in. They then use computer programs to "average" the images. The result is an image far sharper than any of the individual images used, and indeed sharper than they could achieve with the same exposure time using conventional techniques. For example, these three images were taken on a 16 inch newtonian telescope:
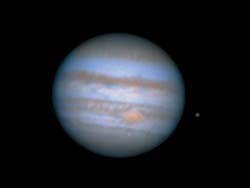
And this is one of the individual images from the "stack" used to create the Jupiter image above:
The truly amazing thing here is that not only does averaging bring out a far higher resolution image, but without the introduction of noise by the atmosphere, all the images in the stack would be identical, and no image improvement would be possible. So, in this case not only does averaging eliminate noise, and allow a far higher resolution than is possible by the original instruments, but the noise is in fact necessary for the process.
-
Leto at 19:08 PM on 3 April 2015Understanding adjustments to temperature data
Quick,
As a demonstration of what Tom Curtis and Tom Dayton have been sayng, I wrote a quick Java program. It produces 5000 random values between 0 and 20, computes the average and then "warms" them by adding 0.002 to each value and recomputing the average. Not surprisingly, the new average is close to 0.002 above the old one (some errors creep in because of Java inaccuracies - these could be fixed with a more sophisticated approach.)
When the initial and adjusted values are accessed through surrogate values that have been rounded to the nearest 0.1, the difference between the averages is still very close to 0.002 - even though most of the rounded values are the same before and after the warming, just enough are increased that, on average, the 0.002 warming can be recovered.
Typical output:
Test of ability to measure difference of 0.002 with 5000 instruments rounded to nearest 0.1
Start with 5000 random values in range 0 to 20
Sample:
Baseline Warmed
17.555315017700195 17.557315017700194
6.136661529541016 6.138661529541015
12.851906776428223 12.853906776428223
18.39383888244629 18.395838882446288
3.099104166030884 3.1011041660308836
5.749928951263428 5.7519289512634275
18.21527862548828 18.21727862548828
2.304227352142334 2.3062273521423338
5.495196342468262 5.4971963424682615
7.890586853027344 7.8925868530273435
Average of initial values 10.034636362266541
... add 0.002 to each value
Average of new values 10.036636362266911
True difference 0.00200000000037015Now round initial and final data sets to nearest 0.1...
Sample:
Baseline Warmed
17.6 17.6
6.1 6.1
12.9 12.9
18.4 18.4
3.1 3.1
5.7 5.8 *
18.2 18.2
2.3 2.3
5.5 5.5
7.9 7.9
Average of rounded values 10.034260000000016
Average of rounded new values 10.036380000000015
Measured difference derived solely from rounded values 0.0021199999999996777
Output is different every time, but the general principle holds.Code below:
/////////////////////////////////////////////////
import java.util.Random;
public class Average {
static double[] values ;
static double[] newValues ;
private static final int NUMVALUES = 5000 ;
static Random random = new Random();
public static void main(String[] args){
System.out.println("Test of ability to measure difference of 0.002 with " + NUMVALUES + " instruments rounded to nearest 0.1\n") ;
System.out.println("Start with 5000 random values in range 0 to 20" );
values = new double[NUMVALUES] ;
newValues = new double[NUMVALUES] ;
for(int n=0; n<NUMVALUES; n++){
values[n] = random.nextFloat()*20;
newValues[n]=values[n]+ 0.002d ;
}
double average = Average(values) ;
double newAverage = Average(newValues) ;
double[] roundedValues = Rounded(values) ;
double[] roundedNewValues = Rounded(newValues) ;
double measuredAverage = Average(roundedValues) ;
double newMeasuredAverage = Average(roundedNewValues) ;
System.out.println(" Sample:\nBaseline\t\tWarmed" );for(int n=0; n<10; n++) {
System.out.println(" " + values[n] + "\t " + newValues[n] );
}
System.out.println(" Average of initial values " + average);
System.out.println(" ... add 0.002 to each value ");
System.out.println(" Average of new values " + newAverage);
System.out.println(" True difference " + (newAverage-average)) ;
System.out.println();
System.out.println("Now round initial and final data sets to nearest 0.1..." );
System.out.println(" Sample:\nBaseline\tWarmed" );
for(int n=0; n<10; n++) {
System.out.print(" " + roundedValues[n] + "\t\t" + roundedNewValues[n] );
if(roundedValues[n]!=roundedNewValues[n])
System.out.print(" *");
System.out.println();
}
System.out.println(" Average of rounded values " + measuredAverage);
System.out.println(" Average of rounded new values " + newMeasuredAverage);
System.out.println(" Measured difference derived solely from rounded values " + (newMeasuredAverage-measuredAverage)) ;
}private static double Average(double[] vals){
int len = vals.length ;
double sum = 0 ;
for(int n=0; n<len; n++){
sum+=vals[n];
}
return sum/len ;
}
private static double[] Rounded(double[] vals){
int len = vals.length ;
double[] rounded = new double[len] ;
for(int n=0; n<len; n++){
rounded[n] = (int)(vals[n]*10 + 0.5f);
rounded[n]/=10f ;
}
return rounded ;
}
}/////////////////////////////////////////////////
-
Tom Curtis at 18:45 PM on 3 April 2015Understanding adjustments to temperature data
scaddenp @54, the ERSST v3 introduced the use of satellite data, but in v3b, they ceased using satellite data as it introduced an identified spurious cold trend due to difficulties in determining clear sky conditions. I do not have access to the full paper of Huang et al (2014) so I don't know if v4 reintroduced satellite data again. I note, however, that satellites are mentioned only twice in the abstract, once with reference to an institutional affiliation, and once with reference to a cross product comparison. That suggests that they have not.
As a side note, Liu et al (2014) is the estimate of uncertainty for ERSST v4 - further ammunition for Quick if he still needs it ;)
-
scaddenp at 17:59 PM on 3 April 2015Understanding adjustments to temperature data
Tom, my reading of the metadata for ersst is that they use satellite data from 1985, since v3 as well as icoads and Huang v4 change method but not input.
-
Tom Curtis at 09:42 AM on 3 April 2015Understanding adjustments to temperature data
Glenn Tamblyn @52, until recently GISS used surface observation based data for SST except for the last few years in which they used satellite based data. They now use NOAA ERSST which in turn is based on ICOADS, a dataset of surface based observations. The HadCRUT4 index uses the HadSST3 dataset for SST, which is in turn also based on ICOADS. The NCDC (NOAA) uses the ERSST. BEST (Berkeley) uses HadSST3. UAH and RSS use satellite observations exclusively, but observer the atmosphere rather than the surface, and hence do not have observations of SST directly. Consequently I am unaware of any commonly used temperature series that currently uses satellite observations of SST.
-
Glenn Tamblyn at 09:08 AM on 3 April 2015Understanding adjustments to temperature data
Quick
And another point to remember for future reference. 70% of the world is oceans and the major temperature series are land and ocean combined data. Land surface air temperatures and ocean sea surface temperatures. Much of the recent peak was due to warmer SST's, particulaly in the north pacific.
And SST's are measured by satellites, not RTD's.
-
anthropocene at 08:58 AM on 3 April 2015Sea Level Rise is Spiking Sharply
It seems that the comments and the original article are missing the most striking aspect of the graph. The graph looks like a heavily damped system with a relatively weak forcing acting on it. However in the last few years the impact of the forcing has had a much bigger effect causing bigger fluctuations in the SLR. Classically this could be because of two things: the damping has decreased or the forcing has increased. Since I assume the damping comes mainly from the sheer size of the oceans which hasn't changed the change in behaviour must be caused by an increase in the forcing. The article implies that El Nino/La Nina has a large role to play but the current fluctuation is much bigger than that of the 'super' El Nino of 1998. So is what is currently going on bigger than 1998 or is another factor adding to the forcing? e.g. El Nino conditions cause more ice melt?
-
John Hartz at 07:52 AM on 3 April 2015Global warming and drought are turning the Golden State brown
Recommended supplemental reading:
California Tuolumne snowpack 40 percent of worst year by By Alan Buis,
Jet Propulsion Laboratory, NASA Global Climate Change News, Apr 2, 2015 -
Quick at 06:10 AM on 3 April 2015Understanding adjustments to temperature data
Tom Dayton. Great explanation! Thanks again. "Stefan_Z" has gone off the grid since I slapped him with some of this info that you and Tom C. provided.
My mission continues: "Saving the world from willfull ignorance, even if it's only one denier at a time."
Prev 593 594 595 596 597 598 599 600 601 602 603 604 605 606 607 608 Next


