


 Arguments


Recent Comments
Prev 616 617 618 619 620 621 622 623 624 625 626 627 628 629 630 631 Next
Comments 31151 to 31200:
-
FrancisMcN at 18:54 PM on 10 February 2015Kevin Cowtan Debunks Christopher Booker's Temperature Conspiracy Theory
Getting back to original aim of this blog entry, Christopher Booker has come back to the issue of data management (Adjusting climate data is the biggest science scandal ever http://www.telegraph.co.uk/news/earth/environment/globalwarming/11395516/The-fiddling-with-temperature-data-is-the-biggest-science-scandal-ever.html ) and further suggestions by Homewood of incorrect adjustment, this time in the Arctic. Is there a clear rebuttal of Booker's latest claims available?
-
Kevin C at 18:02 PM on 10 February 2015Kevin Cowtan Debunks Christopher Booker's Temperature Conspiracy Theory
Tom: In the green box under the temperature tool there is a link to the blog post, which technically answers your question but only if you make a number of correct inferences about what is going on. So I'll try and provide a direct answer.
Land and ocean map series are reconstructed separately, and then combined. That's what all the major record providers do, because it's the right thing to do. While this is clear from even rudimentary analysis, I'm not aware of a careful treatment of the question in the literature however. It's on my to do list, but I've been a bit sidetracked recently.
As a result, if you provide only land or only ocean data, you get a pure land or ocean temperature series.
There is one subtlety however - the fill butttons. In grid box (i.e. CRU) mode, turning these off means that coastal cells get downweighted accoding to the amount or land (or ocean for an SST reconstruction) in that cell, which is the right thing to do. If you turn them on, then coastal cells count at full weight when using just land or just ocean, which overweights the coastal cells.
Off the top of my head I can't tell you for sure which the Hadley SST series do, but I think it is the latter. So the safest course is to calculate both adjusted and unadjusted series with your preferred option.
When doing a land-ocean reconstruction, the fill buttons play less of a role, because a cell with both land and ocea data is always constructed from a weighted combination according to the land fraction in the cell.
The data you need are the GHCN tavg .inv and .dat files for land, and the HadSST gridded data for the oceans. Look for HadSST.3.1.1.0.median.zip and HadSST.3.1.1.0.unadjusted.zip. In each case don't forget to unzip them.
The fix to work with recent SST files doesn't seem to have made it into SkS yet, so for the short term I've made a working copy available here. This will be removed once the SkS version is fixed.
If you continue to have problems, say so and I'll do a screencast on it. As a software author it is never possible to know if your software is useable except through feedback from people trying to use it.
-
Quick at 16:00 PM on 10 February 2015CO2 lags temperature
Sorry..;link didn't work. It was in the comments of a yahoo repost of this Reuters peice: http://www.reuters.com/article/2015/02/05/us-climatechange-science-politics-idUSKBN0L92IN20150205
Moderator Response:[PS] Fixed link
-
Quick at 15:53 PM on 10 February 2015CO2 lags temperature
JH, He posted as "Jim in CA" here: http://news.yahoo.com/emotions-not-science-rule-u-climate-change-debate-184843028.html?bcmt=1423418737492-0c1201c8-469f-4767-b168-0d3f364b5729_00023b000000000000000000000000-e9d055cf-f4cc-497d-9308-4e539fc56968&bcmt_s=u#mediacommentsugc_container
Moderator Response:[JH] Thanks.
-
Quick at 15:47 PM on 10 February 2015Increasing CO2 has little to no effect
Thanks Glenn and scaddenp! It would've taken me quite awhile to dig this up on my own. I called him out on it being pseudoscience and asked for references...to no avail....shockng as that may be.
-
wili at 14:57 PM on 10 February 2015A 23-year experiment finds surprising global warming impacts already underway
Good points, ranyl. And it's always good to keep that MacDougall study in mind.
But when you say: "a fall in CO2 just by stopping emissions due to CO2 fertilizations effects seems unrealistic. "
...while I agree, it is my (mis-?)understanding that the primary draw down of atmospheric CO2 after any hypothetical total stoppage of human emissions will be continuing absorption of the gas into the oceans, as they reach equilibrium with the atmosphere.
Even this, as MacDougall et alia show in the article you cited, though, is not enough to expect immediate reductions in atm CO2 levels even under the essentially impossible scenario of total, immediate sessation of all further human emissions.
-
Tom Curtis at 14:52 PM on 10 February 2015Kevin Cowtan Debunks Christopher Booker's Temperature Conspiracy Theory
Zeke Hausfather has followed through:
It looks like he has used GHCNv3 and HadSST3 as I was going to, which has the convenience of access to data, but does not correspond directly to any of the major temperature series.
He also shows the data seperately:

But that does not show anything not shown already above (other than the extension to 1880).
Repeating Mosher again:
"So here is what you have to believe. Scientists took 70% of the world and conspired to cool it. Then they looked at the other 30% and conspired to warm it. Diabolical."
-
Tom Curtis at 13:41 PM on 10 February 2015Kevin Cowtan Debunks Christopher Booker's Temperature Conspiracy Theory
Kevin C @38, thankyou for responding. I have a few questions.
1) In the SST graph, I assume the All adjustments line represents a SST series including some land data from coastal or island stations. Is that correct? If not, what is meant by the "No land adustments" line?
2) With regard to the SkS tool, do I need to download a file of the gridded data to use it? Further, can you point me to instructions on how to use it, as it is not intuitive to me?
3) My intention, with the data, is to produce a jurry rigged global temperature series by taking 0.4 x land plus 0.6 times SST data as the time series, and plotting on a single graph the effects of land, SST and combined adjustments. I am aware that method is very crude, and my intent is to show the approximate impact only. I would greatly prefer if somebody who could to a more sophisticated job would prepare the graph using a method and dataset actually matching one of the three traditional temperature series (GISS, HadCRUT4 or NCDC). I understand Zeke Hausfather is thinking of doing something similar for BEST. Any chance you would be that "somebody"?
I think such a graph would be very usefull in persuading the persuadable about the bona fides of the people constructing the temperature records (at which point further rubbish such as Booker's latest will help isolate the unpersuadable). With that graph, Steve Mosher's recent comment will have real rhetorical teeth:
"So here is what you have to believe. Scientists took 70% of the world and conspired to cool it. Then they looked at the other 30% and conspired to warm it. Diabolical."
-
Tom Curtis at 13:27 PM on 10 February 2015Kevin Cowtan Debunks Christopher Booker's Temperature Conspiracy Theory
davidsanger @36, thankyou for the very useful, if temporary help. Using the data from Kevin's program to which you linked, I can update my results from my post @34. So, the trend for the first 21 years are (to the first three decimal places) 0.001 C/decade for the adjusted, and zero for the unadjusted data. The mean percentage increase in the adjusted data as a percentage of the unadjusted increase is 24.3%, with a Standard Deviation of 4.79%. 1900 shows a percentage change in from adjustment of 33.99%, or 2.03 standard deviations (and 39.9%) above the mean. Using 1900 as the start point, therefore does make a significant difference to the analysis, biasing the outcome towards overstating the difference adjustments make. That slight difference is one of only two changes needed in my stated analysis. The other is that with the correct* data, the 1900 start year gives the largers adjustment difference (33.99%), now coming out ahead of 1915 at 33.75%.
More interestingly, having now the full dataset I checked the percentage change in trend for various trend lengths. Like you I got 0.23 C/decade adjusted (0.214 C/decade unadjusted) for the 50 year period mentioned by Kevin in the video. That amounts to an adjusted trend that is 107.57% of unadjusted trend (a 7.57% increase). Ergo Kevin overstated rather than understated the increase for that period. I also calculated the trends from 1900 and 1950 as:
1900-2014: 0.105 C/decade adjusted, 0.077 C/decade unadjusted (36.72% increase)
1950-2014: 0.177 C/decade adjusted, 0.153 C/decade unadjusted (15.52% increase)Those trends break down to a approximately a 12.25% increase in the 1900-2014 global trend assuming (incorrectly) no adjustments in the SST data, and approximately a 5.2% increase in the global 1950-2014 trend on the same assumption.
* Subject to the assumption that the software was not broken in a way that introduced errors when I used it.
-
ranyl at 13:04 PM on 10 February 2015A 23-year experiment finds surprising global warming impacts already underway
Interesting, thanks for posting.
Makes those climate models with atmospheric carbon declines as CO2 emissions cease despite continued warming of at least 1C further, seem optimistic.
With permafrost melting, forest fires raging, record droughts drying and climate zones shifting (replacing tundra with shrubs then pins releases soil carbon as well), a fall in CO2 just by stopping emissions due to CO2 fertilizations effects seems unrealistic. Macdougall et al found CO2 increases even if all emissions stopped in 2012 unless the CS was below 3C which seems more and more unlikely as time goes by.
"Significant contribution to climate warming from the permafrost carbon feedback"
Andrew H. MacDougall*, Christopher A. Avis and Andrew J.Weaver Natture GeoScience 2012
350-400ppm = Early Pliocene we are at 460ppm CO2e.
How much is the carbon budget?
-
jja at 12:48 PM on 10 February 20152015 SkS Weekly Digest #6
Worrying about the hurt feelings of liars, charlatains and sociopaths is the least of my concerns. What concerns me is the reality that global warming induced collapse has already begun and by the time we reach even a close equilibrium to our current radiative forcing we will have completely lost the arctic sea ice and weather pattern shifts will have forced hundreds of millions of humans to migrate, and likely doomed hundreds of millions more to death by violence, hunger, thirst and plague.
Worrying about the hurt feelings of blind ideologues who care not for their own children's future is the absolute least of my worries.Moderator Response:[JH] Inflamatory verbiage is prohibited by the SkS Comments Policy.
-
Glenn Tamblyn at 11:39 AM on 10 February 2015Increasing CO2 has little to no effect
Next his reference to Wien's Displacement Law???
Wiens Law is used to calculate the location of the peak of a Planck curve. But CO2 (and any other gh gas) doesn't necessarily absorb at the peak. The each absorb at different parts of the Planck curve, and perhaps not at the peak. This just pseudo-scientific waffle to try and sound smart.
-
Glenn Tamblyn at 11:31 AM on 10 February 2015Increasing CO2 has little to no effect
Quick, following on from the previous thread
Your commenter is full of it. It is not Raman Scattering. It is molecular absorption spectroscopy. And CO2 absorbs over an absorption range not just a single frequency. Across that range there are 10's of thousands of individual absorption lines.
Point your 'expert' here http://www.spectralcalc.com/spectral_browser/db_intensity.php
SpectralCalc plots line strength data for any of the gases in the HiTran spectroscopic database. Have him select CO2, Microns rather than wavenumber and a range from say 5 to 20 microns then plot.
He can then look at the detailed tabulated data for the plot extracted from HiTran at this link: http://www.spectralcalc.com/spectral_browser/db_data.php
If he still has an issue then he needs to take it up with the Cambridge Research Laboratory at Harvard and the US Defense Dept who have been behind the acumlation of data in Hitran for many years - currently data on 43 different gases, 120 isotopologues and over 7 million individual absorption lines
And if he does question the lab they will politely hand him his ignorant head on a platter!
-
denisaf at 09:08 AM on 10 February 2015Meeting two degree climate target means 80 per cent of world's coal is unburnable, study says
Even if widespread decisions are made to reduce the use of fossil fuels as rapidly as possible by shutting down much of the existing infrastructure, the concentration level of greenhouse gases in the atmosphere and absorption in the oceans will continue to rise. Irreversible global (atmoshere and ocean) warming will continue. There is no limit in a applicable time scale.The 2 degree Celsius is only an indicative figure for discussion purposes. It would be more useful if discussions centred on what can reasonably be done to adapt to the inevitable climate change and ocean acidification.
-
scaddenp at 07:58 AM on 10 February 2015CO2 lags temperature
I have responded in a more appropriate thread here. Please do not have any further responses to Quick on this thread. Quick's issue is not about CO2 lagging temperature.
-
scaddenp at 07:55 AM on 10 February 2015Increasing CO2 has little to no effect
Replying to comment from here.
The very basics of science is comparing what your hypothesis predicts to observation.
"What they say" - is the calculated spectrum of IR with increased CO2.
The observation is what is actually measured of the CO2. See article above and graphs in comments for these comparison. I think it is simply that you person misunderstands the physics. See also "The CO2 effect is saturated" which might illuminate the basis of misunderstanding.
But in short, the observations of IR spectra, whether DLR observed at the surface or OLR observed from space, fit what is expected from theory for increased CO2.
-
DSL at 07:32 AM on 10 February 2015CO2 lags temperature
Did the guy cite any sources for his claims about absorption/emission spectra?
-
Quick at 07:26 AM on 10 February 2015CO2 lags temperature
What do you guys make of this? The guy who posted it is trying to promote himself as a rogue genius or something.
"First off they claim that CO2 is causing warming by absorbing infrared. They say it's preventing infrared that's in the infrared window range from being radiated away. But CO2 only absorbs 2 wavelengths of IR in that range. One peak at 9.4 microns and the other at 10.4 microns. Both peaks have absorption coefficients just less than 1%. Wien's displacement law shows temperatures radiating those wavelengths to be 95.25 deg F and 41.9 deg F. So it doesn't exactly involve much energy. Not only that, but one of those is BELOW mean global temperatures. Basically, they're trying to claim that a heater that only gets up to 95 deg F and radiates at 1% efficiency is warming the planet. LOL Hardly.
The next thing they claim is that CO2 "absorbs" and then "re-emits" photons of IR coming from the surface, and THAT action "traps" heat by sending some of those IR photons heading back towards the surface. What they're desperately trying to describe is something called Stokes-Raman scattering, which is a type of inelastic scattering. Unfortunately for the AGW cult, there are only 2 wavelengths that get scattered by CO2, one at 7.20 microns and another at 7.78 microns. NEITHER of which are in the infrared window range. So that process doesn't stop ANY infrared from being radiated away.
It gets even more interesting when you know how the process works. It works like this: A photon of 7.49 microns interacts with a photon that's ALREADY vibrating at the correct temperature (kinetic energy) as the photon. The photon gives up a bit of energy to the molecule which causes the molecule to now have a rovibrational component rather that just a vibrational component and the photon is scattered away at a lower energy level; now at 7.78 microns. This is called the Stokes shift.
The next photon that's at 7.49 microns that interacts with that molecule will now absorb just a bit of energy (from the new rotational component) and will be scattered away at a slightly higher energy level; now at 7.20 microns. This is called the anti-Stokes shift. The molecule will then lose some energy, will stop rotating, and will drop back down to its original vibrational mode.
The really emotional...err...I mean bizarre thing is, 7.49 microns isn't coming from the ground. The ground radiates between 8 and 14 microns. So 7.49 microns is INCOMING infrared. So the process is actually scattering some INCOMING infrared back out. The claim that it's scattering IR coming from the ground is a BIG LIE.
I also said that the molecule must ALREADY be at the temperature (kinetic energy) of the photon. The temperature needed to scatter a photon that's at 7.49 microns is 236.76 deg F. On a hot day, only about 1 in 10 million CO2 molecules would be at that precise temp. On a cold day, even less. Perhaps 1 in every 30 million CO2 molecules."
Moderator Response:[JH] Exactly where was this posted?
We want to check this out because recently we've had a spate of commenters who are attempting to disguise why they are posting denier memes on our comment threads.
-
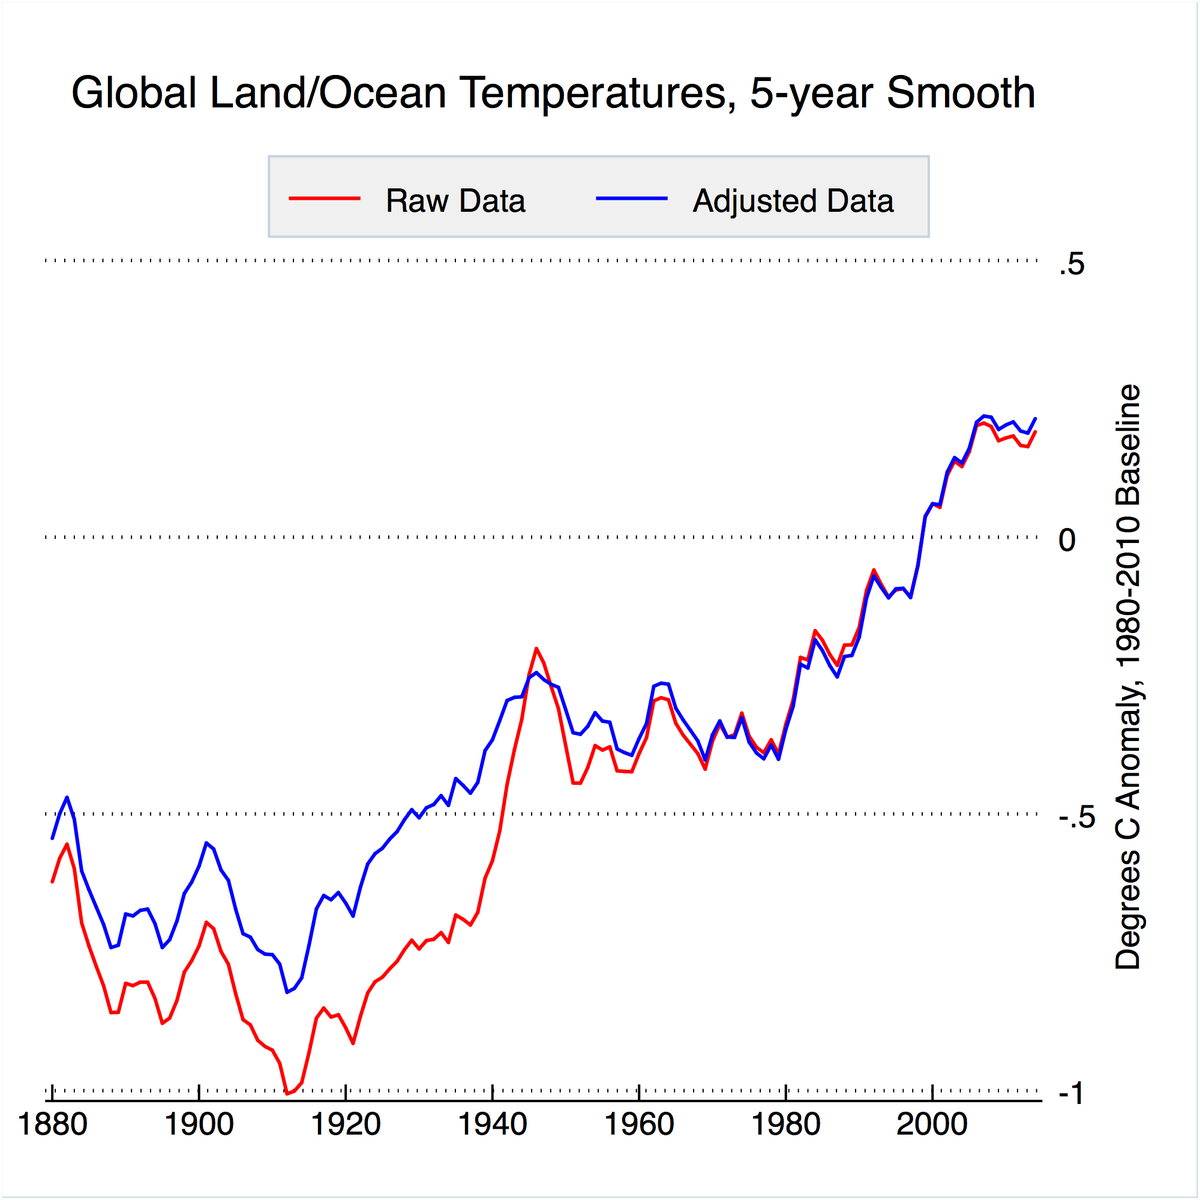
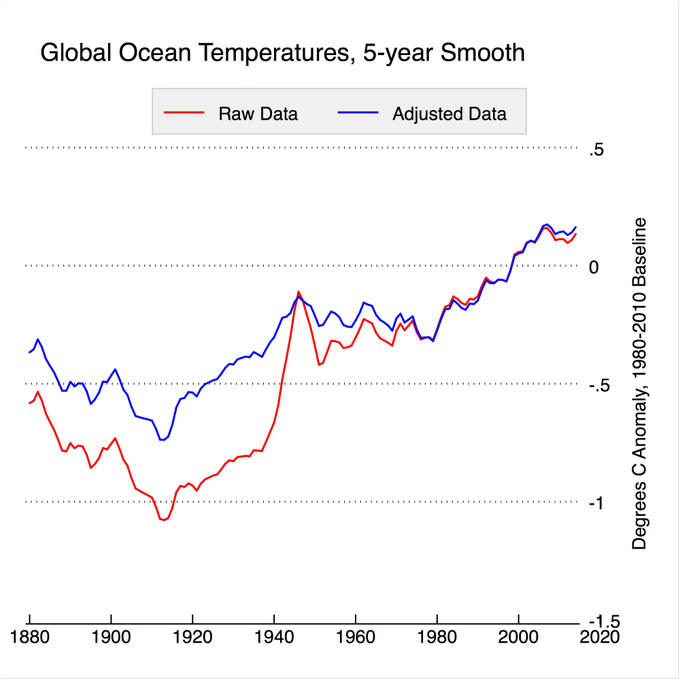
michael sweet at 07:20 AM on 10 February 2015Kevin Cowtan Debunks Christopher Booker's Temperature Conspiracy Theory
Kevin,
For your next video you might consider showing the sea temperature adjustments as a contrast to the land ones. If you say "Does it make sense to adjust the land temperature to increase the slope when you adjust the sea temeprature to lower the slope more at the same time?" I am sure you will phrase it better than me.
Sugggesting the scientists are fudging the land data does not stand up to evaluation when the sea temperature is brought into the argument.
-
scaddenp at 06:37 AM on 10 February 2015Meeting two degree climate target means 80 per cent of world's coal is unburnable, study says
I think it remarkably unlikely that you are going to persuade people to change their lifestyle etc to reduce climate change. Shifting people's political values is very hard. What most strategies are about is pricing the externalities associated with burning fossil fuel, so that non-carbon fuels are cheaper. This takes political will and yes it probably means you will pay more for your energy (which then encourages efficiency). The number one thing to do is stop burning coal. You will have to find a way to live without petroleum at some point anyway.
-
PluviAL at 03:00 AM on 10 February 2015Meeting two degree climate target means 80 per cent of world's coal is unburnable, study says
Burning European fossil fuel reserves and resources because it reduces transportation costs and because it is a large market, however, it looks suspicious and self serving. I don't think it is at all, they are the most proactive and aware, it just looks that way. Similarly, feedback loops could be greater factors at a lower temperature than expected. Look at deglaciation, IPCC forecasts went from 30 cm of SLR to 95 in a matter of a decade. The earth could be more forgiving, but it could be more angry making our efforts insignificant. We should redouble our efforts and try most avenues, not just conventional efforts. We must stay away from crazy plans, sorry I am not being pejorative, aerosols are a bit crazy for me. I realize Pluvinergy is too complex for me to communicate, but we now have a patent on the works to produce sufficient water to adjust sea level. I know that sounds crazier, but no body has a better plan, and this is amazingly simple, the one big question is if the dry land has suffecient storage, and absorption capacity. Producing the water is easy, the energy is there, is the simplest atmospheric architecture to casue mini-atmospheric rivers in tropical areas to export to subtropical zones. Initial estimates are that the land can accomodate 7.2 million km3, for 20m slr, but that has yet to be peer-considered.
Moderator Response:[PS] Please refrain from repeated pushing of pluvialenergy. This adds up to excessive repetition in violation of comments policy and is perilously close to spam.
-
Kevin C at 02:58 AM on 10 February 2015Kevin Cowtan Debunks Christopher Booker's Temperature Conspiracy Theory
David: The GHCN tool is unfinished, frequently broken, and not ready for release, I'm not sure how you got the link. I've removed it now.
It's mainly meant as a teaching tool. The rather more sophisticated SkS tool can do a better job, and can do land-ocean series.
Tom: The HadSST3 raw data are available as grids from Hadley. I can give you a temperature series if you want, or you will shortly be able calculate it in the SkS tool in CRU mode (note it at this moment it doesn't read the latest Hadley SST files, I've sent a fix which will hopefully be online later today).
Here is a comparison of the series with and without the SST adjustment. It is indeed in the opposite direction and much larger than the land adjustment:

Here are the land-only results from Lawrimore Figure 16:

I may be able to get the original data for this figure if you want it.
Table 4 is this data (via Nick, adjusted to make the units match):
Trend (°C/decade) Unadjusted Adjusted
1880–2010         0.061      0.079
1901–2010         0.070      0.091
1951–2010         0.16       0.18
1981–2010         0.27       0.27
-
One Planet Only Forever at 01:47 AM on 10 February 2015Meeting two degree climate target means 80 per cent of world's coal is unburnable, study says
sgbotsford,
The fact that many people can claim they will not be affected by the impacts of their pursuit of maximum personal comfort, convenience, wealth, and pleasure is not a justification for their preferences. That way of thinking is just a poor excuse to behave unacceptably. It is the equivalent of saying "I enjoy want I want even though I understand all others cannot equally enjoy it into the distant future and even though I understand my enjoyment creates problems others will have to deal with".
And anyone who demands that until it is cheaper and easier for them to enjoy more than they have gotten accustomed to getting away with does not need to be 'negotiated with'. Their opinion is not relevant to the determination of what needs to be done, and it is not relevant to the continuing development of the understanding of what is going on. Those type of people only deserve the choice to become more considerate, aware and better understanding of what is going on.
The development of a sustainable economy actually requires much of the perceive current wealth and prosperity to be seen as being undeserved. Excess damaging consumption and waste, particularly the damaging wasteful burning of non-renewable buried hydrocarbons has no place in the future regardless of current perceptions of popularity and profitability.
-
sgbotsford at 00:03 AM on 10 February 2015Meeting two degree climate target means 80 per cent of world's coal is unburnable, study says
I have a friend who is a denier. Calls this a 'religious' argument between the conservative capitalists (deniers) and the liberal/controlled economy (believers)
One point he makes that I think is valid for a lot of people out there:
* In much of the world there is a 10-15 C daily change.
* On top of that a 30-60 degree yearly change.
* Why all this fuss about 1-2 degrees?
Point 2:
Currently the oceans are rising at about 3 mm/year. Assume that the average sea coast area has a slope of 1% A 3 mm rise translates to about a foot. Given that any given storm can leave or take 20 feet of shore, who cares about a foot? Yes, if you live on a barrier island, you may want to sell to some denier. But a foot a year, isn't unreasonable to cope with.
Recently a graph of ocean temperatures made the rounds, but the units were 1022 J. Some calcuation showed that this is something like 0.003 C. The range on the whole graph was 0.08 C. After reading the sidebar article on measuring deep ocean temperatures, I don't find the article convincing.
You catch the drift: For most people it's an intellectual exercise. It doesn't affect them. They don't see 1 or 2 or even 5 degrees as making a real difference.
To counter this:
1. Find comparable regions where the only difference is 2 C in average temperature. Ideally it should be 2 different for each month. They should have similar rain fall patterns too. SHOW people what 2 degrees means with pictures. Do the same with 5 degrees.
2. Repeat this exercise, but use the change in regimes predicted by the current GCMs. (Most, I think predict more of the warming in winter, and more of the warming at high latitudes.
3. Grovel the climate databases, and for the N largest cities in each country, find a matching location for x degrees warmer by the two standards above.
This makes it real. It's not just a number anymore, it's pictures.
Consider: Most people won't change their diet to extend their life.
Most people will not do a retrofit on their house unless it pays back in under 3 years.
I considered installing 5 kW of grid tied PV on my roof. Would cost me about 15K to do this. In our climate it would generate about 6000 kWh/yr, worth about $480 at current prices. That's a 3% return on investment, not counting lost opportunity costs, and not including maintenance. Power has to get a lot more expensive that 8 c/kWh before I can go this route. (We are billed separately for wire charges and power here.)
***
The second thing that believers need to do is give viable alternatives. You can say the sky is falling, but tell people where to get umbrellas that will shed sky bits.
If you don't do this, then all you do is make people feel anxious for a few minutes, then, when nothing can be done, return to their rut.
Solutions have to be practical on large scales. E.g. Encouraging people to buy electric cars is only going to create a big shortage of lithium. There is not enough lithium to build all electric cars. (And there isn't an electric car out there that will let me make a round trip to Edmonton in winter.)
So: Make it real.
Give a call to action that is do-able.
Moderator Response:[JH] Excessive white space eliminated.
-
BBHY at 22:02 PM on 9 February 20152015 SkS Weekly Digest #6
"The "D" Word"
Meanwhile, those molecules of CO2 don't care the slightest bit whether people call each other names. They don't care how people feel about politics, science, scientists, taxes, liberals or Al Gore.
Those molecules of CO2 just keep on absorbing infrared heat energy. That's what they do and they are pretty good at it. The subjects that human's use to argue with each other don't mean a thing to the CO2.
-
Nick Stokes at 16:02 PM on 9 February 2015Kevin Cowtan Debunks Christopher Booker's Temperature Conspiracy Theory
Thanks, Tom@35. Victor V made the same point about SST here. I guess you are referring to Fig 2 in KevinC's post. Unfortunately, it's harder for SST to pin down (let alone find numbers for) a "raw" dataset, and so is hard to do a corresponding analysis.
Which all illustrates the silliness of the whole adjustments accusation. Adjustment is just the process of trying to a good set of data for global analysis. Relating it to where you start from just depends on whether you started from a good place or not. With both SST and MSU, say, it's really hard (and pointless) to pin down a unique starting point.
-
wili at 15:49 PM on 9 February 20152015 SkS Weekly News Roundup #6B
As a counterpoint to the '14 CEO's...' hopium, consider:
"The looming climate catastrophe."
>>The professional services group PricewaterhouseCoopers (PwC) conducts a survey in advance of the annual gathering of the ultra-rich in Davos, Switzerland--the event where the 1,500 most influential CEOs and business leaders from around the planet decide what they consider the 20 most urgent issues to address in the world. As a result of last year's survey, which registered concern for climate change at number 19, with only 10 percent of major business leaders saying it was a problem, PwC didn't bother to list it in this year's survey.
In a separate survey, only 6 percent of respondents invited to Davos said climate change should be addressed by governments.<<
socialistworker.org/2015/02/04/the-looming-climate-catastrophe
-
davidsanger at 14:40 PM on 9 February 2015Kevin Cowtan Debunks Christopher Booker's Temperature Conspiracy Theory
Tom@35 You don't need to digitize the data. It is available at Dr. Cowtan's GHCN calculator.
Just select "station" and "add all" and the either "adjusted"or "unadjusted".
For anomalies check the box "aligns stations on common baseline". It does compute each anomaly seriers independently.
For temperature leave the box unchecked. Be sure the "area weighting" box is checked.
Then press calculate and it will add the series to the display. It can only show two series at the same time, but you can easily download the data as textfiles.
I ran a simple least squares on the adjusted anomaly for the past 50 years (1965-2014) and got a trend of +0.0230 degrees a year; the unadjusted anomaly showed a trend of +0.0214 degrees a year.
No doubt as the tool is refined and more people have access others can check these and other results. -
Tom Curtis at 13:33 PM on 9 February 2015Kevin Cowtan Debunks Christopher Booker's Temperature Conspiracy Theory
Nick Stokes @33, glad to have a true expert on the topic particpate. I have my doubts about the 0.05 C figure for global values, primarilly because the SST data is also adjusted, but in the opposite direction. Therefore it does not merely dilute, but cancells the effect of the land station adjustments (in agregate). As a result, depending on the figures and the SST record used, the global adjusted figure will be less than 0.05 C, and may even be negative. Do you have any comments on that?
-
Tom Curtis at 13:28 PM on 9 February 2015Kevin Cowtan Debunks Christopher Booker's Temperature Conspiracy Theory
First, and in response to various comments, the correct way to compare the effect of adjustments, if you are gong to use the endpoint method, is to take (Tfa-Tia)-(Tfu-Tiu), whereTfa is the final tempertaure in the adjusted series, Tia is the i-th temperature in the adjusted series, and likewise in the second parenthesis for the unadjusted series. If you include terms from the adjusted and unadjusted series in the same brackets, a difference in the baseline period could be interpreted as a difference in the actual adjustments. This, I believe, is the point raised by davidsanger, and responded to by Glenn Tamblyn. However, as daveburton used the correct method, ignoring the fallacies of that using endpoints is itself an error, I do not see the relevance.
Second, in response to daveburton @28, I have now digitized the first 21 and the final values in the adjusted and unadjusted series. Applying your method of determining the difference in adjustment, using each of the first 21 years as start points and 2014 as endpoints, I obtained adjustment percentages ranging from 18.85 - 35.9%. The mean value was 25.5% with a standard deviation of 4.98%. You will notice that using 1900 as a start year gives a value 1.97 standard deviations above the mean. In fact, for the first 21 years, 1900 gives the second largest value after 1915. I trust you will concede that an increase almost two standard deviations, or 38.4% over the mean value, is sufficient to consider the 1900 value an outlier. If you do not, I see little further point in this discussion.
Interestingly, the variance in the percentage value is much greater than the variance in the adjustment itself. For the actual adjustment, 1900 shares the maximum adjustment with 1901, at 0.3 which is 1.71, but only 12.7% greater than the mean value (0.266 C). The reason for the increased variance is that by taking a percentage, you introduce the difference between the anomaly values into the term, thereby making the year to year variance in temperature a significant factor, contrary to both of our claims above.
Please note that the temperture trend is essentially zero over the first 21 years (0.0022 C/decade adjusted; -0.005 C/decade unadjusted), so while year to year variability is, the trend is not a significant factor when analyzing the adjusted percentages.
This brings me to the third point, specifically, there is a crucial difference between "arbitrary" and "cherry picked". 1900 is an arbitrary start year because the fact that it happens to be a centenial year (and hence was chosen as the first year of the data) is a fact relating to human customs, and has no physical significance. Had we used a base eight mathematical system, or had a different religous history in Europe, some other year would have been chosen. In like manner, 1880 is an arbitrary year with regard to the temperature record, being chosen as the first year of the temperature record (for NCDC and GISS) because of historical facts about when and where people started keeping temperature records. Because these years are arbitrary, we need to take great care to avoid endpoint effects which can significantly distort an analysis (as I think I have shown it has distorted yours).
That is quite different from cherry picking, in which an arbitrary endpoint is chosen because it distorts the analysis. So, while 1900 is an arbitrary start point, it is not a cherry pick (and nor have I accused you of cherry picking).
Note further that while 1950 or 50 years ago are also arbitrary endpoints, the choice of an endpoint approximately in that range is not because it is approximately at that time anthropogenic forcings began increasing at a very rapid rate (whereas before hand they had increased slowly, or not at all according to some determinations). Further, that also corresponds to a high point in the AMO so that temperatures increases since them have been decreased by the AMO if affected significantly at all, ensuring that nearly all of the increase since then has been anthropogenic. Further, in terms of understanding the science, 1950 is the year the IPCC chose as the start point of its attribution claim so that if we want to understand how much adjustments affect that claim, we need to use that as the start point. These are the various non-arbitrary reasons for using the shorter period that you have not addressed.
Finally, I intend to fully digitize both the GHCN3 and HadSST3 adjustments on a publicly available spreadsheet, as I think the results will be interesting independently of this discussion. That may, however, take a couple of weeks so I hope you will be patient waiting for the full data that verifies my claims above.
-
bjchip at 13:14 PM on 9 February 2015Claims that climate models overestimate warming are 'unfounded', study shows
May want to push that link up as an addendum to the OP.
-
bjchip at 13:13 PM on 9 February 2015Claims that climate models overestimate warming are 'unfounded', study shows
Saw it and already started using it.
Many thanks. We are all indebted to you guys for working through the hard stuff.
respectfully
BJ
-
Nick Stokes at 13:13 PM on 9 February 2015Kevin Cowtan Debunks Christopher Booker's Temperature Conspiracy Theory
The effect of adjustment on GHCN V3 trends is gicven by Lawrimore et al, 2011, Table 4. For the century, land only, it typically increases trend from about 0.7 to about 0.9 °C/Cen. Of course, for global that reduces to a difference of about 0.05, which is about what I got here.
-
Trevor_S at 12:28 PM on 9 February 20152015 SkS Weekly Digest #6
If we want our children to have a healthy future, we need climate solutions now
I always chuckle when I see these sorts of quotes. We have solutions aplenty but as long as people want to fly, refuse to buy green energy off the grid and prefer to drive, and eat plenty of meat, we'll have no implementation of effective mitigation.
-
bjchip at 12:05 PM on 9 February 2015Meeting two degree climate target means 80 per cent of world's coal is unburnable, study says
Apologies... I need to remember the bold or underline rather than "all caps" rule. Alas, I learned to do this before there was bold as an option so the habit runs deep. :-)
-
bjchip at 12:03 PM on 9 February 2015Meeting two degree climate target means 80 per cent of world's coal is unburnable, study says
Although the current situation appears dire, I do anticipate within the next 15 years, what I think of as "2x4 events" which take the attention of the general public far more forcefully than any scientific result or rhetoric I can muster. Things that tell ordinary people that there is a real problem and, by the way, who is actually lying to them.
Those events will trigger a rise of "Green" principles in politics and "Green" parties to power... but not perhaps the same folks as we know them now, because the focus on CO2 will be sharper, and there are a lot of people even now who recognize the need to build new nuclear power as well as all the renewables we can muster ( Unless we get good, cheap energy storage systems we are going to need nuclear and almost everyone will know that we do ).
...and that will start to happen.
So BAU cannot continue as long as we might fear, even though it WILL continue far longer than we wish. A lot of coal will stay in the ground. Not as much as we wish. IMHO we're on for 3 degrees as it stands with a possible 4, but action will start to be taken.
-
davidsanger at 11:59 AM on 9 February 2015Kevin Cowtan Debunks Christopher Booker's Temperature Conspiracy Theory
I understand that the anomalies are based on the temperature record for a specific station, Glenn@30 , but my point, as @scaddep@31 noted, was that if you look at unadjusted anomalies then you need to recalculate the baseline using unadjusted temperatures.
Looking at Dr. Cowtan's source data it is indeed evident that is what he has done. -
Tom Curtis at 09:19 AM on 9 February 20152015 SkS Weekly News Roundup #6B
amhartley @5, what proportion those 43,000 people are paying extra to have the carbon emissions from their flight offset? It seems to me that without that information, any accusations of inconsistency are making large assumptions - that the attendees are being condemned not because of what they have done but because of what the deniers want them to have done. Certainly they have form in that regard, having made similar complaints about attendance of the AGU, while totally ignoring the stunning "green" credentials of the Moscone center where the AGU was held.
-
amhartley at 07:13 AM on 9 February 20152015 SkS Weekly News Roundup #6B
Glad to see talk of optimism for the Paris talks. I do wonder, though, why, acc to Tom Miles (Reuters) today, 20,000 delegates, that many guests, & 3,000 journalists need to attend.
A question I often see from climate science deniers is, if the climate scientists & the pols who believe their message really subscribe to the idea that climate change is real & will hurt many people, then, they would curb their own carbon footprints.
When I see that 43,000 people will attend the meetings in Paris, flying in from far-flung locales, I am forced to wonder the same thing. Split over 195 countries, that's 220 attendees per country (on average). Are all these people truly needed & helpful?
Moderator Response:[JH] Would the flights to and from Paris occur if there was no meeting in Paris?
-
scaddenp at 06:09 AM on 9 February 2015Kevin Cowtan Debunks Christopher Booker's Temperature Conspiracy Theory
Glenn, I think the question remains whether the anomaly for the station is calculated against the adjusted or unadjusted mean for that that station. Adjustment will surely change that mean value.
-
John Hartz at 05:14 AM on 9 February 2015Claims that climate models overestimate warming are 'unfounded', study shows
bjchip:
As Rob Painting has pointed out in a Moderator's Comment to #19 frenchie, Jochem Marotske & Piers Forseter have publicly responded to Nic Lewis's critque of Marotzke & Forster (2015). Their response is in the form of a guest post on the Ed Hawkins' blog, Climate Lab Book.
-
wili at 04:23 AM on 9 February 2015Claims that climate models overestimate warming are 'unfounded', study shows
Thanks for that, MA. But am I reading your chart and statement right? At a given temperature increase, does water expand more under conditions of higher pressure than under conditions of lower pressure??
That seems rather...counterintuitive! Am I missing or misinterpeting something?
-
Quick at 02:24 AM on 9 February 2015CO2 lags temperature
@Rob, Glen, Philippe, and Tom.
Thank you, gentlemen! My physics is a bit rusty, so at cursory glance this paper seemed to have some meat, but alas, my instincts prove correct. I knew some of you would have the proper resources readily available. Time to go educate 2 persistent skeptics. Thanks again!
-
Glenn Tamblyn at 21:53 PM on 8 February 2015Kevin Cowtan Debunks Christopher Booker's Temperature Conspiracy Theory
davidsanger
"If one is going to compare adjusted temperature anomalies to unadjusted temperature anomalies, ought not the unadjsuted temperature anomalies be calculated relative to the unadjusted mean temperature? Otherwise you are calculating an anomaly by comparing an unadjusted temperature to an adjusted mean.
Or am I missing something?"
Yep.
Anomalies aren't calculated relative to a mean, at least not a global mean. For each station the anomaly for any reading from that station is calculated relative to a baseline average for that station. Then these anomalies are averaged (with an area weighting) to give the global mean.
Averaging stations to get a mean then calculating anomalies as differences in the mean is highly vulnerable to issues with station availability. local station biases etc. By basing the analysis on comparisons of a station against it's own base line, many local biases cancel out. You get a more robust result.
-
MA Rodger at 20:33 PM on 8 February 2015Kevin Cowtan Debunks Christopher Booker's Temperature Conspiracy Theory
daveburton @28.
I'm so sorry. I didn't realise we were playing troll rules. Forgive me while I chase any potential strawman from the scene.
You do not accuse NOAA of error, directly. You do say you are not sure if NOAA are correct or in error. So to be pedantic, you either accuse them of potentially being in error or you have no knowledge in the matter. Yet evidently you do consider the NOAA adjustment of raw temperature data to be an issue, something people are apparently "tryng to defend." This brings much emphasis to the likelihood of you knowing what you are about and also that you strongly countenance an NOAA error to exist. You may hide behind a figleaf of remaining doubt assumed by you for sake of argumentation, but your position is evident. Your position accuses NOAA of error.
You do say you see evidence to support suspicions of wrong doing, of the NOAA being "up to no good" and, as you link to such a comment from here, the location is of no consequence.
I stand by every syllable of my quote that you present @28.
As to your "point," I am not sure what you are about.
The alleged "misconception that NOAA's adjustments made a negligible difference," is surely unfounded. Kevin Cowtan is quoted by me @27 and it is plain to all but you that any "negligable difference" being ascribed to these NOAA adjustements applies to "the last 50 years." Why then do you persist with this "misconception" nonsense by arguing that the "difference" over the last 115 years is not "negligible"? Is this because you want to conflate a non-negligible adjustment with your accusations of error and wrong-doing?
Moderator Response:To better understand what David Burton is attemtping to accomplish on this comment thread, go to: http://www.sealevel.info/Cowtan_unintentionally_vindicates_Booker.html
-
daveburton at 14:39 PM on 8 February 2015Kevin Cowtan Debunks Christopher Booker's Temperature Conspiracy Theory
RH/moderator, thank you for fixing it, and please accept my apology; I'll trim/shrink to 500px in the future.
davidsanger, I'm sorry, I don't understand your question.
Tom Curtis, I don't think it is reasonable for you to characterize starting at the beginning and ending at the end as "arbitrary." I do agree that it would be better to do a regression fit, rather than just using the endpoints, but to do that properly that would require all 228 data points, and digitizing just 48 of them was tedious enough.
If you want to digitize the rest, please do so. You can start where I left off; I've posted a link to all the relevant files.
When you're done, I don't think you should use a linear fit, though. It looks curved to me. I think a quadratic fit would better capture the trend.
To me it looks like the endpoints on the "adjustments" graph are roughly on what would be the quadratic-fit curve. So I think if you do all that work you'll get about the same result. (I've written some Perl code for doing quadratic fits, though; I'd be happy to share it, if you want it.)
The unadjusted temperature curve (for the denominator when calculating the percentage by which adjustments increased reporting) is more complex. It has about three inflection points (around 1925, 1955 & 1995), so a 5th degree polynomial would be needed to fit it, or a spline.
Tom, you also say, "My other points remain unaddressed." I guess you're talking about your argument that it is reasonable to discuss only the warming added by adjustments made to temperature measurements taken during the last 50 years, rather than the full 114. But I thought I did rebut that adequately, when I showed that that was the period for which the adjustments contributed the smallest percentage of warming.
For the ten 70-year periods, the amount by which the adjustments increased the global land surface temperature warming varied from 18.9% to over 700%, and for the full 114 years it was 35%.
Remember the question being addressed in this discussion: was Dr. Cowtan right or wrong when he argued that suspicion about NOAA's adjustments could be dismissed because they resulted in an inconsequential difference in the result? So why, then, if you want to answer that question, would you examine only the period for which those adjustments made the least difference?
That's like a student arguing that, because he only got 7.5% wrong on one of his quizes, he should get an "A" in the course, even though on most of the quizes he got over 30% wrong.
MA Rodger, I agree with your first three sentences. But then you rebutted an "accusation" that you think I made: an "accusation that the adjustments are poorly founded (with heavy hints of conspiracy wafting about to boot)."
Where do you think I made that accusation? Please quote it.When you rebut something that someone hasn't actually said, it's called a "strawman." As I said to Tom Curtis @20, "My point wasn't about motives. I was simply addressing the misconception that NOAA's adjustments made a negligible difference in the reported result. They don't. They make a big difference."
I acknowledge that I have complained (mostly elsewhere) rather bitterly about the habit of the currators of the temperature data at NASA & NOAA of blocking the archiving of data and documents, by various means. I think that's suspicious-looking. But, in truth, I don't know whether the adjustments are right or wrong, and that wasn't my point. My point was simply that the adjustments are far from negligible, so trying to defend them on grounds of supposed negligibility doesn't work.
Moderator Response:[JH] You are now skating on the thin ice of excessive repetition which is prohibited by the SkS Comments Policy.
-
Chris G at 14:12 PM on 8 February 2015The Most Terrifying Papers I Read Last Year
JJA,
I don't really separate the two. I think that, historically, whenever people have a choice between starving and raiding, they raid every time. I don't know if you would consider the unrest in the Middle East as raiding, but it certainly is violence between groups of people.
In my mind, there is a connection between the Russian heat wave of 2010, their failed harvest, their ban on wheat exports, the rising food prices in the Middle East (where the Russians sell most of their wheat), and the food price riots/unrest in Tunisia where the "Arab Spring" started. Others will think it is a thin thread.
I've also had an opportunity to speak with agricultural biologists from Syria; they are experiencing a dramatic decline in rain, making it difficult to get good yields. I suspect the unrest/violence in the region is causally related to declining ability to feed the population. Unfortunately, violence in the region multiplies the problem of trying to grow food.
Here is something from the World Food Programme along these lines.
Basically, the way I see it, heat waves and changes in precipitation patterns will make it more difficult to grow food. Food prices increase. Food is not something that you can go without; so, areas where food costs rise see declines in standards of living. Enough of a decline leads to civil unrest, civil unrest exacerbates the food security problem, and you get what biologists might call an overcorrection in population density.
Glenn,
This will not happen everywhere at once. Areas where food cost is a small fraction of income will be stable far longer than areas where food costs are a large portion of income. Personally, I think we are already seeing the start of the trouble with rising population and crop yield instability.
-
Mal Adapted at 13:07 PM on 8 February 2015Claims that climate models overestimate warming are 'unfounded', study shows
There is no 'deep sea pressure' mechanism that limits thermal expansion due to temperature rises I am aware of; I'd have to look up in a CRC handbook or something to see if there is any substantial variation in the coefficient of thermal expansion for water vs. pressure which might imply 'deep water' warming would have a lower or higher rate of expansion with heating
It appears that the thermal expansion coefficient of seawater does vary with depth.
Also, according to the IPCC:
Water at higher temperature or under greater pressure (i.e., at greater depth) expands more for a given heat input, so the global average expansion is affected by the distribution of heat within the ocean.
-
frenchie at 12:16 PM on 8 February 2015Claims that climate models overestimate warming are 'unfounded', study shows
agh, no, I'm wrong.
-
Tom Curtis at 11:59 AM on 8 February 20152015 SkS Weekly News Roundup #6B
Glenn @3, first, that is a good point about the Renewable Energy Target, so if there is a spill, and if Turnbull becomes PM, that is one climate positive. I remain dubious on both of the conditionals, however. While there is no doubt Turnbull is the most electable, and probably the most competent alternative Liberal Party PM, the fact is the National Party (the Liberal Parties coallition partner, for non-Australians) are making very strong noises to the effect that they would rather split the coallition than have Turnbull as PM. That, IMO, would be enough to spook the Liberals against Turnbull, many of whom have been saying quite recently that they would not have Turnbull as PM under any circumstances. In effect, the coallition of factions within the Liberal Party that Abbott put together to roll Turnbull in the first place is still strong enough to keep Turnbull out, especially with the threat of a split coallition to sway the undecides.
Prev 616 617 618 619 620 621 622 623 624 625 626 627 628 629 630 631 Next


