Climate Science Glossary

Term Lookup

Enter a term in the search box to find its definition.

Settings

Use the controls in the far right panel to increase or decrease the number of terms automatically displayed (or to completely turn that feature off).

Term Lookup

Settings


All IPCC definitions taken from Climate Change 2007: The Physical Science Basis. Working Group I Contribution to the Fourth Assessment Report of the Intergovernmental Panel on Climate Change, Annex I, Glossary, pp. 941-954. Cambridge University Press.

Home Arguments Software Resources Comments The Consensus Project Translations About Support

Twitter Facebook YouTube Mastodon MeWe

RSS Posts RSS Comments Email Subscribe


Climate's changed before
It's the sun
It's not bad
There is no consensus
It's cooling
Models are unreliable
Temp record is unreliable
Animals and plants can adapt
It hasn't warmed since 1998
Antarctica is gaining ice
View All Arguments...


Username
Password
New? Register here
Forgot your password?

Latest Posts

Archives

Comparing past climate change to recent global warming

What the science says...

Statistical analysis of the rate of warming over different periods find that warming from 1970 to 2001 is greater than the warming from both 1860 to 1880 and 1910 to 1940.

Climate Myth...

It warmed just as fast in 1860-1880 and 1910-1940

“In fact, the rate of warming from 1975-2001, at 0.16 °C per decade, was the fastest rate to be sustained for more than a decade in the 160-year record, but exactly the same rate occurred from 1860-1880 and again from 1910-1940, when we could not possibly have had anything to do with it.” (Christopher Monckton)

Let’s have a look at some warming rates of the periods of interest from several different temperature records:


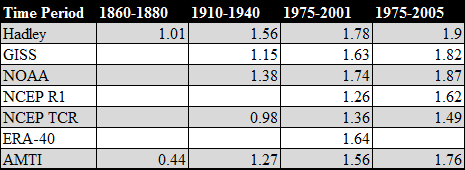
Table 1: Rate of warming for given indices in °C/century.

First we can conclude that Monckton's statement that 1975-2001 was the fastest warming rate for longer than a decade is absolutely wrong as a much higher rate is demonstrated for 1975-2005 in row 5. Secondly, to compare the three periods in Table 2, the only index which covers that period is Hadley, making his 1.6°C per century number wrong for 1975-2001 as it is actually much higher at 1.78°C per century.


Based upon the evidence presented here, he cannot support his statement that 1860-1880 had a similar warming rate as it was demonstratively lower than the 1975-2001 warming rate and nearly half the 1975-2005 rate. Finally, regarding the 1910 to 1940 warm period, evidence presented here suggests that only 1 out of the 4 major indices indicates a rate of warming within 0.25°C per century and none within 0.2°C. His claim that the rates are similar is dubious at best.

Last updated on 31 January 2011 by robert way.

Printable Version  |  Offline PDF Version  |  Link to this page

Argument Feedback

Please use this form to let us know about suggested updates to this rebuttal.

Comments

1  2  3  4  5  Next

Comments 1 to 25 out of 109:

  1. While Monckton's statement is not precise, is it worth noting that between the three warming rate periods described in the graph, the largest change is between the first two? The warming rate from 1975 to 2005 is 0.34°C higher than the period 1910 to 1940. Maybe we caused that, maybe we didn't. How can we explain the much higher rate increase of 0.55°C between the first and second periods, if not caused by us? I'd expect a bigger change between the second and third rates if we'd added something to this experiment, but the biggest change comes between the period we had no influence on...or am I wrong?
  2. expect a bigger change between the second and third rates if we'd added something to this experiment Ceteris paribus. ("All other things being equal or held constant.") Solar activity was not identical so such a direct comparison is not applicable. Solar activity was decreasing during the period 1975-2005 and increasing during the period 1910-1940, except 1920-1930 (roughly rounded). Solar activity & climate: is the sun causing global warming?
  3. Sorry for my bad English, I am french. Thank you for your very good blog. In your case, without the confidence intervals for the trends, it is difficult to say if all the trends are really statistically significant different. For example, in this graph of Tamino, http://tamino.files.wordpress.com/2010/08/rates.jpg, for those trends, http://tamino.files.wordpress.com/2010/08/annual.jpg, there is not statistically significant difference between the trend 2 and 4 (so, no difference significant between the trend 1 and 3) Other example in my graphs with the GISS data for the lands only, all the differences between the trends are statistically significant : http://meteo.besse83.free.fr/imfix/signifianoterrestrendgiss.png http://meteo.besse83.free.fr/imfix/anoterrestrendgiss.png Could you give us the confidence intervals ? Thank you.
  4. This is a response to Adam carried over from the Zebras in Greenland thread. Adam... Here is a composite graph of Dr Box's work and GISS global data zeroed to the start of the GISS data. Is there no relationship between the two? No signature of AGW? None at all? I would contend that there is a clear signal when you compare the two trends. The only thing you can take from the Greenland data is that there is a much larger noise factor but you can clearly see that the overall trend for the 20th century is much greater than the global record, fully consistent with AGW theory.
  5. Rob Honeycutt, I'm not entirely sure what you are trying to show in your comment. Yes, the trend in Greenland throughout the 20th century is slightly greater than the global record, but it still doesn't change the fact that the warming that occurred from 1920-1940 was clearly equal to the 1980-2000 warming. As it clearly says on the graph for 1916-1932 the warming trend was 1.26 C/decade, but for the 1994-2010 warming it was only 0.97C/decade. I can't see how what you are saying in your comments, answers any of the points I have made. You have also not answered why the Greenland temperature variations don't show any correlation to carbon dioxide emissions.
  6. Once again I suggest that you read Chylek's paper. It explains about the two periods of warming, and why there is nothing unusual about the current one.
  7. Rob @4, You are right of course. This graph also demonstrates that the Arctic is currently warmer than it was early in the 20th century: And again, for those hard of "hearing", it is not so much where we are now, but where we are heading under BAU.
  8. Adam - "You have also not answered why the Greenland temperature variations don't show any correlation to carbon dioxide emissions." You might want to take a step back from CO2 (or a step forward?) and look at the global temperature anomalies. The Greenland data tracks the global anomalies reasonably well (mid century rise, drop until ~1970, increasing after that). The reason neither of these directly follow CO2 emissions is because CO2 is not the only driver of climate, as is discussed on that thread. The current temperature rise, in particular post-1970, cannot be accounted for without anthropogenic greenhouse warming: factors involved in earlier climate changes are insufficient or of the wrong sign to cause recent temperature rises, rises which we expect to continue for quite some time. We're headed to mid-Pliocene temperatures, where the sea level was ~25m higher due to ice melt. The concern is particularly strong since Greenland ice melt is increasing: As noted on the previous topic, there are a lot of different kinds of glaciers on Greenland, but many of them are subject to water temperatures in their melt rates, not just air temperatures. So: - You're mistaken in thinking that CO2 is the only driver of climate. - Recent warming could not have happened without AGW; other forcings don't add up. - Air temperature is not the only driver of glacial melt; rising sea temperatures (observed) are a huge influence. - Current warming is expected to continue for quite some time, based on the science and current policies. - This has nasty implications for sea level due to Greenland ice melt.
  9. Albatross, first of all that graph is based on the entire Arctic, which is not what I was referring to. I was referring to the current climate on the Greenland ice sheet. And as shown by Jason boxes graph, apart from the two anomously warm years 2003 and 2010, the current Greenland temperature is matched with the temperature it was 70 years ago. Secondly, I suggest that you read this paper 'Variable solar irradiance as a plausible agent for multidecadal variations in the Arctic-wide surface air temperature record of the past 130 years' by Willie Soon published in 'Geophysical Research Letters' (2005) Albatross Arctic temperature changes show a much better correlation with changes in the sun, than changes in CO2 concentration. Albatross, the current Arctic climate is very difficult to be explained by co2, and shows a much better link to natural forcings. Alabatross, the perfect correlation with changes in the sun, and the lack of any correlation with co2, surely support the argument that the Arctic climate is dominated by natural variability and not CO2.
  10. Adam... My objection here is that you're quoting Dr Box's work as evidence that Greenland shows no signal of AGW which is diametrically opposed to the conclusions of Dr Box himself. You keep making the same mistake that every skeptic seems to make when then look at Greenland. You keep trying to assign a global response to a local record. The point when you look at the 20th century record of Greenland is that there is an overall trend consistent with the overall global trend.
  11. KR polar regions are especially sensitive, so looking at what they're doing (specifically if there is any correlation to CO2) would indeed be very important in our understanding of climate change and the forces that drive it. KR, as for your argument that there is no correlation because 'co2 is not the only driver of climate' I will repeat my questions to you, which I asked Rob. Do you agree that the Greenland warming of 1920-1940 was equal to the 1980-2000 Greenland warming? If so, do you agree that CO2 is much higher than it was in the 1930's? If so, could you please tell me what other forcing caused the previous Greenland warming of 1920-1940? And could you also please explain why you don't think it could be that, which is causing the current Greenland warming? As for the increasing Greenland ice melt, I will state once again that evidence of warming (i.e. melting greenland ice) tells us nothing about what caused the warming in the first place.
  12. Adam - Blaming Arctic temperatures on the sun should be carried to the appropriate It's the sun thread: Soon is not known for his quality of science, and appears to have neglected the last 30 years of data in his graph. See again the CO2 is not the only driver of climate thread: by asserting that CO2 (and CO2 forcings only) don't match the temperature record, you're really pushing a Strawman argument. CO2 is part of the picture, not all of it, but it's become the dominant changing forcing causing recent warming.
  13. Adam... I believe those charts from Soon require a bit more research because they definitely don't agree with other data I'm locating...
  14. Rob Honeycutt "My objection here is that you're quoting Dr Box's work as evidence that Greenland shows no signal of AGW which is diametrically opposed to the conclusions of Dr Box himself." Once again, personal opinions have no relevance to science. Whether or not Jason Box believes in AGW is irrelevant to the fact that his papers and data show that Greenland was equally warm 60 years ago. "You keep trying to assign a global response to a local record." Rob do you believe that post 1980 Greenland warming is caused by humans? If so do you agree that if it was human caused, then there would at least be a correlation between CO2 and Greenland temperatures? Rob it is not unreasonable to look at an area's (and not the world's) climate change and see if it fits with CO2 forcing. The mainstream media has constantly cited Greenland's melting ice as evidence of AGW, yet it has provided no evidence for it. Greenland should be reacting to CO2, yet the fact that there is no correlation pretty much shows Greenland climate change is not anthropogenic.
  15. Adam - I'll repeat it again, look at the CO2 is not the only driver of climate thread for other forcings. The early century warming appears to have been due to high TSI and a decided lack of volcanic activity. The 1950-1970 cooling ties into sulfur aerosols, which decreased rapidly after the Clean Air act and other (international) attention to that pollution problem. Currently the insolation is dropping, we have a fair number of active volcanoes, and we're warming anyway - due to greenhouse gases, much higher CO2. The natural forcings that caused the early century warming are not currently active. Which is fortunate; if they were we would be warming at twice the current rate.
  16. Definitely something fishy with Soon's chart on TSI. I'm finding numerous sources for TSI and none of them agree with Soon's representation.
  17. KR, "Soon is not known for his quality of science, and appears to have neglected the last 30 years of data in his graph. " If you had actually looked at the graph presented in Soon's paper you would see that he clearly includes the last 20 years. His data goes all the way up to 2005. I am not pushing a strawman argument. If there is no correlation, that shows that there is no significant causation. But the strong correlation between Arctic temps and the sun shows that the sun is most likely the Arctic's dominant driver and not CO2. And Rob Honeycutt just so you know Willie Soon has written a much more detailed paper on the link between the sun and the climate, which carries on from his 2005 paper. 'Solar Arctic-Mediated Climate Variation on Multidecadal to Centennial Timescales: Empirical Evidence, Mechanistic Explanation, and Testable Consequences' by Willie Soon published in 'Physical Geography' (2009)
  18. Rob#13: "they definitely don't agree with other data I'm locating..." Kelly O'Day shows another TSI/temp comparison that is vastly different from Soon's. Adam#14: "it is not unreasonable to look at an area's (and not the world's) climate change and see if it fits with CO2 forcing." Some would consider that a cherry-picking approach. "Greenland should be reacting to CO2, yet the fact that there is no correlation" You keep repeating that despite the correlation shown by Rob#4. Skeptics are known for their criticism of temperature records. If you look at the light blue line in the graph in #4, there are two years in the mid 1920's with extremely large upwards jumps. You've suggested filtering out 2003 and 2010 as anomalous: Why haven't those 1920's anomalies caught your attention? Or is it more convenient to be skeptical of things you want to disagree with than things that appear to support your position?
  19. Adam, Citing the much discredited Soon (that is but one of many examples) is not helping your case-- also, correlation is not causation. It seems that you have been gleaning papers from the "Prudent path" document which support your beliefs without being skeptical of their validity or credibility. As KE has noted, "Recent warming could not have happened without AGW; other forcings don't add up. " And you continue to misrepresent Dr. Box. I'm sorry, but several people now have very patiently explained the errs of your ways to you, yet you are not listening. You may not realize it, but by choosing to go down this road, you are essentially trolling, and not convincing anyone who has an understanding of these matters.
  20. KR oceanic oscilations play a major role in Arctic climate. They most likely brought in warmer waters, which caused the previous Greenland warming and are most likely what caused the most recent Greenland warming. KR natural factors are indeed still present and can explain observed climate changes.
  21. Adam... "Rob it is not unreasonable to look at an area's (and not the world's) climate change and see if it fits with CO2 forcing." It is not unreasonable to look at an area to see if it is consistent with CO2 forced warming. But it is not reasonable to locate what you believe to be an inconsistency and dismiss all other information because of it. The appropriate scientific response would be to question why there is an inconsistency or even if your perception of the inconsistency is even accurate. That's how scientists get research money. "I found an area of science where we currently lack an understanding of the data or response being measured. Please give me money so we can better understand why this is the case." You have gone the other direction and decided because you think there is no correlation that the entire theory of AGW is wrong in spite of the overwhelming other evidence to the contrary. So, you are left with no theory, no explanation, nothing other than your desire for AGW to be wrong.
  22. "You've suggested filtering out 2003 and 2010 as anomalous: Why haven't those 1920's anomalies caught your attention? Or is it more convenient to be skeptical of things you want to disagree with than things that appear to support your position? " Muoncounter, the 2003 and 2010 spikes were just one year events, which quickly went back to normal straight after. Could you please explain how it could have been anthropogenic co2, which caused those two spikes, and why it went straight back down. The temperature in Greenland for 1920-1940 didn't have many outlier temp anomalies, it stayed at roughly the same trend over those few decades.
  23. Albatross, blog posts are not published and do not warrant a reply. Of course many pro-AGW websites are going to attack him and say that he is wrong. Only published criticism counts.
  24. Rob et al., There is something horribly wrong with those TSI data in Soon's figure, especially after 1960, where he has increasing TSI and all the reputable data that I am familiar with shows a slow decrease in TSI since the sixties. Note too that in the Soon paper, the TSI the are inferred/estimated....... I really have no idea how the reviewers' missed that glaring problem.
  25. Looking at Soon's paper he relies on Hoyt and Schatten [1993] (and update from D. Hoyt, 2005) for his TSI data. I find this data heavily referenced on all the standard denier websites.

1  2  3  4  5  Next

Post a Comment

Political, off-topic or ad hominem comments will be deleted. Comments Policy...

You need to be logged in to post a comment. Login via the left margin or if you're new, register here.

Link to this page


The Consensus Project Website

THE ESCALATOR

(free to republish)


© Copyright 2024 John Cook
Home | Translations | About Us | Privacy | Contact Us