


 Arguments


A grand solar minimum would barely make a dent in human-caused global warming
Posted on 14 August 2013 by dana1981
The Maunder Minimum was a period of very low solar activity between 1645 and 1715, and the Dalton Minimum was a period of low (but not as low as the Maunder Minimum) solar activity between 1790 and 1830. Solar research suggests that we may have a similar period of low solar activity sometime this century.

400 years of sunspot observations data, via Wikipedia
Recent articles in the Danish newspaper Jyllands-Posten (translation available here) and in the Irish Times both ran headlines claiming that another grand solar minimum could potentially trigger an "ice age" or "mini ice age" this century. These articles actually refer to the Little Ice Age (LIA) – a period about 500 to 150 years ago when global surface temperatures were about 1°C colder than they are today.
Thus a grand solar minimum would have to cause about 1°C cooling, plus it would have to offset the continued human-caused global warming between 1 and 5°C by 2100, depending on how our greenhouse gas emissions change over the next century. Though in the Jyllands-Posten article, Henrik Svensmark (the main proponent of the galactic cosmic ray-climate hypothesis) was a bit more measured, suggesting,
"I can imagine that it will become 0.2°C colder. I would be surprised if it became 1–2°C"
So these two articles are suggesting that a grand solar minimum could have a cooling effect of about 1 to 6°C, depending on how human greenhouse gas emissions change over the next century. Is it plausible that a grand solar minimum could make that happen?
The short answer is, 'No.'
Fortunately, Solar Output is Stable
We're fortunate that the amount of solar radiation reaching the Earth's surface is very stable. Climate contrarians will often ask if we'd prefer if the planet were warming or cooling, suggesting that global warming is a good thing because at least the planet isn't getting colder. This is a false dichotomy - an ideal climate is a stable one. The relatively stable climate over the past 10,000 years has allowed establishment of human civilization, by making it possible to create large stationary agricultural farms because we could rely on stable weather patterns.
What difference would a grand solar minimum make in the amount of solar energy reaching us? Relative to current levels, the Dalton Minimum represents a 0.08% decrease, and the Maunder Minimum represents a 0.25% decline in solar radiation at the Earth's surface. That's how stable solar activity is. That's also why we're playing with fire by increasing the greenhouse effect so much and so quickly. We're threatening the stability of the climate that has been so favorable to our development.
Peer-Reviewed Research Says Global Warming will Continue
There have been several studies in recent years investigating what impact another grand solar minimum would have on global surface temperatures, since solar research suggests it's possible we could be due for another extended minimum. Generally these studies will run climate model simulations under a given greenhouse gas emissions scenario with stable solar activity, then run the same scenario with the sun going into a grand minimum, and look at the difference in resulting global surface temperature changes.
Feulner & Rahmstorf (2010) (PDF available here) estimated that another solar minimum equivalent to the Dalton and Maunder minima would cause 0.09°C and 0.26°C cooling, respectively.
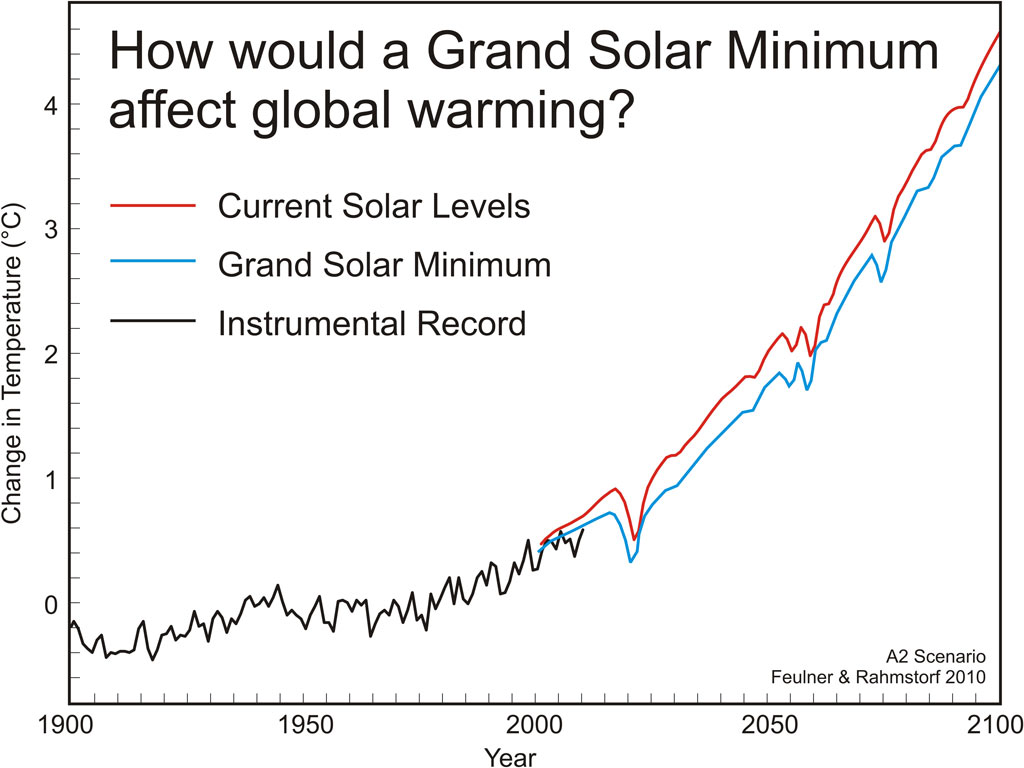
The global mean temperature difference is shown for the time period 1900 to 2100 for the IPCC A2 emissions scenario (relative to zero for the average temperature during the years 1961 to 1990). The red line shows predicted temperature change for the current level of solar activity, the blue line shows predicted temperature change for solar activity at the much lower level of the Maunder Minimum, and the black line shows observed temperatures from the NASA GISS dataset through 2010. Adapted from Feulner & Rahmstorf (2010).
Jones et al. (2012) (PDF available here) arrived at a nearly identical result, with cooling from a Dalton and Maunder minimum equivalent at 0.09°C and 0.26°C, respectively. Similarly, a new paper by Anet et al. (2013) found that a grand solar minimum will cause no more than 0.3°C cooling over the 21st century.
Consistent with these previous studies, Meehl et al. (2013) (PDF available here) estimate a Maunder Minimum would cause about 0.26°C cooling, but as soon as solar activity began to rise again, that cooling would be offset by solar warming. This is a key point, because a grand solar minimum would not be a permanent change. These minima last for a few decades, but eventually solar activity rises once again. Thus any cooling caused by a solar minimum would only be temporary.
A Rough Estimate without Climate Models
The cooling effect of a grand solar minimum can also be estimated very easily without the aid of climate models. The change in the amount of total solar irradiance (TSI) reaching the Earth's surface is directly proportional to the temperature change it causes. Earth's surface reflects about 30% of incoming sunlight (multiply TSI by 0.7), and TSI must also be divided by 4 to account for the Earth's spherical geometry.
To convert the energy change to a temperature change, we then just need to multiply by the climate sensitivity parameter. This is where it gets tricky for climate contrarians, because if the global climate is insensitive to rising greenhouse gases (as contrarians argue is the case), it's also insensitive to natural influences like changes in solar radiation. If we assume the most likely climate sensitivity estimate is correct (3°C for the equivalent of a doubling of atmospheric CO2), the equilibrium climate sensitivity parameter is 0.8. But only about two-thirds of that temperature change will be realized over short timescales, due to the thermal inertia of the global climate. So we can estimate:
?T2100 = 0.7*0.25*0.8*0.67*?TSI = 0.09*?TSI
So for a 0.25% change in TSI to Maunder Minimum levels (that's 3.4 Watts per square meter), our crude estimate is that a 0.3°C cooling would result by 2100; right in line with the model estimates.
The Heating of the Deep Oceans
In the Jyllands-Posten article, Svensmark also disputes the data showing the accelerated accumulation of heat in the deep oceans.
"How can the ocean below 700 meters be heated up, without the upper ocean warming up accordingly?"
This is an increasingly common argument made by climate contrarians, and a bit of a strange one. The data are what they are - we've measured the deep ocean warming, including with reliable Argo buoys for close to a decade now. Even if we couldn't explain how the heat got there, it's there.

5-year average ocean heat content for 0-700 meters (red) and 0-2000 meters (black), from NOAA.
But let's address the question anyway - do we expect to have seen some obvious indication of heat being transferred from the shallow to deep ocean layers?
It's certainly not clear that we should. Consider the analogy of a bathtub. Water from the faucet represents heat entering the shallow ocean layer, water exiting the drain represents heat leaving the shallow oceans and entering the deep oceans, and the water level in the bathtub represents the heat in the shallow ocean layer. If the amount of water entering the tub from the faucet is the same as the amount of water draining out of the tub, the water level won't change. Yet the water still flows down the drain. Climate scientist Gavin Schmidt discussed this point, summarized here.
In short, we wouldn't necessarily see the heat being transferred through the shallow to the deep oceans. However, there has been plenty of warming of the shallow oceans that could have been transferred to the deeper oceans. In our case, the water is flowing into the tub faster than it's draining out.
Svensmark Gets Ocean Warming Wrong
Unfortunately Svensmark appears to be unfamiliar with ocean heating data, saying,
"The thousands of buoys that we have deployed after 2003 to measure the ocean temperature, have not registered any temperature rise."
This is simply wrong, even if we ignore the rapid warming of the deep oceans (as is clear from a simple examination of the figure above). The ocean heat content data can be downloaded from the National Oceanographic Data Center here. The heating trend since 2003 in the upper 700 meters of oceans is 1.4 x 10²¹ Joules per year, which is an amount of energy equivalent to nearly 1 Hiroshima atomic bomb detonation per second (plus another 3 per second in the deep oceans).
Human Influence on Climate Change is Bigger than the Sun's
The bottom line is that the sun and the amount of solar radiation reaching Earth are very stable. Even during the Maunder and Dalton grand solar minima, global cooling was relatively small - smaller than the amount of global warming caused by human greenhouse gas emissions over the past century.
A new grand solar minimum would not trigger another LIA; in fact, the maximum 0.3°C cooling would barely make a dent in the human-caused global warming over the next century, likely between 1 and 5°C, depending on how much we manage to reduce our fossil fuel consumption and greenhouse gas emissions. While this is equivalent to about a decade's worth of human-caused warming, it's also important to bear in mind that any solar cooling would only be temporary, until the end of the solar minimum.
The science is quite clear that the human influence on climate change has become bigger than the sun's.
Also see an earlier video by Peter Sinclair at Climate Crocks debunking this myth.
Note: This post has been adapted into the new rebuttal to the myth "A grand solar minimum could trigger another ice age"


I am glad the Irish Times article came to your attention. The newspaper has actually a reasonably good record at reporting on climate change. The article on the solar minimum was an aberration because it did not mention CO2 at all, or the effect solar changes might have on global warming.
I intend to mail the link to this post to the science correspondent.
Dana,
I think your final formula to calculate ∆T is unreadable due to too many factors used. In the end, reading it, I'm confused which number is which factor.
I did my own calculation with simpler numbers as follows.
In my calculation, I don't need to consider ∆TSI. I can take amount of sun energy absorbed by Earth (∆TSabs) and assume it changes by the same percentage as ∆TSI. I think your calculation makes the same assumption, although I'm not sure. Then, from (Kiehl and Trenberth, 1997), I look at this picture:
Earth Energy Balance
and find out the amount of Sun energy absorbed by Earth is 168+67 W/m2 = 235W/m2 (ground + athmosphere absorbtion on the left side of picture).
So ∆TSabs = 0.25% * 235W/m2 = 0.5875W/m2
With the equilibrium sensitivity of 0.75K/Wm2, the corresponding ∆T is 0.5875*0.75 = 0.44K
So, my number is larger than yours (0.3K), other suties you quote. Why is that? Did I make a mistake?
One often encounters articles like this where some cherrypicked-out-of-context-but-original quotes from bonafide scientists (like Lockwood in the Irish Times article) is mixed with the breathtaking slay-of-hand conclusion by a fake authority and presented as a compelling picture to the public. In this case the fake authority who makes the final headline claim is Ian Elliott, an ex-astronomer who pensioned 12 years ago and has only few papers published during his professional career, none of which about the solar influence on Earths climate.
Judging by the wide circulation in the denial echo chamber this article is a perfect rehash of the old tobacco tactics.
chriskoz @2, you calculated the equilibrium climate response, wheras Dana calculated the transient climate response. The difference is in the factor of 0.67 Dana introduces for that purpose. Absent that, his value would have been 0.45 (or 0.48 with a less aggressive rounding).
One twist on this is that radiative forcing is calculated at the tropopause rather than the top of the thermosphere. Most UV radiation is absorbed above the tropopause, and the UV component of sunlight will varies in greater proportion with changing TSI. The effect is that with reduced TSI, relatively more of TSI will reach the surface than currently does. The solar forcing will still reduce, but not as much as the reduction in TSI so that the cooling will be even less than calculated.
Conversely, for the same reason, it requires a greater than 1.55% increase in TSI to generate a 3.7 W/m^2 increase in solar forcing.
Finally, it is possible that some such mechanism as that proposed by Svensmark would result in a greater reduction in temperature than simple calculations from TSI would suggest. His theory as it stands has been pretty much ruled out. Clouds form with great facility even in the absense of cosmic rays, and therefore cosmic rays are not the dominant force governing climate over the history of the Earth. However, cosmic rays may facilitate the generation of additional cloud nucleation particles thereby decreasing the average droplet size in clouds and hence increasing cloud albedo. This may amplify the direct TSI forcing by as much a factor of 2. Of course, there is as yet no solid evidence that this is the case. It just cannot be ruled out either.
cynicus,
Correct, and what is disquieting is that the newspaper in question if far from being the usual Murdoch lowest-common-denominator or Daily Mail rag. Like the Economist and the New York Times, even the quality publications are inconsistent. I suspect the Environment correspondent and the Science correspondent of the Irish Times do not seem eye-to-eye.
Chaps agreed a bit disappointing regarding the Irish Times, when I lived in Ireland it was easily the best paper - in the UK the Guardian is my paper of choice. I know Ian Elliott, or at least knew him when I was an undergraduate in Physics at UCD (1970ies). He was vwry good at public engagement. I can't really comment on him professionally as after becoming a graduate student in astronomy our paths never crossed.
StB
If the LIA started 500 years ago, then that precedes the start of the Maunder minimum by about 150 years. So where's the evdience that a grand solar minimum triggers colder climate?
John, dating the LIA is anything but simple. The Maunder may have been responsible for the worst of the LIA, but the Wolf and Spörer mins preceded it. There is also the volcanic factor to account for. This article addresses the skeptic claim that a new Maunder would cancel global warming. The article does not attempt to explain the LIA.
Although the informaion has received a fair amount of criticism because of source,
and even though I don't believe it either:
there is another innaccuracy, perhaps arising from pedantry, which I will eruct:
quote:"We're fortunate that the amount of solar radiation reaching the Earth's surface is very stable" endquote.
I would say that the author should report back on the accuracy of this statement the next time we're hit dead center by a solar flare.
Oh wait, he won't ba able to, as much of the electrical distribution system, and much of the electronics connected to it,
will be fried.
===============
I would agree that the cycle of the sun's output will have no significant net effect on our CO2 scenario
Tom@4,
Thanks for your insightful (as usual) comment.
So, the "atmosphere absorbtion" part of solar (67 W/m2 in Kiehl and Trenberth, 1997) is mainly UV absorbtion by the ozone layer 20-50k above surface. With such facts, it's worth to note that the proclaimed impending Maunder Minimum, although having little effect on AGW, will have a positive effect on the ozone hole: if the lower level sun activity is confined to essencialy UV spectrum, then ozone will be depleting at lower rate, giving it a chance to recover quicker. But I don't know how signifficant that latest effect would be.
This post opens the topic of somebody's question "How can the ocean below 700 meters be heated up, without the upper ocean warming" but does not give the simple blindingly-obvious answer. It's because the deep ocean (the majority of it) is colder (often far colder) than the upper few hundred metres at most places. If the ocean was same temperature surface to sea bed it would be impossible to raise temperature of the lower part from above without raising the temperature of the upper part, but it ain't, so it is.
Solar Output is Stable
Solar Output may be fairly stable at the top of the atmosphere, but solar radiation reaching the earth’s surface varies significantly. See: Wild 2009 in JoGR (http://www.leif.org/EOS/2008JD011470.pdf) and Wild 2012 in the AMS (http://journals.ametsoc.org/doi/pdf/10.1175/BAMS-D-11-00074.1).
Additionally, the uncertainty in the observations in the earth’s energy balance is significant. See: Stephens et al 2012 in Nature (http://www.nature.com/ngeo/journal/v5/n10/full/ngeo1580.html). A direct quote is:
“This lack of precise knowledge of surface energy fluxes profoundly affects our ability to understand how Earth’s climate responds to increasing concentrations of greenhouse gases.” – Graeme Stephens et al.
A quick look at Kiehl and Trenberth’s energy budget shows the surface imbalance is 0.6 +/- 17 W/m^2. Yes, that is plus/minus 17 W/m^2, which is an error bar that is 34 W/m^2 wide. The reduced IR flux from 1950 to today due to CO2 is on the order of only 1 W/m^2. The uncertainty in the earth’s surface energy balance is at least 30 times larger than the forcing effect of CO2.
Heating of the Deep Oceans
The ocean is warmed almost exclusively by short wave solar radiation. IR radiation from CO2 or the aerosphere does not, and cannot penetrate liquid water (not more than a few millimeters). Since the ocean surface is has also paused in warming, either short wave solar radiation is warming the ocean, or the deep ocean is not warming. Converting from heat content to degrees C, the ocean warming over the last 30 years is less than 0.1 degrees C, which is probably well within the error bars or the Argo float’s measurement ability.
Svensmark Gets Ocean Warming Wrong
Svensmark statement is not refuted by the NOAA Heat Content chart. Svenmark states the Argo floats have not registered any increase in temperature. The NOAA Heat Content is some output from a software model, not direct measurements like the Argo floats. Unless you can prove that Argo does show an increase in temperature, the NOAA Heat Content is a non sequitur to Svenmark’s claim.
Human Influence on Climate Change is Bigger than the Sun's
This may be true if you meant the change in the solar output at the top of the atmosphere -- since that varies by about 1 W/m^2,and the effect of CO2 is on the order of 1 W/m^2. But at the earth’s surface, the +/- 17 W/m^2 uncertainty completely swamps the effect of CO2.
Stealth,
Preach less, read more. Your understanding of ocean warming is wrong.
Stealth - Svensmark is in fact flatly wrong in claiming the ARGO probes "...have not registered any temperature rise", and you are equally off-base in claiming "...Heat Content is some output from a software model, not direct measurements...".
Temperatures measured by the ARGO floats and the XBTs before them are rising in the raw data, and the ocean heat content (OHC) is simply observed temperature change scaled by the thermal mass of the ocean layer in question - not some kind of complex model. OHC cannot be dismissed by appealing to model complexities.
---
OHC may be one of the best measures of the top of atmosphere imbalance available - averaged over long time periods, global, representing (for the full depth of the oceans) ~93% of the energy changes. And it is consistent with satellite observations of TOA flux (Loeb et al 2012). Adding up components of the Earth energy budget (evaporation, thermals, clouds, albedo, etc) sums estimate uncertainties - but OHC is a direct measure of TOA imbalance.
In addition to Sphaericas link on ocean warming/IR, I would also point out a RealClimate discussion of the same work.
Sphaerica @ 13: I followed your link and “read more”, but the link seems to support my statements @12. You may not like the information because it doesn’t support a CAGW position, or it shows that Dana is incorrect, but that doesn’t mean I am “preaching.” I fully admit I may be incorrect in my statements or have misunderstood something, and if so, please correct me. What in my statements @12 are wrong?
Stealth:
I would have thought your misconception regarding TOA vs surface energy balance and their respective significance with regards to global warming has been previously addressed, so I confess I am surprised to see you re-state it here.
I should also add that you appear to engage in cherry-picking. Stephens et al 2012 has to be considered in context with other papers of the same nature. As far as I have seen you have provided no analysis doing so. At the very least if you feel Stephens et al by itself outweighs any (or indeed every) other similar paper, it is down to you to show your working.
Finally, with respect to your assertions about NOAA vs ARGO, unless you yourself provide evidence (*) to support your claim, no one has any obligation to accept it as correct.
On that note, the opening paragraph of Levitus et al 2012 states:
So the data you deride uses the very same floats that Svensmark claims "have not registered any increase in temperature" and finds... that they have.
----------
(*) Evidence other than an appeal to your qualifications, I might add.
KR @14: Minnett 2000 and the A High-Accuracy, Seagoing Infrared Spectroradiometer paper (http://journals.ametsoc.org/doi/pdf/10.1175/1520-0426%282001%29018%3C0994%3ATMAERI%3E2.0.CO%3B2) point out that their “high accuracy equipment” has stated accuracies of 0.1K. The entire OHC content anomaly when converted from Joules back to temperature in the ocean is on the order of 0.09C (I assume you can do the math and conversion, but if not let me know and I’ll show my work). Clearly, OHC is within the error bars of the measurement system, unless Argo can measure more accurately (unlikely). It could be there or it might not be – it simply is too small to measure. Then, when combined with the number of measurements and uncertainties induces by thermal eddies and ocean mixture, it is seems unlikely to me that measurements can tease out the true OHC.
Finally, I believe OHC from NOAA suffers from modeling artifacts like surface air temperature (SAT). Please see Dr. Schmidt’s discussion of SAT at NASA GISS: http://data.giss.nasa.gov/gistemp/abs_temp.html
Stealth @17, as I understand it, the uncertainty of the mean of n values, each with uncertainty x equals x/(n^0.5). Your claim that the increase of OHC in within the error bars presumes either that there was just one measurement (for the whole ocean), or that the error of measurement is entirely composed of a systematic bias. Please put forward your evidence of either proposition.
Absent that evidence, you appear to be guilty of deliberate obscuring of the evidence (assuming that, as a scientist, you know the basic mathematics of uncertainties).
Stealth, to follow up on Tom Curtis's reply to you, read about the Law of Large Numbers.
Stealth - I would agree with Tom Curtis - claiming that the uncertainty of multiple measurements from almost 4000 ARGO floats is identical to the error of a single measurement is absurd, and anyone with science or engineering background (which you claim) should be well aware of this aspect of signal averaging, right along with the Central Limit Theorem.
OHC is an anomaly measure, not an absolute measure, and hence the link you provided regarding absolute measures is wholly irrelevant. Use of anomalies also removes any potential systemic bias in those measurements.
Your last few comments appear to be (IMO) increasingly disingenuous.
Stealth - You were involved in a long discussion of IR/ocean heating here, including the accuracy of OHC measurement, and in a discussion of the human contribution to warming here (thanks go to Google Search).
Yet your post on this thread repeats some of the very same misunderstandings.
It would be helpful if you were to avoid restarting discussions on another thread - without any apparent acknowledgement of either prior discussions, or the responses people have provided, as if the questions had never been addressed.
Stealth, you quote a line from Stephens to support your case. I note that you didnt quote the very next line.
" Specifically, the longwave radiation received at the surface is estimated to be significantly larger, by between 10 and 17 Wm−2, than earlier model-based estimates."
Now that doesnt sit well with the idea that uncertainities make any action unwarrented, or that science is overestimating AGW.
Your statements on Kiehl and Trenberth (you dont say which paper), dont seem to fit that well with Trenberth et al 2009. While they note the difficulties in surface budget, note:
"Therefore, we have a lot more confidence in the values we have assigned than indicated by the spread within the tables. TOA values are known within about ±3% or better, except that the net is (or was) 0.85 ± 0.15 W m−2 (Hansen et al. 2005), and surface fluxes are constrained within 5% except for solar-reflected, LH, and LW, where errors may be as much as 10%."
Note the TOA estimate is well constrained. If energy isnt leaving to space, where is it and why do you think the TOA imbalance is not a problem?
All: my apologies. I made a mistake and started too many conversations @12. I tried to respond to all of the issues I had with Dana’s article and I should have kept it to just one. Let me back up and do some homework on ocean heating. I may even go look at Argo data and play with it a little bit.
I’d like to restart and focus just on Dana’s multiple comments stating “the amount of solar radiation reaching the Earth’s surface is very stable.” I do not think this is true at all. I think Wild 2009 and 2012 (referenced above) both claim the opposite, and Kiehl and Trenberth’s energy budget (http://curryja.files.wordpress.com/2012/11/stephens2.gif) has a huge 34 W/m^2 window (30 times the effect of CO2 forcing). This clearly indicates there is a lot of variance in surface energy, or it is hard to measure, or both. In in case, it is not stable.
Stealth - There's plenty of regional variation in atmospheric transmission and albedo from clouds. However, global temperatures both surface and in terms of OHC show a rise that indicates an average imbalance of between 0.6-0.9 W/m2 over the last 50 years. That means the global variation of TOA imbalance is quite small over any reasonable time period.
I dont actually understand where you get your 34 "window" for solar, but I cant see how that diagram can tell you anything about stability of solar radiation reaching the earth (for which you need a time dimension). The error bars about the limitations of the measuring systems, but given that solar at TOA is very stable, if you claim that energy is not reaching the surface, then the imbalance is being stored in the atmosphere. Does that sound better to you somehow? More to the point, where is the evidence for storage of that kind of imbalance in the atmoshere? On the other hand, OHC changes match pretty well with the imbalance.
Stealth - Two small but, I believe, significant points:
The references you gave for variance of insolation reaching the ground in this post are for decadal variations, in particular mid-century dimming (1950's-1980's), the well known cooling associated with high aerosols, and in fact discussed on SkS. They also discuss some indications of higher aerosol cooling in the last decade, considered as a potential influence (although not dominant) in 21st century temperatures. Aerosols are a known forcing, and variations in insolation are generally treated separately based on satellite observations. And they are not short term variations.
The uncertainties you mentioned in the Trenberth energy budget (I'm speaking of Trenberth 2009 are uncertainties in absolute values, not variances. You seem to imply a 34 Wm-2 variance in energy imbalance, which is not what that paper is stating. In fact, what they say is:
Again, anomalies are very important, telling us how much these values have changed - not the absolute numbers. And uncertainties in TOA imbalance are highly constrained by other observations.