


 Arguments


Lessons from Past Climate Predictions: Arctic Sea Ice Extent 2012 Update
Posted on 10 October 2012 by dana1981
 Last year we examined a few predictions of the September annual Arctic sea ice extent in 2010 and 2011. We now have another year of predictions in the books, and a new record sea ice minimum. The Study of Environmental Arctic Change (SEARCH) has also collected sea ice extent predictions since 2008. In this post we will examine how these predictions have fared year-by-year, and Figure 1 below shows the average accuracy of individuals or groups who have made at least two annual Arctic sea ice extent predictions since 2008.
In all of the graphics in this post, orange bars represent model-based predictions, blue bars represent statistics-based predictions, purple bars represent heuristic predictions (experience-based, which essentially means any predictions not based on statistics or models), and green bars represent a combination of methodologies. Observational data from the National Snow and Ice Data Center (NSIDC) are provided to evaluate the accuracy of the predictions. Sea ice extent is defined as the portion of the Arctic covered by at least 15 percent ice.
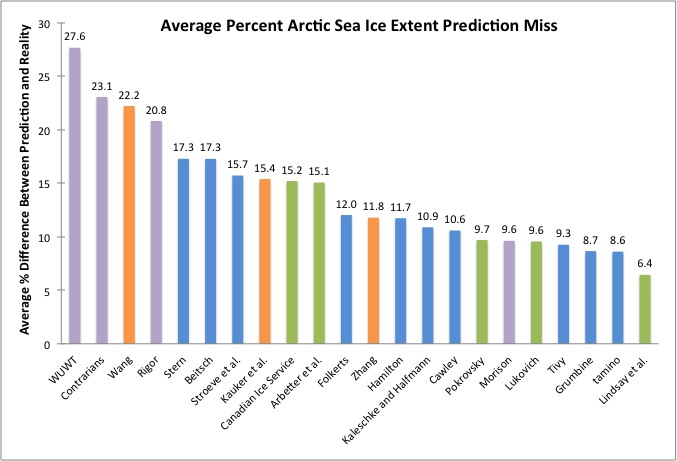
Figure 1: Percent difference between predictions and actual annual Arctic sea ice minima for individuals and groups which have made a minimum of two predictions.
Bear in mind that Figure 1 is not an entirely fair comparison, because as we will see below, the sea ice minimum in some years have been easier to predict than others; years in which the minimum extent falls near the long-term trend are easier, while extreme years like 2012 are much more of a challenge. Thus a group or individual which made two predictions in easier years has an advantage over those who made two predictions in more anomalous years.
Note that in this post we are only considering initial predictions, usually made in May or June each year. SEARCH also allows for revised submissions in July, August, and sometimes September, but those revised predictions are much less interesting.
2008 Predictions
2008 was the first year that SEARCH solicited Arctic sea ice predictions. It was a challenging year because the previous year had shattered the minimum sea ice extent record, and it was therefore difficult to know if ice conditions had changed to allow even further declines, or if the ice would "rebound" and regress toward less extreme values. As the Arctic Sea Ice Escalator in Figure 2 shows, the latter happened.
Figure 2: NSIDC September Arctic sea ice extent (blue diamonds) with "recovery" years highlighted in red, vs. the long-term sea ice decline fit with a second order polynomial, also in red.
14 groups submitted their predictions to SEARCH in 2008, with most being heuristic (no model-based or statistical methodology noted). Interestingly, the two model-based predictions of Lindsay and Zhang performed the best, predicting the ensuing sea ice extent almost perfectly (Figure 3). Note that in Figure 1 above, Lindsay (who has made predictions every year from 2008 through 2012 using varying methodologies) has had the most overall predictive success, and Zhang's model has also performed well through the years. The statistically-based estimates were the least successful in 2008, on average.
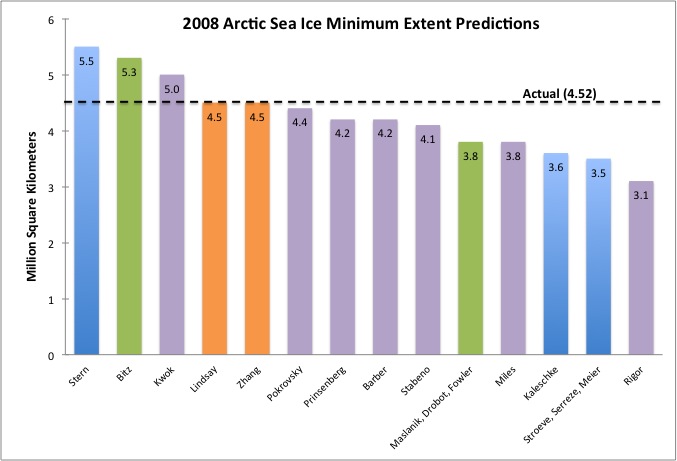
Figure 3: 2008 SEARCH September Arctic sea ice extent predictions vs. observation (4.52 million square kilometers).
2009 Predictions
In 2009 there was a second consecutive regression after the 2007 record minimum. In fact, there was a larger increase from 2008 to 2009 than there was from 2007 to 2008 (as is evident in Figure 2). As a result, all 15 SEARCH submissions under-predicted the 2009 extent (Figure 4). The statistical and combined approaches performed the best in 2009, with the models having less success.
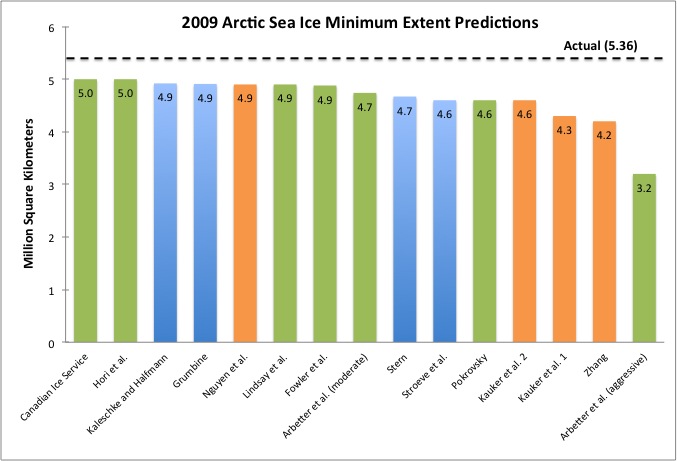
Figure 4: 2009 SEARCH September Arctic sea ice extent predictions vs. observation (5.36 million square kilometers).
2010 Predictions
The climate contrarians were emboldened by the sea ice "recoveries" in 2008 and 2009, and made a few unofficial predictions of their own. Anthony Watts and Steve Goddard predicted that there would be another 500,000 square kilometer rebound from 2009, thus predicting a 5.75 million square kilometer extent in 2010. There were also 18 submissions to SEARCH in 2010, and amongst the climate realist bloggers, tamino weighed in with his own prediction by fitting a quadratic trend line to the annual September sea ice extent data, as did Skeptical Science's own Gavin Cawley (Dikran Marsupial) using a Gaussian process model, as did Robert Grumbine, who also submitted a prediction to SEARCH in 2009.
There was no continued "rebound" in 2010 - instead Arctic sea ice extent declined to a level closer to the long-term downward trend (Figure 2). Overall, the statistical and model-based predictions fared equally well in 2010, and the heuristic predictions were not far behind, with Watts and Goddard dragging their accuracy down. There was also a rather strange combined heuristic and statistical prediction by Wilson of just 1 million square kilometers, which was very far off (Figure 5).
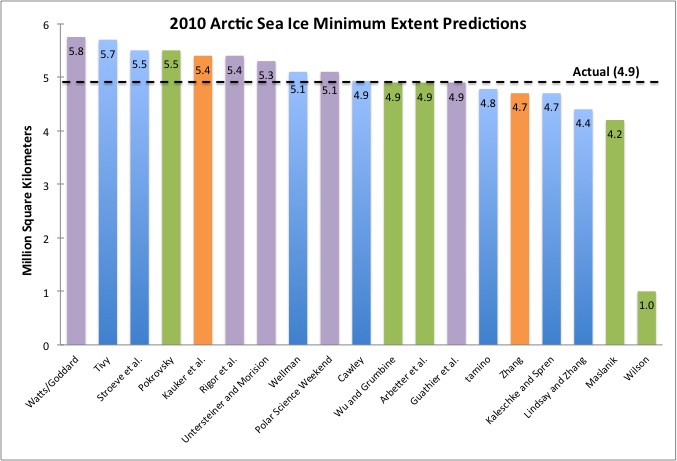
Figure 5: 2010 SEARCH, Anthony Watts and Steve Goddard, tamino, and Cawley September Arctic sea ice extent predictions vs. observation (4.9 million square kilometers).
2011 Predictions
Watts and Goddard may have been deterred by their inaccurate 2010 prediction, and did not record any predictions for 2011. However, in 2011 Watts submitted a prediction from his WattsUpWithThat (WUWT) blog readers to SEARCH. Another climate contrarian, Joe Bastardi weighed in with his own prediction. Coincidentally, the WUWT and Bastardi predictions were almost identical, predicting another large "rebound" from 2010. Cawley and tamino also weighed in with their predictions once again (Figure 6), and there were also 18 total SEARCH submissions.
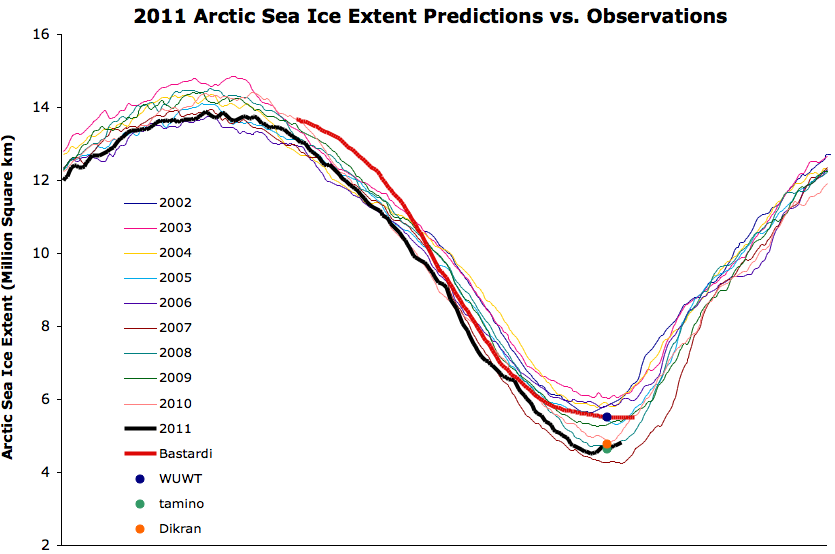
Figure 6: JAXA Arctic sea ice extent data, with an approximate re-creation of Joe Bastardi's 2011 prediction (red), WUWT readers' prediction (blue dot), tamino's prediction (green dot), Dikran Marsupial's prediction (orange dot), and the actual 2011 data (black). Source.
2011 saw yet another sea ice minimum decline, again close to the long-term downward trend (Figure 2 and Figure 6). As a result, the statistical approaches performed the best, with the models performing fairly well, and the heuristic predictions doing very poorly (Figure 7).
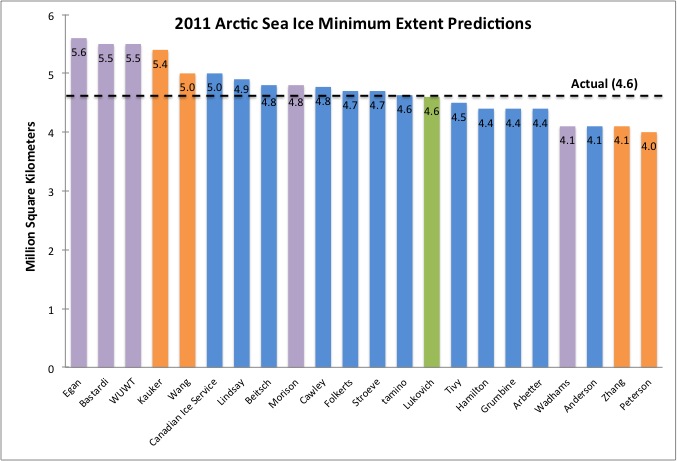
Figure 7: 2011 SEARCH, Bastardi, tamino, and Cawley September Arctic sea ice extent predictions vs. observation (4.6 million square kilometers).
2012 Predictions
The climate contrarians were perhaps discouraged by their poor prediction performances in 2010 and 2011, so only WUWT made a prediction in 2012 with a submission to SEARCH. Cawley also submitted his prediction to SEARCH, as did 18 other groups, and tamino submitted his own prediction on his blog.
As we now know, 2012 demolished the previous minimum Arctic sea ice extent record by approximately 760,000 square kilometers. As a result, all submissions over-predicted this year's extent. Once again the statistical predictions performed the best, with the heuristic predictions doing reasonably well thanks to Morison and Lukovich (despite WUWT dragging their average accuracy down), while the models were not very accurate (Figure 8).
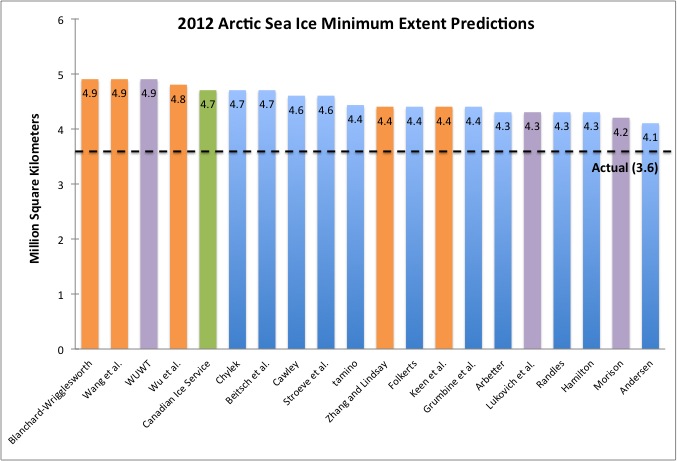
Figure 8: 2012 SEARCH, and tamino September Arctic sea ice extent predictions vs. observation (3.6 million square kilometers).
Overall Accuracy
Between 2008 and 2012, the model-based and statistical predictions have had the most accuracy, with an average difference from the observational data of 13%. However, in recent years the statistically-based predictions have been the most accurate. The heuristic predictions have been slightly less accurate, on average 15% off from the observations between 2008 and 2012.
The lower accuracy of the heuristic submissions is primarily due to the inaccurate predictions of the climate contrarians, which one Skeptical Science contributor has described as "hubristic," since they are based more on irrational optimism, unwise focus on short-term noise, and hubris than logic or experience. Ignatius Rigor's heuristic predictions have also not fared well (Figure 1), which are based on the belief that the Arctic Oscillation plays a major role in sea ice extent - a hypothesis which appears not to be borne out by the data thus far.
Climate contrarian bloggers and blog readers (Watts, Goddard, Bastardi, and WUWT readers) averaged a 23% miss with their hubristic sea ice extent predictions, while climate realist bloggers and blog contributors (tamino, Cawley, and Grumbine) averaged just a 9% miss with their statistically-based predictions. The take-home lesson here is that statistical predictions based on the long-term Arctic sea ice death spiral are clearly more realistic than denial-based optimistic predictions that sea ice will somehow magically recover to previous levels.


 0
0  0
0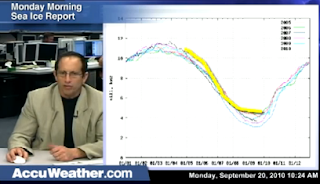 "...I think that's where we're gonna be next year. We're gonna recover dramatically here, with the cold that is coming over the next 9 to 12 months. I think next year you're gonna see the latest start to the sea ice melt that we've seen in a long time...."
One might ask, why, Joe?
"that is simply because of (hesitates)... you know... my studies show. And we'll see if I'm right".
Then, he claims he predicted correctly what happened this year. First, he said ""I was right about this year. It did not get down below here":
"...I think that's where we're gonna be next year. We're gonna recover dramatically here, with the cold that is coming over the next 9 to 12 months. I think next year you're gonna see the latest start to the sea ice melt that we've seen in a long time...."
One might ask, why, Joe?
"that is simply because of (hesitates)... you know... my studies show. And we'll see if I'm right".
Then, he claims he predicted correctly what happened this year. First, he said ""I was right about this year. It did not get down below here":
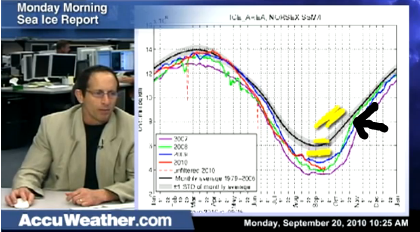
 "If people want to say, and they keep finding some metric to make you think its lower than it actually is... And I'm the guy who said this is where its going to wind up" (Confidently and proudly draws this yellow line):
 You heard it from Joe. That's where it wound up this year.
Then, he issues his prediction for the next 30 years. "...It's not going to get back to normal. That shouldn't happen for another twenty or thirty years. But we should be back up here next year. The higher you climb away from your low point the harder it is to get back, and I fully expect twenty, thirty, some of those years beyond, to be a little bit above normal...." (Draws the upper yellow squiggle line well above all other lines):
You heard it from Joe. That's where it wound up this year.
Then, he issues his prediction for the next 30 years. "...It's not going to get back to normal. That shouldn't happen for another twenty or thirty years. But we should be back up here next year. The higher you climb away from your low point the harder it is to get back, and I fully expect twenty, thirty, some of those years beyond, to be a little bit above normal...." (Draws the upper yellow squiggle line well above all other lines):
 This is just like war propaganda. (snip)
 Although Naam says he had to ask Kinnard for the chart, and the Kinnard et.al. study is behind a paywall at Nature, the Supplementary Information in pdf form isn't. Page 10 in the supplement has what looks a lot like the data Kinnard gave Naam on a chart containing a lot of other data.

 Marika M. Holland; Cecilia M. Bitz; Bruno Tremblay. Future abrupt reductions in the summer Arctic sea ice. Geophysical Research Letters. 2006, 33(23): 217. 25


Comments