


 Arguments


New data gives hope for meeting the Paris climate targets
Posted on 30 October 2017 by dana1981
Over the past half-century, growth in the global economy and carbon pollution have been tied together. When the global economy has been strong, we’ve consumed more energy, which has translated into burning more fossil fuels and releasing more carbon pollution. But over the past four years, economic growth and carbon dioxide emissions have been decoupled. The global economy has continued to grow, while data from the EU Joint Research Centre shows carbon pollution has held fairly steady.
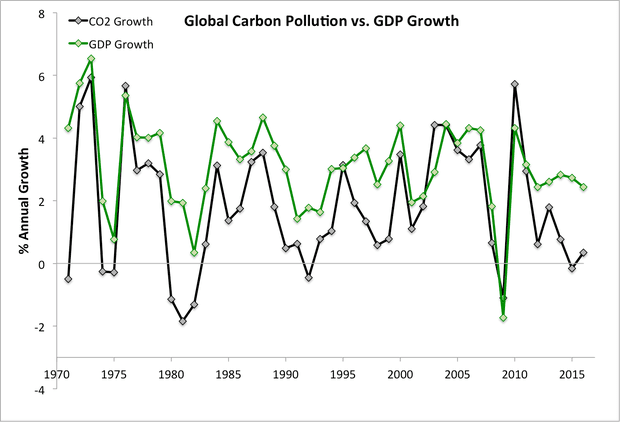
Annual global carbon dioxide and gross domestic product growth. Data from the EU Joint Research Centre and World Bank. Illustration: Dana Nuccitelli
China is becoming a global climate leader
China’s shift away from coal to clean energy has been largely responsible for this decoupling. Due to its large population (1.4 billion) – more than four times that of the USA (323 million) and nearly triple the EU (510 million) – and rapid growth in its economy and coal power supply, China has become the world’s largest net carbon polluter (though still less than half America’s per-person carbon emissions, and on par with those of Europeans). But as with the global total, China’s carbon pollution has flattened out since 2013.
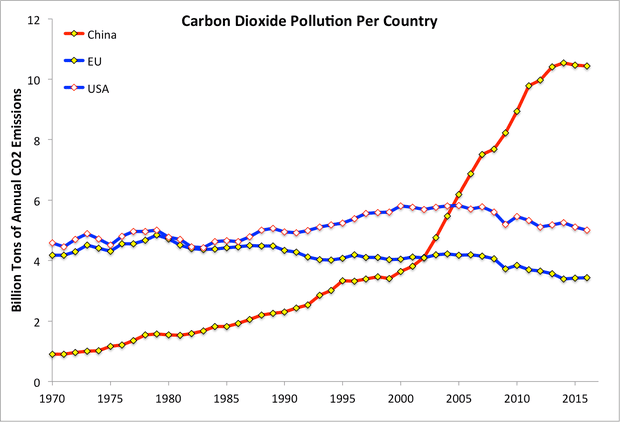
That’s especially remarkable because it puts China about 15 years ahead of schedule. In an agreement with President Obama ahead of the Paris international climate negotiations, Chinese President Xi Jingping pledged that China’s carbon emissions would peak by 2030. Republican Party leaders grossly distorted this agreement at the time, with Senate majority leader Mitch McConnell claiming:
As I read the agreement it requires the Chinese to do nothing at all for 16 years while these carbon emissions regulations are creating havoc in my state and around the country
As the chart above shows, Chinese carbon emissions tripled between 1999 and 2013. To slow that rate of growth to zero as the Chinese economy continues to grow would require a dramatic shift in the country’s energy supply. But that’s exactly what’s happened, with the Chinese government cancelling over 100 planned new coal power plants earlier this year. Chinese coal consumption has in fact fallen since 2013. And China and the EU have pledged to strengthen their efforts to cut carbon pollution.
America isn’t a lost cause
The Trump administration has done everything in its power to reverse that trend. It began the withdrawal from the Paris climate agreement and the process to repeal the Clean Power Plan, has begun censoring EPA climate scientists and deleting climate change information from government websites, and proposed to prop up the dirty, failing coal industry with taxpayer-funded subsidies.
And yet, while these steps can slow the decline in American carbon pollution, the transition from coal to clean energy will nevertheless persist. Coal simply can no longer compete with cheaper, cleaner sources of energy, and the next American president can quickly reverse many of the Trump administration’s anti-climate orders.


I'm not so sanguine about this decoupling of CO2 and GDP. From the graph there appears to have been a similar "decoupling" around 1980. I reckon one would need to wait a few more years to see if this recent "decoupling" is a real trend.
I'm more with Digby on this one. Don't the Chinese have a history of presenting 'official' stats on various fields including carbon emissions, only to 'revise' them, sometimes rather drastically later?
Of course, we all want this to be true...all the more reason to put on our 'Skeptical Science Spectacles' (say that ten time fast!) to critically examine the bases of these claims.
wili, the data in question didn't come from the Chinese government. The chart showing Chinese emissions leveling off is based on independent research by the EU.
Digby, there is a difference between the recent 'decoupling' and previous 'mismatches' in the data. Specifically, previous discrepancies were of degree (i.e. one factor shifted by a larger percentage than the other) and timing (i.e. one factor moved a year or two before the other). The recent differences have also been of direction (GDP growing while emissions are declining) and duration.
Also, if you follow the link at the bottom to the full article you will see a third graph showing California GDP growth of ~35% over 16 years, while emissions shrank ~7%. Similar results have been observed for various other locations... making clear that the decoupling of GDP and emissions is not some statistical phantom. It has been observed in specific regions for a long time, and has now grown to the point that it is visible in the global data.
Unfortunately actual CO2 levels are rising at a record pace. According to the WMO yesterday, "The record increase of 3.3 ppm in CO2 from 2015 to 2016 was larger than the previous record increase, observed from 2012 to 2013, and the average growth rate over the last decade."
They do partly attribute it to the recent El Nino, but still, I find it hard to celebrate this apparent decoupling in the face of such news.
The reason for the decoupling may be partly as follows. I recall reading that the 2008 global financial crash led to a drop in energy investment that persisted for several years. This lead to a drop in growth of emissions,for a few years.
The recovery in gdp growth from about 2010 onwards was apparently based on more efficient use of existing energy infrastructure. This process of efficiency will have limiting factors, and So the decoupling may be a temporary anomaly.
However as more renewable energy enters the mix you would still expect a gradual decoupling over longer time frames?
CBDunkerson @3
I acknowledge that the analysis is more complicated than a quick glance at the graph will show. However, I think I'd still prefer to wait a few years before trumpeting this recent decoupling.
There is also the fact that atmospheric CO2 is still going up, it hangs around in the atmosphere for a long time, and our emissions would have to drop much much more if we are to see a downward trend in ppm.
Recommended supplemental reading:
World set to bust global warming goal, but U.N. cool on threat from Trump by Tom Miles, Reuters, Oct 31, 2017
Digby, there is really no link between decoupling CO2 emissions from GDP and atmospheric CO2 levels decreasing... the latter won't happen until we get emissions down near zero.
ianw01, the record annual CO2 increase last year would certainly not have occurred without the El Nino event... because human emissions were flat. We'll have to wait a few years to be sure, but given recent trends I think there is a good possibility that it will mark the high point... i.e. that 3.3 ppm annual increase will be the highest recorded, with the rate decreasing from here.
CBDunkerson @8
I wasn't thinking about GDP when I said our emissions have to decrease "much much more"! There was a discussion about this at RealClimate some time ago. It seems that the Keeling curve will change direction only with a really large drop in emissions, but the emssions don't actually have to go to zero before we see a change. However, to get the final result we want, our emissions will of course have to go to zero.