What would happen if the sun fell to Maunder Minimum levels?
Posted on 19 February 2010 by John Cook
The sun's output is not static - it varies over a 11 year cycle and also shows long term changes. Currently, the sun is beginning to come out of a prolonged and deep solar minimum. This has led some to speculate that the sun might be entering a period of low solar activity similar to the Maunder Minimum in the late 17th century. At that time, the planet experienced markedly lower temperatures, particularly in the Northern Hemisphere. How would the Earth's climate respond if the sun did enter another Maunder Minimum? This answer is explored in a new paper On the Effect of a New Grand Minimum of Solar Activity on the Future Climate on Earth (Feulner & Rahmstorf 2010).

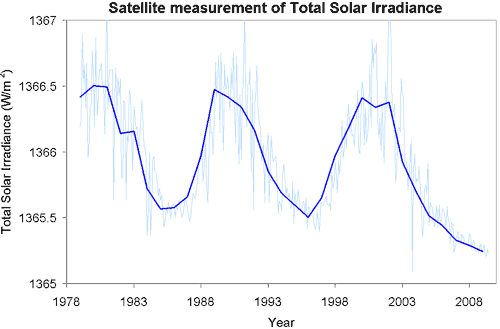
Figure 1: Satellite measurements of Total Solar Irradiance (TSI), reconstructed by PMOD. Light blue thin line shows monthly values, dark blue thick line shows yearly averages.
The paper uses a fully coupled climate model to simulate what would happen if the sun fell to Maunder Minimum levels in the 21st Century. To include the effect of greenhouse gas emissions, they assume either A1B or A2 scenarios (IPCC TAR). A1B is a more optimistic scenario where carbon dioxide emissions continue to rise in the early 21st Century, stabilise mid-century then fall in the latter-21st Century. A2 is somewhat more pessimistic, projecting carbon dioxide emissions to continue growing throughout the 21st Century. To factor in the influence of volcanoes, 20th Century eruptions are randomly distributed over the 21st Century. This is necessary to avoid artificial drift of the model from an unnatural lack of volcanic forcing.
Two methods are used to determine how low total solar irradiance (TSI) fell during the Maunder Minimum. Ice core measurements of beryllium indicate a less variable TSI while modelling from solar magnetic flux show a greater decrease in TSI during the Maunder Minimum. To check whether the climate model accurately responds to solar forcing, global temperature was modelled over past periods of Grand Minima such as the Maunder and Dalton Minima. The TSI reconstruction with lower variation shows excellent agreement with reconstructed past temperatures while the model results from the more variable TSI give cooler results. This suggests the TSI reconstruction with less variability is more accurate although both reconstructions are still used.
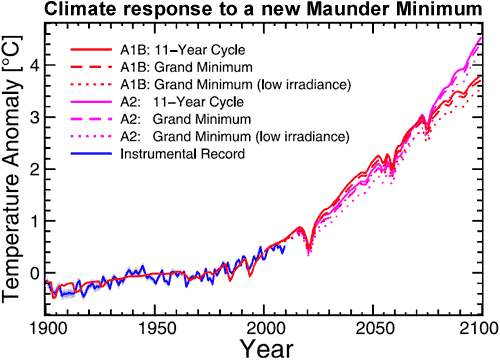
Three solar scenarios are modelled. One repeats the last 11-year solar cycle until 2100 (eg - no long term change in solar activity). The other scenarios involve the sun entering a new Grand Minimum using the TSI reconstructions with less and greater variation. The results are shown in Figure 2. The magenta lines are for the A2 emission scenario, the red line for the A1B scenario. The important feature is the comparison between the solid line (with no solar change) to the dotted and dashed lines (the two Maunder Minimum scenarios).

Figure 2: Global mean temperature anomalies 1900 to 2100 relative to the period 1961 to 1990 for the A1B (red lines) and A2 (magenta lines) scenarios and for three different solar forcings corresponding to a typical 11-year cycle (solid line) and to a new Grand Minimum with solar irradiance corresponding to recent reconstructions of Maunder-minimum irradiance (dashed line) and a lower irradiance (dotted line), respectively. Observed temperatures from NASA GISS until 2009 are also shown (blue line) (Feulner 2010).
For both the A1B and A2 emission scenario, the effect of a Maunder Minimum on global temperature is minimal. The TSI reconstruction with lesser variation shows a decrease in global temperature of around 0.09°C while the stronger variation in solar forcing shows a difference of around 0.3°C. Compare this to global warming between 3.7°C (A1B scenario) to 4.5°C (A2 scenario). Considering the less variable solar reconstruction shows such strong agreement with past temperature, the authors conclude the most likely impact of a Maunder Minimum by 2100 would be a decrease in global temperature of 0.1°C . With all uncertainties taken into account, the estimated maximum decrease in global temperature is 0.3°C.
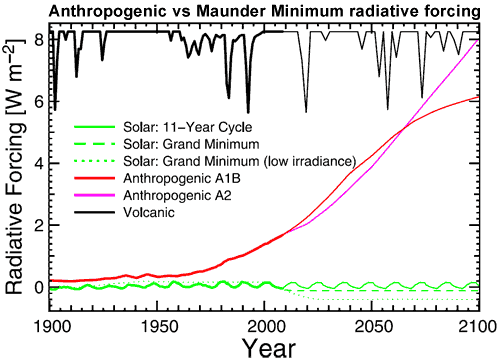
To understand why solar influence is so small, it's helpful to compare the radiative forcing from a cooling sun to the radiative forcing from anthropogenic greenhouse gases. The solid green cycle shows solar forcing with no long term change. The dashed green line is the change in solar forcing if we fall to Maunder Minimum levels using the TSI reconstruction with smaller variation. The dotted green line shows Maunder Minimum forcing from the TSI reconstruction with greater variation. The red and magenta lines show the forcing from anthropogenic greenhouse gases for the two different emission scenarios.

Figure 3: Radiative forcings used in the simulation experiments, with observed values until 2008 marked by thick lines. Volcanic radiative forcing (the downward spikes at the top of the graph) has been shifted by +8:25 W/m2 for clarity (Feulner 2010).
Both solar reconstructions show the weak forcing from solar changes compared to the forcing from anthropogenic greenhouse gases. It also bears reminding that any offset from a solar Grand Minimum would be temporary as past minima only lasted a few decades to a century. This means the impending ice age is still postponed indefinitely.


 Arguments


 0
0  0
0


Comments