Climate Science Glossary

Term Lookup

Enter a term in the search box to find its definition.

Settings

Use the controls in the far right panel to increase or decrease the number of terms automatically displayed (or to completely turn that feature off).

Term Lookup

Settings


All IPCC definitions taken from Climate Change 2007: The Physical Science Basis. Working Group I Contribution to the Fourth Assessment Report of the Intergovernmental Panel on Climate Change, Annex I, Glossary, pp. 941-954. Cambridge University Press.

Home Arguments Software Resources Comments The Consensus Project Translations About Support

Twitter Facebook YouTube Mastodon MeWe

RSS Posts RSS Comments Email Subscribe


Climate's changed before
It's the sun
It's not bad
There is no consensus
It's cooling
Models are unreliable
Temp record is unreliable
Animals and plants can adapt
It hasn't warmed since 1998
Antarctica is gaining ice
View All Arguments...


Username
Password
New? Register here
Forgot your password?

Latest Posts

Archives

Accelerating ice loss from Antarctica and Greenland

Posted on 29 October 2009 by John Cook

One of the greatest uncertainties in climate models is predicting the behaviour of positive feedback systems. An example is the loss of ice mass from the ice sheets on Greenland and Antarctica. As temperatures warm, ice melts contributing to sea level rise. However, water also lubricates the base of the ice sheets, causing the ice to slide faster as it calves into the ocean. The IPCC AR4 report in 2007 was conservative in incorporating these mechanisms in their modelling. Consequently, they didn't predict a large contribution from Greenland and Antarctica to sea level rise over the century.

As new data comes in, we can assess the behaviour of the ice sheets to gain a clearer understanding of how the ice sheets behave. A new paper Increasing rates of ice mass loss from the Greenland and Antarctic ice sheets revealed by GRACE (Velicogna 2009) analyses the latest results from the GRACE satellite data to discern the trend in mass change in the Antarctic and Greenland ice sheets.

Figure 1 shows the ice mass changes in Greenland for the period April 2002 to February 2009. The blue line/crosses show the unfiltered, monthly values. The red crosses have seasonal variability removed. The green line is the best fitting quadratic trend.


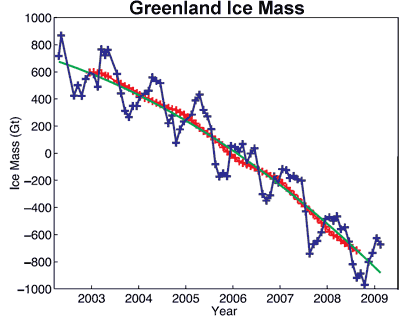
Figure 1: Time series of ice mass changes for the Greenland ice sheet estimated from GRACE monthly mass solutions for the period from April 2002 to February 2009. Unfiltered data are blue crosses. Data filtered for the seasonal dependence using a 13-month window are shown as red crosses. The best-fitting quadratic trend is shown (green line).

Antarctic ice mass loss is more complicated. While West Antarctica is showing strong warming and ice mass loss, the Eastern land mass is in approximate mass balance. This is because while East Antartica is losing ice at the edges, it's gaining ice in the interior. Nevertheless, overall the continent is losing ice mass as seen in Figure 2.


Figure 2: Time series of ice mass changes for the Antarctic ice sheet estimated from GRACE monthly mass solutions for the period from April 2002 to February 2009. Unfiltered data are blue crosses. Data filtered for the seasonal dependence using a 13-month window are shown as red crosses. The best-fitting quadratic trend is shown (green line).

For both ice sheets, the mass loss is accelerating with time. To discern the long term trend, the best fitting estimate was a quadratic trend that found that Greenland was losing an extra 30 Gigatonnes/yr2. In other words, the contribution to sea level rise from Greenland is accelerating at a rate of 0.09 mm/yr2. This means that Greenland's mass loss doubled over the 9 year period.

Similarly, Antarctic ice mass loss is accelerating at a rate of 26 Gigatonnes/yr2. This is equivalent to an acceleration of sea level rise at the rate of 0.08 mm/yr2. Antarctic mass loss increased by 140% over the 9 year period. The combined contribution of Greenland and Antarctica to global sea level rise is accelerating at a rate of 56 gigatonnes/yr2 during April 2002–February 2009, which corresponds to an equivalent acceleration in sea level rise of 0.17 mm/yr2.

These results unambiguously reveal an increase in mass loss from both ice sheets. The acceleration in mass loss is statistically significant to a high degree (99%). We already knew that Greenland and Antarctica ice sheets play an important role in the total contribution to sea level. That contribution is continuously and rapidly growing.

0 0

Printable Version  |  Link to this page

Comments

Comments 1 to 27:

  1. If this was a set of data refuting climate change you would be dismissing it for the short time period it covers. Yet you don't seem to be worried about this here. Unfortunately in this paper they don't state the geographical position for the data set over the antartic. A previous Chen paper that analysed the GRACE data did the analysis at two geographical positions on antartica and found mass loss in the West and mass gain in the East. I wonder if any comment is needed about the seasonal variation in Greenland. The artic ice sheet extent is very regular reaching its minimum point within a few days every year (mid-September). Ice mass minimum appear to be much more variable here, spread over several months, does that matter? Could be an indication of error introduced during processing. Finally this paper shows some interesting info and suggests there are more important things than global mean temperature that affect local Greenland temperature. http://polarmet.mps.ohio-state.edu/jbox/pubs/Box_2002_Greenland_Temperature_Analysis.pdf . The paper I linked to above also suggests winter variation is of importance in Greenland. There are a few year on the graph in this article were it can be seen that mass build up was severely cut short during winter 2006, 2007 and 2008 stand out. Is this then purely temperature or are local weather factors (precipitation) affecting the situation. I'm starting to realise the vast amount of data out there and how easy it is to pick stuff to support any position.
    0 0
  2. Article states... "As temperatures warm, ice melts contributing to sea level rise." ... and I suppose sea cooling as ice melts into it. Please see the following for temperatures in Greenland. http://www.cru.uea.ac.uk/cru/data/greenland/vintheretal2006.pdf Page 10 contains a very intesting graph breaking out temperatures along seasons for the last 200 years. Air temperatures generally remain below zero nine months of the year. I assume not much ice is melting during these months. According to the data, since the year 1800 there have been warmer and cooler decades. If there is a trend, it is very slight, and only seems to affect winter months when temperatures are still remaining well below freezing. On the other hand, there is no trend like this for the summer months, so what explains ice melt acceleration? ''''''''''''''''''''''''''''''''''' Also, during the winter hardly any sunlight reaches these parts, and yet the warming trend is affecting winters when people in the northern hemisphere just happen to be consuming the most heating oil. Is'nt that curious?
    0 0
  3. re #1 the notion that one can "pick stuff to support any position", doesn't apply if one makes an effort to assess the science more broadly HumanityRules. In reality there isn't much question about the accelerating mass loss in Greenland, and there is a consistent picture of nett mass loss in Antarctica from a number of different measurements. You've chosen a single paper by Box et al. from quite a few years ago to make a point about Greenland. I find it useful for oldish papers to determine what the authors themselves have published in the intervening years, let alone the more general recent work on the topic at hand. So in fact even just focussing on recent work by Box indicates that your criticisms don't have much merit. Obviously since GRACE satellites have only been active since 2002, one can hardly expect a longer time series from GRACE! However why not look more widely into the science? Box has recently described an analysis of Greenland mass balance from 1958 - 2007 [*] which indicates a marked acceleration of negative mass balance especially since the late 1980's. Likwise Box has updated the Greenland temperature series that you linked to an earlier version of, and has pointed out that volcanic eruptions and manmade industrial aerosols have resulted in suppression of warming during periods of the 20th century, but that the recent warmng has pushed Greenland temperatures over the threshold of viability, and that Greenland warming is lagging behind the expected warming rate based on N. hemisphere trends. If Greenland warming were to get back in the expected phase with N. hemisphere warming it still has around 1-1.6 oC of warming to "catch up". None of this is surprising in the light of a very consistent set of data from GRACE, and surface and station temperature records, ocean glacier retreat, mass balance measurements from altimetry, Greenland surface melt, etc. etc. Obviously if one selects a single oldish paper from the scientific literature one might be able to support a particular point in the manner you suggest. However it is the weight of disparate evidence that lends confidence in the conclusions about the climate response with respect to specific phenomena - that's partly why the IPCC reports are so useful since they collate and assess everything. However the intermittent nature of these means that one does need to be aware of the very recent studies since these are rapidly progressing fields.... [*] E. Rignot, J. E. Box, E. Burgess and E. Hanna (2008)Mass balance of the Greenland ice sheet from 1958 to 2007 Geophys. Res. Lett. 35, L20502 http://www.agu.org/pubs/crossref/2008/2008GL035417.shtml [**] J. E. Box et al (2009) Greenland Ice Sheet Surface Air Temperature Variability: 1840–2007 J. Climate 22, 4029-4049 http://ams.allenpress.com/perlserv/?request=get-abstract&doi=10.1175%2F2009JCLI2816.1
    0 0
  4. For longer time series of antarctic ice cover, there are other sources, although there are periods of missing data in between. Rayner et al. http://hadobs.metoffice.com/hadisst/HadISST_paper.pdf It is true the GRACE project is recent, and the period it covers is still short in climatic terms. But it contrasts with the data that shows Antarctica gaining ice AREA. It has has been loosing ice in the short and long term.
    0 0
    Response: Also keep in mind that Antarctic sea ice and Antarctic land ice are two separate phenomenon, each with unique characteristics and influences. Antarctic land ice is showing a long term trend of accelerating ice mass loss. Antarctic sea ice has shown a long term trend of increasing sea ice extent. This is despite the fact that the Southern Ocean surrounding Antarctica is warming. More here...
  5. re #2 RSVP, inspection of the Figure on page 10 of the paper you linked to shows that with recent warming, the temperatures are now above zero for 6 months of the year (JJA and SON) and the three month period MAM is getting close to zero. That's obviously linked to the acceleration of Greenland mass loss, especilly during the last 20 years, as indicated by now a rather large amount of evidence (see top post and my post #3). It's worth pointing out that the authors of the paper you linked to have very recently published a long term temperature analysis of the Arctic [*] (in other words it doesn't just focus on the set of West/SW coast coastal stations in the paper you linked to). This indicates that a very long term, and very slow cooling trend resulting from the extremely slow variation in earth orbital parameters, has undergone a marked reversal in the 20th century. So over the last 2000 years, an achingly slow cooling of around 0.2 oC per 1000 years, has been reversed such that we've already had about 1.4 oC of warming in the region in around 100 years. [*] D. S. Kaufman et al. (2009) Recent Warming Reverses Long-Term Arctic Cooling Science 325, 1236 - 1239 http://www.sciencemag.org/cgi/content/abstract/325/5945/1236
    0 0
  6. Personally, I would be wary of accepting the idea that ice loss is accelerating. Sea level rise is pretty much flat for the last couple of years, which strongly implies if ice mass is accelerating its decrease, then rate of change of steric increase in sea level must be dropping. You can't have it both ways. Cheers, :)
    0 0
    Response: When inverse barometer effect is filtered out (as it adds a lot of noise to the sea level signal), we find sea level rise is unabated in recent years:


    Sea level rise is subject to internal variability due to ocean processes like El Nino/La Nina. In La Nina conditions, sea level falls. Considering that we've been experiencing the strongest La Nina conditions in over 20 years and yet the rate of sea level rise has not fallen, the only explanation is that the contribution from ice sheets has increased. This is confirmed by the latest GRACE satellite data.
  7. One general comment on the length of a time serie. There is no pre-defined minimum lenght to asses a trend. It depends essentially of the interannual variability so that for a low varibility phenomenon a few years could be enough. A nice example are the first CO2 measurements at Mauna low; after just few years Keeling was able to determine a consistent trend. But keep in mind that this do not allow any meaningful extrapolation on either side of the serie. @shawmet you should put some numbers before coming to a conclusion. If you add 286 Gt (the number for Greenland) of water to the world oceans you will get an increase in sea level of about 0.8 mm. Now look at the figures in this post and you will notice (just eyeballing) an interannual variability of almost 10 mm. Here again comes the relation between length of a time serie and interannual variability. In the case of sea level plus or minus 0.8 mm for a few uears does not change much. But if repeated over decades you will detect the difference.
    0 0
  8. Riccardo, what causes interannual variability in sea level? It has to vary for some reason, generally either the water is holding more/less heat or more ice has melted It doesn't just decide randomly to increase its level. Unless it is caused by something other than ice melt and steric heat level increase my point still stands. Do you have something else in mind? Cheers, :)
    0 0
  9. re #6, Riccardo has beaten me to it, but " a couple of years" is an awful short time to consider changes in sea levels, especially in light of the high interannual variability in sea level measurements, some of which is real (effects of El Nino’s, La Nina’s and the descent of the solar cycle from its max in 2003 to min in 2009 during this period) and some of which is measurement error (comparison of satellite altimetry and tide gauge measures indicates this is around 0.5 mm per year). A couple of recent papers have addressed the “sea level budget” over this very short period and concluded that the budget can be “closed” from the evidence that the mass (polar ice cap melt and mountain glacier retreat largely) has made a larger contribution to sea level rise, compared to the steric (warming) contribution, in this very short period (around 2002/3-2007/8) compared to the previous decade [*,**]. So that’s consistent with an increase in the rate of polar ice melt, and a small decrease in steric contribution perhaps due to the drop of the solar output in the period 2003-2009 as the sun has dropped to the bottom of the solar cycle. [*] Leuliette EW and Miller L (2009) Closing the sea level rise budget with altimetry, Argo, and GRACE Geophys. Res. Lett. 36, L04608 http://www.agu.org/pubs/crossref/2009/2008GL036010.shtml [**] Cazenave A et al. (2009) Sea level budget over 2003-2008: A reevaluation from GRACE space gravimetry, satellite altimetry and Argo Global Planet. Change 65, 83-88 astract: From the IPCC 4th Assessment Report published in 2007, ocean thermal expansion contributed by 50% to the 3.1 mm/yr observed global mean sea level rise during the 1993–2003 decade, the remaining rate of rise being essentially explained by shrinking of land ice. Recently published results suggest that since about 2003, ocean thermal expansion change, based on the newly deployed Argo system, is showing a plateau while sea level is still rising, although at a reduced rate ( 2.5 mm/yr). Using space gravimetry observations from GRACE, we show that recent years sea level rise can be mostly explained by an increase of the mass of the oceans. Estimating GRACE-based ice sheet mass balance and using published estimates for glaciers melting, we further show that ocean mass increase since 2003 results by about half from an enhanced contribution of the polar ice sheets – compared to the previous decade – and half from mountain glaciers melting. Taking also into account the small GRACE-based contribution from continental waters (< 0.2 mm/yr), we find a total ocean mass contribution of 2 mm/yr over 2003–2008. Such a value represents 80% of the altimetry-based rate of sea level rise over that period. We next estimate the steric sea level (i.e., ocean thermal expansion plus salinity effects) contribution from: (1) the difference between altimetry-based sea level and ocean mass change and (2) Argo data. Inferred steric sea level rate from (1) ( 0.3 mm/yr over 2003–2008) agrees well with the Argo-based value also estimated here (0.37 mm/yr over 2004–2008). Furthermore, the sea level budget approach presented in this study allows us to constrain independent estimates of the Glacial Isostatic Adjustment (GIA) correction applied to GRACE-based ocean and ice sheet mass changes, as well as of glaciers melting. Values for the GIA correction and glacier contribution needed to close the sea level budget and explain GRACE-based mass estimates over the recent years agree well with totally independent determinations.
    0 0
  10. IPCC AR4 states: "Current global model studies project that the Antarctic Ice Sheet will remain too cold for widespread surface melting and is expected to gain in mass due to increased snowfall. However, net loss of ice mass could occur if dynamical ice discharge dominates the ice sheet mass balance." and "General Circulation Models indicate that the Antarctic Ice Sheet will receive increased snowfall without experiencing substantial surface melting, thus gaining mass and contributing negatively to sea level. Further accelerations in ice flow of the kind recently observed in some Greenland outlet glaciers and West Antarctic ice streams could substantially increase the contribution from the ice sheets." I wonder if their conservative conclusion will change by AR5, given several recent studies on sea level rise projections and recent observations of Antarctic ice sheet loss.
    0 0
  11. Thanks Chris. Very interesting papers that nicely complement the subject of the post.
    0 0
  12. Chris As per data in cited Journal of Geophysical Research article, there is actually a general cooling trend between what looks like the year 1940 and 1995. From there, yes, there is sharp warming swing, however, a very similar signature is visible around 1930 (although emerging from what looks like an even colder period that preceded it).
    0 0
  13. Some quick math. If you take the current sea level rise as 3mm/y, apply 0.17mm/y^2, and run that out 90 years, you get a total sea level rise of 0.97 meters. So meter scale sea level rise by 2100 is perfectly in line with these observations.
    0 0
  14. Yeah, sure. Also, if you take the current birth rate in the world, 2,6 child per woman, and apply it the development of the world's population, you get the frightening figure of 134000 billions of people on earth by the year 2300 (according to a UN report). In other words, stop projecting millimeter figures hundreds of years ahead! It's not going to happen according to our little curves, based on the years 2003 to 2007 or whatever is the latest alarming 'report'. We have no knowledge of what is going to happen to sea levels, temperatures, or ice sheets, with a perspective of hundreds of years into the future. It is just guess work.
    0 0
    Response: Actually, the past gives us a good insight into where we're headed into the future. Our lower CO2 emission scenarios have global temperatures rising by around 2°C. The last time our climate was this warm, around 125,000 years ago, global sea levels were over 6 metres higher than today. So we are on a current trajectory for sea level rise of at least 6 metres. There is some uncertainty about how quickly this might happen - at the moment, the peer-review research indicates we'll face 1 to 2 metres sea level rise by 2100 but how quickly we reach 6 metres is uncertain.
  15. A list of winter temperatures on Greenland, from the 1880's to the 1950's reads as follows: -11,7 -10,9 -11,1 -9,9 -8,4 -8,0 -7,2 If a climate scientist, with 'good insight' at that time (in 1960), would have projected this trend into a trajectory for temperatures to come, the temperatures for the following decades would have been: -6,5 -5,7 -4,8 -4,0 -3,2 We would now have a typical winter temperature of -3. But that is not what happened in real life. It is more like -10. The next five decades actually had the following temperatures: -8,4 -6,9 -8,6 -10,1 -10,3 So much for climate trends.
    0 0
  16. John, Are your two first figures melted ice mass overland? (I guess not) If not, I would like to know the ratio, so we could maybe transform that into sea level rise. And what percentage of mass is that anyway? Gigatons make it very difficult to acknowledge the magnitude of what we are talking about.
    0 0
    Response: As far as I know, most or all of the Greenland ice sheet is over land. Some of the West Antarctic ice sheet is over water - I can't tell you off the top of my head how much or what percentage of mass is falling. Please feel free to investigate the figures and report back to let us know what you uncover :-)
  17. Notwithstanding all of the argument presented here, there is another strong possibility that something else is causing the melting of the Greenland ice cap. Specifically the melting could be occurring at the base of the ice sheet rather than at the top. If this indeed is the cause, then the global warming arguments simply do not hold any water with regards to the melting. Another possible source for the melting is solar and cosmic radiation. Recently scientists have discovered that the solar radiation during low sun spot activity is actually three times higher than previously thought. So if we have a warming bedrock coupled with increased radiation, the net result should be a loss of ice mass in Greenland and the Antarctic. When you consider the data that indicates the surface temperatures in the Arctic, including Greenland, did not increase significantly between 1950 and 2000, then one can hardly attribute the melting to be the result of man-made CO2 in the atmosphere.
    0 0
  18. The mass loss acceleration from GRACE data appears to be independently confirmed by high precision GPS land uplift measurements in western and southeastern Greenland.Here's the paper (paywalled), here the story reported by ScienceDaily.
    0 0
  19. Neat little example of a model confirmed by a robotic mission, both exploring Pine Island glacier in Antarctica and both tasked with helping to explain why this glacier has been on a speedy wasting trajectory in recent times. The discovery of an underwater mountain ridge could help solve the mystery of why Antarctica's Pine Island glacier is vanishing so rapidly. A robot submarine sent beneath the glacier's floating ice sheet has shown that there is a ridge rising 400 metres from the sea floor. Until recently, the glacier would have rested on this ridge, preventing warm seawater from reaching the ice and melting it from underneath. But the submarine has shown that the glacier no longer rests on the ridge - it has thinned and now floats above it (Nature Geoscience, DOI: 10.1038/ngeo890). ... In January, a modelling study suggested that if such a ridge did exist, then once the glacier retreated behind it, the glacier would not be able to recover. Ice shelf was kept intact by underwater ridge (New Scientist)
    0 0
  20. #19 doug_bostrom at 03:58 AM on 28 June, 2010 why this glacier has been on a speedy wasting trajectory in recent time You fail to mention "recent time" here started more than forty years ago, when global temperatures happened to be on a falling trajectory for a while. NASA Earth Observatory news release, June 20, 2010 New Research Sheds Light on Antarctica's Melting Pine Island Glacier Lead author Dr Adrian Jenkins of British Antarctic Survey said, [...] "We do not know what kick-started the initial retreat from the ridge, but we do know that it started some time prior to 1970"
    0 0
  21. Doug, thanks for alerting us on this paper. It's really a strong confirmation on the role of the grounding line retreat on ice sheet dynamics. It's good news that piece by piece the puzzles is becoming clearer, but bad news that we now know that it won't be easy to stop or even slow down this and similar glaciers.
    0 0
  22. You're right Berényi Péter, this adds a lot to the sensitivity of (at least) this glacier to climate change.
    0 0
  23. Péter, lighten up. Discussion on this site routinely slews over eons, take "recent" for what you will.
    0 0
  24. More on the Pine Island robot mission here, with plentiful nits to pick at. Here are more details of the robot itself and its operations. 5,000(!) D-size batteries sounds on the face of it a questionable choice for power but I suppose grad students had to do the changing. The sub was capable of fully autonomous operation tens of kilometers from the mother ship and -under- the ice. Truly remarkable.
    0 0
  25. I hope those 5000 D cells are rechargeables!
    0 0
  26. I'm a little confused about this sentence: "This means that Greenland's mass loss doubled over the 9 year period." The following is from the Velicogna 2009 abstract (the full paper is paywalled): "[Greenland] mass loss increased from 137 Gt/yr in 2002–2003 to 286 Gt/yr in 2007–2009...." Isn't this more like five or six years than nine?
    0 0
  27. Re: chrisd3 2002, 2003, 2004, 2005, 2006, 2007, 2008, 2009... I make that spanning 7 years of data, by my new-mathy (I actually used my fingers) count. Velicogna refers to it as a 7-year period of data. You're right to query that nine-year interval in the topic of this post. Typo, John? The Yooper
    0 0

You need to be logged in to post a comment. Login via the left margin or if you're new, register here.


The Consensus Project Website

THE ESCALATOR

(free to republish)


© Copyright 2024 John Cook
Home | Translations | About Us | Privacy | Contact Us