Climate Science Glossary

Term Lookup

Enter a term in the search box to find its definition.

Settings

Use the controls in the far right panel to increase or decrease the number of terms automatically displayed (or to completely turn that feature off).

Term Lookup

Settings


All IPCC definitions taken from Climate Change 2007: The Physical Science Basis. Working Group I Contribution to the Fourth Assessment Report of the Intergovernmental Panel on Climate Change, Annex I, Glossary, pp. 941-954. Cambridge University Press.

Home Arguments Software Resources Comments The Consensus Project Translations About Support

Twitter Facebook YouTube Mastodon MeWe

RSS Posts RSS Comments Email Subscribe


Climate's changed before
It's the sun
It's not bad
There is no consensus
It's cooling
Models are unreliable
Temp record is unreliable
Animals and plants can adapt
It hasn't warmed since 1998
Antarctica is gaining ice
View All Arguments...


Username
Password
New? Register here
Forgot your password?

Latest Posts

Archives

How much is sea level rising?

What the science says...

Select a level... Basic Intermediate

A variety of different measurements find steadily rising sea levels over the past century.

Climate Myth...

Sea level rise is exaggerated

"We are told sea level is rising and will soon swamp all of our cities. Everybody knows that the Pacific island of Tuvalu is sinking. ...

Around 1990 it became obvious the local tide-gauge did not agree - there was no evidence of 'sinking.' So scientists at Flinders University, Adelaide, set up new, modern, tide-gauges in 12 Pacific islands.

Recently, the whole project was abandoned as there was no sign of a change in sea level at any of the 12 islands for the past 16 years." Vincent Gray).

At a glance

You'd think it would be obvious, wouldn't you? If ice (or snow) melts, you get water. Water flows downhill through gravity and collects wherever it can be retained. In areas that see regular winter snowfalls, the processes involved are familiar. Snow-capped mountains look photogenic but along comes the eventual thaw and the river levels rise sharply with all the meltwater.

Now apply the same basic principles to glaciers and ice-caps. It should not come as a surprise that exactly the same thing happens and where that meltwater collects is ultimately the oceans. Note here that we're talking about land-based ice, not sea-ice: sea-ice is already part of the ocean so does not affect sea levels as it forms and melts every year. But melt enough land-ice and you get very significant change indeed.

What do we mean by very significant? Well, let's look at the transition out of the last ice-age that dominated the last 20,000 years. It began with ice-caps over parts of Europe and North America and ended not so long ago with much of that ice gone but with sea levels having risen by more than 120 metres. If that's not significant, what is?

There's not enough ice left on Earth to raise sea levels by that whopping amount now, but there is enough to raise the oceans by more than 60 metres. Over what sort of time-frame? Well, we know that the current rate of sea level rise is some 3.7 mm a year, or nearly an inch and a half per decade. A lot of that is due to the expansion of the oceans - as things are warmed up they expand. But the rate is accelerating. How fast do we think it can get? 

We do have the past to consider: during the glacial meltdown of the past 20,000 years, there was a period ominously named Meltwater Pulse 1A that began some 14,700 years ago. During this enhanced period of melting, sea levels rose by between 16 and 25 metres in about 400–500 years. That's roughly 40–60 mm per year or 16-23 inches a decade.

Could such drastic rates of sea level rise happen again? Probably not but nevertheless it shows what is possible as ice-sheets collapse in a warming world. But even if sea level rise stays at its current rate (it won't), that's getting on for a two-metre increase over the coming 300 years and a one-half to one-metre increase over the next 100 years. Now go anywhere affected by tides and think about all the communities of people that live and work along the shore. Pick the biggest spring tides, take a look at where they reach at high water, maybe watch the waves and surge when a storm occurs, then imagine an extra two metres of water on top of that.

And try to imagine being the decision-makers in the coming decades and centuries, who will have to work out what best to do. What would you think of the people all those years ago, who went around pretending this was not happening? Not favourably, for sure - because of such behaviour, that is how history will remember them.

Please use this form to provide feedback about this new "At a glance" section. Read a more technical version below or dig deeper via the tabs above!


Further details

The climate myth set out in the coloured box above gives an insight into the minds of climate change deniers. Why? Because it's entirely made-up. It annoyed the Realclimate blog's Gavin Schmidt sufficiently for him to write an eloquent debunking in 2012 that is well worth reading because it demonstrates so clearly what we, the scientific community, are up against.

The claim that tide gauges on islands in the Pacific Ocean show no sea level rise is nonsense: the data presented in the Realclimate link above show a variably rising sea level trend at each station. But what about global sea level rise?

Sea level rises as ice on land melts and as warming ocean waters expand. As well as being an existential threat to coastal habitation and environments (think about many of the world's capital cities here), sea level rise corroborates other evidence of global warming 

The black line in the graph below (fig. 1) clearly shows sea level is rising; its upward curve shows how sea level is rising faster as time goes on. The upward curve agrees with global temperature trends and with the accelerating melting of ice in Greenland and other places.

Because sea level behaviour is such an important signal for tracking climate change, the misinformers seized on the sea level record in an effort to cast doubt on this evidence. As fig. 1 clearly demonstrates, sea level bounces up and down slightly from year to year so it's possible to cherry-pick data and falsely suggest the overall trend is flat, falling or linear. You can try this yourself. Starting with two closely spaced data points on the graph below, lay a straight-edge between them and notice how for a short period of time you can create almost any slope you prefer, simply by being selective about what data points you use. Now choose data points farther apart. Notice that as your selected data points cover more time, the more your mini-graph reflects the big picture. The lesson? Always look at all the data rather than being fooled by selective presentations.

AR6 WGI Chapter 2 Figure 2_28c

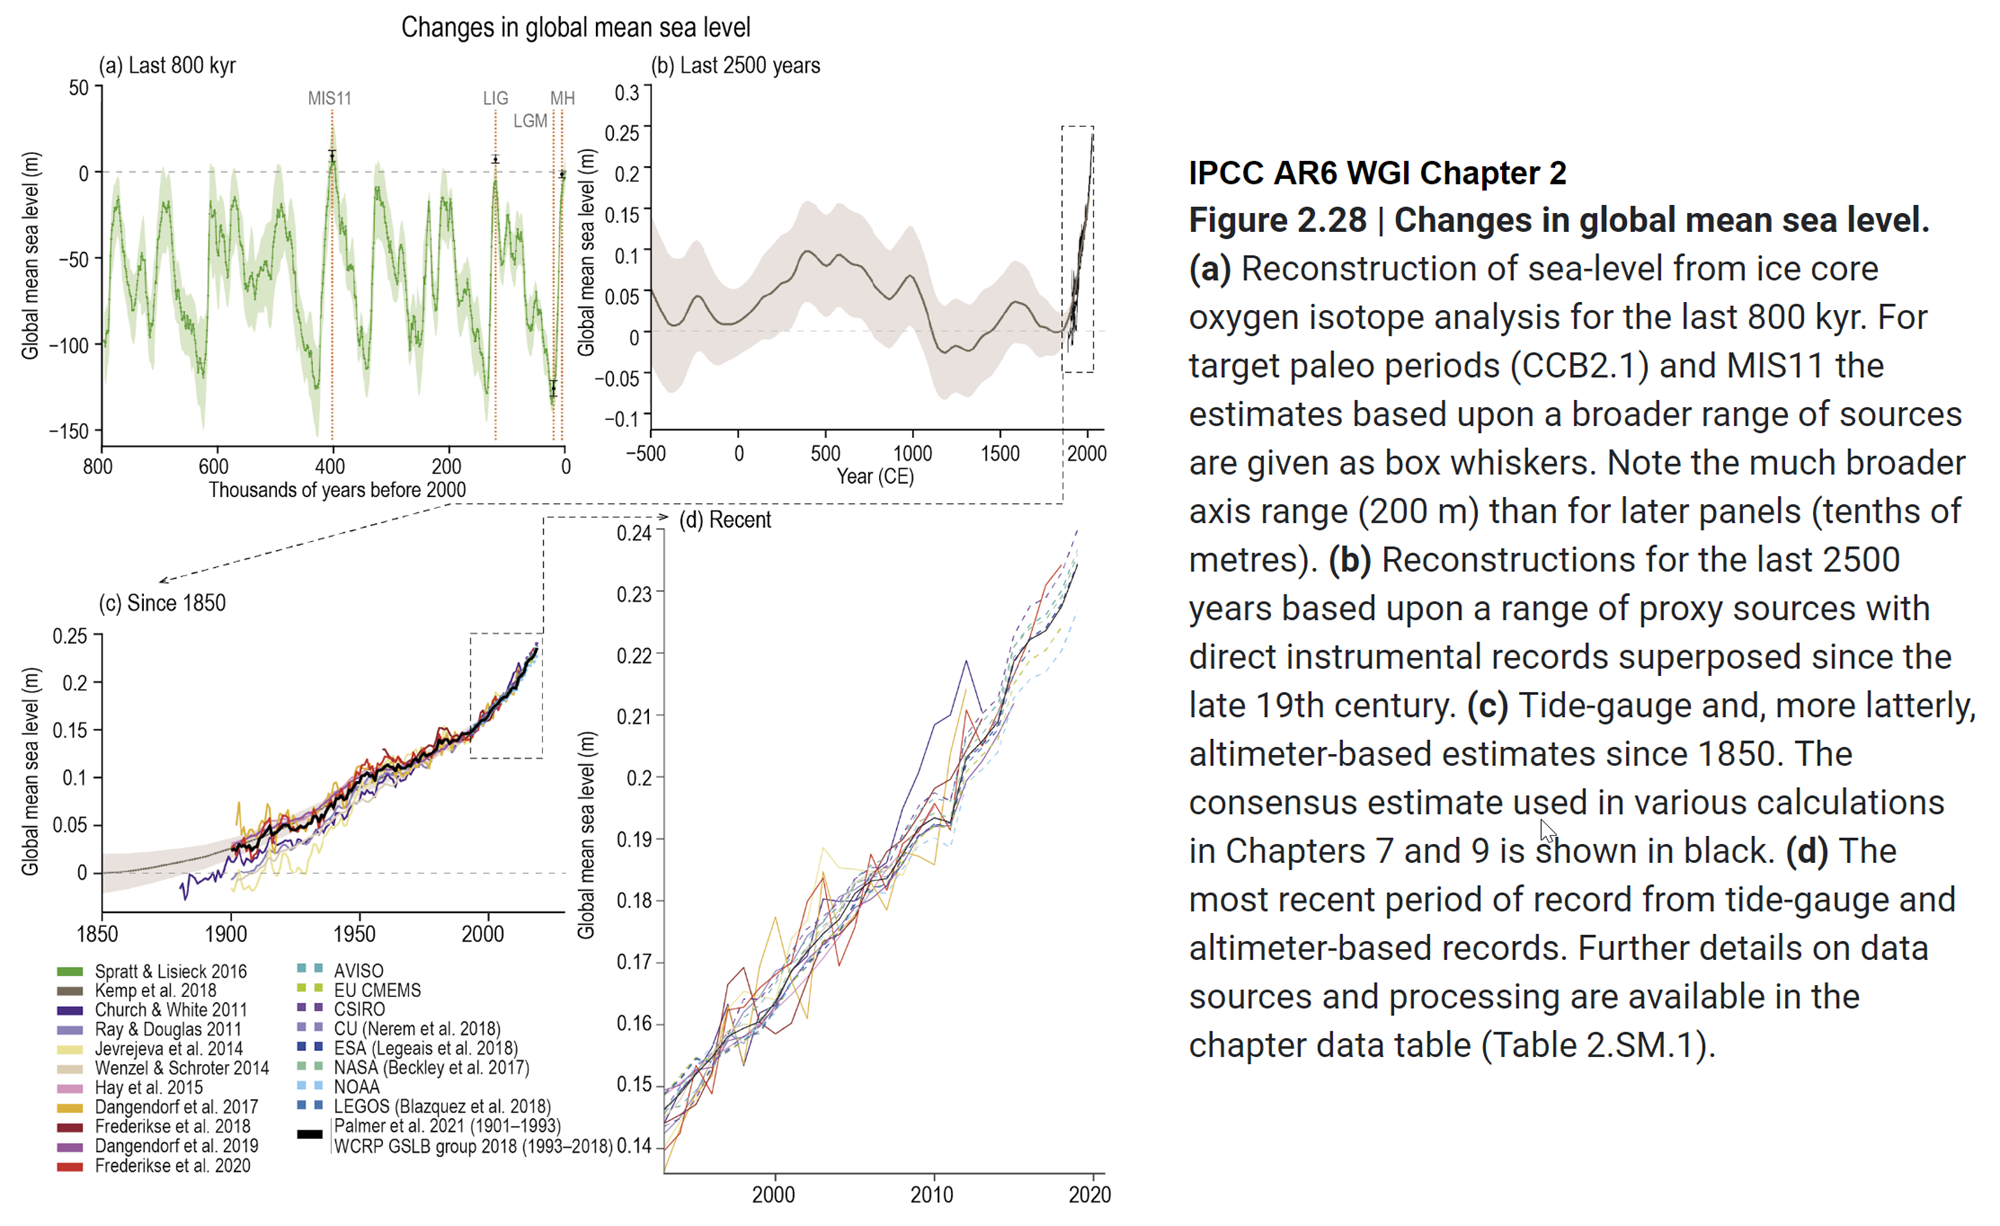
Fig. 1: sea level change, from IPCC AR6 WGI Chapter 2 section Climate Change 2021: The Physical Science Basis. Tide-gauge and, more latterly, altimeter-based estimates since 1850. The full image with all four panels and IPCC caption is available here.

Other denialist arguments about sea level concern the validity of observations, obtained via tide gauges and more recently satellite altimeter observations.

Tide gauges must take into account changes in the height of land itself caused by local geological processes, a favourite distraction for deniers to highlight. It will come as no surprise to learn that scientists measuring sea level with tide gauges are aware of - and compensate for - these factors. Confounding influences are accounted for in measurements and while they leave some noise in the record they cannot account for the observed long-term upward trend.

Various technical criticisms are mounted against satellite altimeter measurements by deniers. Indeed, deriving millimetre-level accuracy from orbit is a stunning technical feat so it's not hard to understand why some people find such an accomplishment unbelievable. It's astonishing that in another breath they are happy to jump aboard an airliner, parts of which are engineered to a similar tolerance!

In reality, researchers demonstrate this height measurement technique's accuracy to be within 1 mm/year. Most importantly there is no form of residual error that could falsely produce the upward trend in observations. 

As can be seen in an inset of the graph in fig. 1, tide gauge and satellite altimeter measurements track each other with remarkable similarity. These two independent systems mutually support the observed trend in sea level. If an argument depends on skipping certain observations or emphasises uncertainty while ignoring an obvious trend, that's a clue you're being steered as opposed to informed. Don't be misled by only a carefully-selected portion of the available evidence being disclosed. Look at it all.

Current sea level rise is not exaggerated, in fact the opposite case is more plausible. For one, sea level rise is not the same everywhere. Many areas around the world already experience much faster rates of sea level rise than the average global rate shown in Fig 1.  As well, observational data and changing conditions in such places as Greenland suggest if there's a real problem here it's underestimation of future sea level rise. Past IPCC synthesis reports offered rather conservative projections of sea level increase based on assumptions about future behaviour of ice sheets and glaciers, leading to estimates of sea level roughly following a linear upward trend mimicking that of recent decades. In point of fact, observed sea level rise is already above older IPCC projections - and accelerating - while at the same time it appears the mass balance of continental ice once envisioned by the IPCC was overly optimistic (Rahmstorf 2010; Otosaka et al. 2023).

Fast-forward to 2023 and the recent IPCC AR6 Synthesis Report is a bit less nuanced:

Limiting global surface temperature does not prevent continued changes in climate system components that have multi-decadal or longer timescales of response (high confidence). Sea level rise is unavoidable for centuries to millennia due to continuing deep ocean warming and ice sheet melt, and sea levels will remain elevated for thousands of years (high confidence). However, deep, rapid and sustained GHG emissions reductions would limit further sea level rise acceleration and projected long-term sea level rise commitment. Relative to 1995–2014, the likely global mean sea level rise under the SSP1-1.9 GHG emissions scenario is 0.15–0.23 m by 2050 and 0.28–0.55 m by 2100; while for the SSP5-8.5 GHG emissions scenario it is 0.20–0.29 m by 2050 and 0.63–1.01 m by 2100 (medium confidence).

The report goes on to state, however:

The probability of low-likelihood outcomes associated with potentially very large impacts increases with higher global warming levels (high confidence). Due to deep uncertainty linked to ice-sheet processes, global mean sea level rise above the likely range – approaching 2 m by 2100 and in excess of 15 m by 2300 under the very high GHG emissions scenario (SSP5-8.5) (low confidence) – cannot be excluded.

If they cannot exclude such risks - and they know what they are talking about - can you?

Last updated on 20 August 2023 by John Mason. View Archives

Printable Version  |  Offline PDF Version  |  Link to this page

Argument Feedback

Please use this form to let us know about suggested updates to this rebuttal.

Further viewing

From Peter Hadfield (potholer54 on YouTube) published on Dec 5, 2021

Compare two photos 130 years apart and it looks as though sea levels haven't moved. So why all the fuss about rising sea levels and evacuating islands? This video closes the yawning gap between internet myths and science.


From Peter Sinclair (greenman3610 on YouTube) published on Sep 24, 2009

Denial101x lecture

Comments

1  2  3  4  5  6  7  8  9  10  11  12  13  Next

Comments 1 to 25 out of 323:

  1. In an interview with Dr. Nils-Axel Mörner (head of the Paleogeophysics and Geodynamics department at Stockholm University in Sweden, past president (1999-2003) of the INQUA Commission on Sea Level Changes and Coastal Evolution, and leader of the Maldives Sea Level Project – he has been studying the sea level and its effects on coastal areas for some 35 years) by EIR (Argentine Foundation for a Scientific Ecology) [http://www.mitosyfraudes.org/Calen7/MornerEng.html] he talked about the IPCC misrepresentation of sea level data: “Then, in 2003, the same data set, which in their [IPCC's] publications,... was a straight line—suddenly it changed, and showed a very strong line of uplift, 2.3 mm per year, the same as from the tide gauge... It was the original one which they had suddenly twisted up, because they entered a “correction factor,” ... I accused them of this at the Academy of Sciences in Moscow —I said you have introduced factors from outside; it's not a measurement. It looks like it is measured from the satellite, but you don't say what really happened. And they answered, that we had to do it, because otherwise we would not have gotten any trend! That is terrible! As a matter of fact, it is a falsification of the data set. ... So all this talk that sea level is rising, this stems from the computer modeling, not from observations. The observations don't find it! I have been the expert reviewer for the IPCC, both in 2000 and last year. The first time I read it, I was exceptionally surprised.
  2. A recent ( June 2009 ) scientific paper by Cliff Ollier of the School of Earth and Environment, The University of Western Australia, states as follows : Abstract: Graphs of sea level for twelve locations in the southwest Pacific show stable sea level for about ten years over the region. The data are compared with results from elsewhere, all of which suggest that any rise of global sea level is negligible. The Darwin theory of coral formation, and subsidence ideas for guyots would suggest that we should see more land subsidence, and apparent sea level rise, than is actually occurring. Sea level studies have not been carried out for very long, but they can indicate major tectonic components such as isostatic rebound in Scandinavia. Attempts to manipulate the data by modelling to show alarming rates of sea level rise (associated with alleged global warming) are not supported by primary regional or global data. Even those places frequently said to be in grave danger of drowning, such as the Maldives.
  3. I got into an argument about sea level rise as an indicator of climate change and was told that all recent rise could be attributed to increased sedimentation rates. Whilst I expressed doubts that, given the global ocean surface area, it could affect overall sea levels that much I had to concede that a lot of river mouths and bays are being affected by both silt from erosion and from deliberate infilling to create waterfront building sites. Locally both can be quite extensive. I have struggled to find quantification of human induced sedimentation and infilling; if anyone can link to something that a layperson such as myself can view and provide some perspective on rates relative to sea level rise I would appreciate it. Thanks, Ken.
  4. Ken in Oz, as far as i can remember, sediment deposition is historically of the order of a few GTons, or a percent of current ice sheet loss. Negligible. Also, the sedimentation rate is on the decline due to the more and more dams that are bilt. I'd like to see where your friends got the numbers that explain sea level rise with sedimentation, i never heard about it.
  5. Riccardo, I'm not sure I really want to see where he got the argument and suspect it's not an argument based on any numbers; rather, it's an argument that appeals to something that sounds credible only as long as numbers are absent. Which is why I'd like to see some.
  6. Re: 1 & 2 - I can't find much on Morner other than his Wiki page which suggests his work was often cited and though now seemingly discredited he must have once been a leading authority on sea level rises or the lack of them. He certainly claimed to be the best in the world in the external links to interviews from Wiki in which he rages about the IPCC bringing in modellers rather than sea-level experts.
  7. Can I point out that your statement about rising sea level is false? B. F. Chao, Y. H. Yu, and Y. S. Li (Science, 320:212-214) have shown that sea level rise for the last eighty years has been linear, with a slope of 2.46 millimeters per year. Theirs is the sea level that has been corrected for the effect of water held in storage by all dams built since the year 1900. Something that has been linear this long is not likely to change anytime soon. Which means that you can be a futurist and predict that sea level will rise a little under ten inches in a century, not twenty feet that Al Gore is still peddling in his movie.
    Response: Arno, thanks for bringing our attention to that paper which actually shows that the situation is worse than I described. The paper is Impact of Artificial Reservoir Water Impoundment on Global Sea Level (Chao 2008). It reconstructs how much water has been impounded in water reservoirs since 1900. The amount of water stored skyrocketed after 1950. If this hadn't occured, sea level would've been even greater. Consequently, they calculate what global sea level should be after accounting for reservoir impoundment water. They then compare their results to actual observed sea level:


    What they find is the increase in the rate of sea level rise is actually greater when you factor in water impoundment. This increases the significance of retreating ice sheets. A sobering result, considering the accelerating ice loss from Antarctica and Greenland.
  8. Arno Arrak, we all know that Al Gore didn't quote any time span for the 20 feet rise. We all also know for sure that the sea level will not stabilze by the end of this century. Comparing Al Gores number with a one century rise is (intentionally?) misleading.
  9. I did not realize that you had posted a comment to my comment until now. I want to emphasize that factoring in water impoundment gives the true rate of sea level rise that would exist if no water were impounded. I don't know why you bring in the other curves especially since the slope, and hence the predicted rate or rise, is essentially the same. And none of this has any significance whatsoever on the fate of retreating ice sheets. That is a totally different issue and depends upon the causes of arctic warming. In the case of the Antarctic the West Antarctic ice sheet is melting because it is being undermined by warm water rising up from below in the Amundsen Sea. This is because prevailing winds are from land to sea and blow away the cold surface water which is then replaced by warmer Antarctic bottom water. It has collapsed before, most recently 1500 years ago, and may collapse again if this keeps up. In the Arctic we are now in the middle of more than a century long warming period that started abruptly at the start of the twentieth century. This abrupt beginning rules out any greenhouse effect as its cause and indicates that a rearrangement of North Atlantic current system that directed warm water to the north took place at the turn of the century. Since we know that the Gulf stream now brings warm water to the Arctic it is likely that it assumed its present northerly course at that time. It is futile to try to predict any of this from computer models using the old carbon dioxide global warming paradigm. They produce nothing but GIGO.
  10. Neil, I don't wish to be unkind to Dr. Mörner, just want to point out what he says elsewhere in that interview as a bit of a reality check. I'm not sure what exactly the situation with him is, but quite clearly this is wrong: "Always the same thing: In about 1970, the sea fell about 20 cm, for reasons involving probably evaporation or something. Not a change in volume or something like that- it was a rapid thing. The new level, which has been stable, has not changed in the last 35 years. You can trace it so very, very carefully. No rise at all is the answer there." Much of the rest of the piece consists of accusations of lies, coverups, falsifications, too much to be believable. It's actually pretty sad, and I say that with sincerity. Sometimes you need to look at a narrative in sum and ask yourself, how -likely- is this? If I'm confronted with one man's word against hundreds and there is coherent consistency between what those many say that is completely inconsistent with the beliefs of the lone individual, I'm afraid I'm not going to believe him. There are just too many eye-popping anecdotes in Dr. Mörner's story to hold water.
  11. doug_bostrom #10 Back to my analogy with Galileo. Science is not a matter of votes. Politics is... in a democratic society of course. Thus your argument of "one man's word against hundreds" is, on the face of it, inconsistent with your statement earlier today that you did not want to follow me in the "wilderness", which I assumed was the wilderness of human psyche of which politics is the direct result.
  12. In #10 doug_bostrom hands us a quote from Dr Mörner, where he appears to be talking about a sudden (impossible) 20 cm fall of the sea level in 1970. Actually he is at the time talking about local changes in the Venice area, not about general sea level. It is, I think, misleading and dishonest to use a quote in this way. Also, it is not 'one man's word against hundreds'. He tells us that he was shocked, as an IPCC reviewer in 1999, to see the chapter on sea level in a forth-coming report. The chapter was written by 33 authors, and not a single one was a sea level specialist! He brought the report up in subsequent meetings in INQUA, where 300-400 experts on sea levels talked it over, and agreed that it was faulty. So it is more like hundreds of experts against 33 amateurs...
  13. Argus at 03:08 AM on 4 March 2010 Actually the bit I referred to was in connection with Tuvalu. But I could have been more clear. Here's what I should have said more explicitly: It is questionable for Dr. Mörner to cite what is clearly a local drop in sea level, a change unconnected with events elsewhere, in connection with a general argument that global sea level is not subject to change due to AGW.
  14. Maybe we have heard different interviews. Anyway, I listened to a one-hour telephone (I think) interview on the site: http://itsrainmakingtime.com/2010/nilsaxelmorner/ At about 33 minutes nto the recording he talks for only a minute or so about Venice specifically, mentioning the long range of measurements available. He did not use the temporary drop as an argument. He is also generally very clear about how you must separate local changes (both going up and down), around the world's coast lines, from overall changes in the oceans. He sounds very credible and knowledgeable to me.
  15. Argus at 05:07 AM on 4 March, 2010 Ah, you're right, different interviews. Here's what I referred to: http://www.climatechangefacts.info/ClimateChangeDocuments/NilsAxelMornerinterview.pdf In this interview, Dr. Mörner makes a lot of accusations, statements that seem reckless and would not pass muster via this site's moderation policy. Beyond that, I find the sheer amount of falsity and misconduct Dr. Mörner claims he sees to be unlikely. Dr. Mörner has a distinguished publication record in his field, yet he's sneeringly dismissive of researchers working with methods he's not accustomed to using. I'll hazard a guess about why he's so upset about this matter and sees what can only be described as a fairly vast conspiracy among other scientists. Dr. Mörner is a geologist who likes getting up to his elbows in actual material things out in the field, no bad thing. But as well, he appears to have a fundamental mistrust of numerical methods he believes are "sophisticated" in the pejorative sense of the word. He's not comfortable with remote sensing and he's not comfortable with abstractions. As an example of how Dr. Mörner's seeming lack of insight into disciplines he does not appear to understand leads him into the weeds, he summarizes research conclusions about Greenland's ice volume trend as "falsification." For me, that's where his credibility on this matter flatlines; referring to the already large and growing body of research into Greenland's ice volume condition as "falsification" is not a persuasive argument.
  16. Speaks for itself! "These new results indicate that relative sea levels in New Zealand have been rising at an average rate of 1.6 mm/yr over the last 100 years - a figure that is not only within the error bounds of the original determination, but when corrected for glacial-isostatic effects has a high level of coherency with other regional and global sea level rise determinations. There continues to be no evidence of any acceleration in relative sea levels over the record period." http://www.agu.org/pubs/crossref/2004/2003GL019166.shtml
  17. On the other hand: "Sea levels in New Zealand have remained relatively stable throughout the past 7000 years, but salt-marsh cores from southern New Zealand show evidence of a recent rapid rise. To date and quantify this rise we present a proxy sea-level record spanning the past 500 years for Pounawea, southeastern New Zealand, based on foraminiferal analyses. Ages for ten sea-level index points are established from AMS14C, Pb concentrations, stable Pb isotopes, pollen markers, charcoal concentrations and 137Cs. Sea level was rising slowly (0.3 ± 0.3 mm yr−1) from AD 1500 to AD 1900, but during the 20th century the rate increased to 2.8 ± 0.5 mm yr−1, in agreement with instrumental measurements commencing in 1924. This is the first sea-level record from the southern hemisphere showing a significantly higher rate of sea-level rise during the 20th century as compared with preceding centuries." A 20th century acceleration of sea-level rise in New Zealand Found in list of articles citing the Hannah article cited by butareyousure...
    Response: Just letting you know I've added a new argument "New Zealand sea level is not accelerating" along with the two peer-reviewed links from these last two comments. Good to have these papers at our fingertips for future reference.
  18. I feel I am getting mixed messages from the AGW community. On one hand Sea level has been rising since the 1800's which is caused by anthropogenic emissions warming the planet. On the other hand melting rates for Arctic sea Ice and increases in the global mean temperature anomaly have only risen from "normal" or "naturally caused" levels since the mid 70's. Please clarify when exactly AGW was supposed to have had an effect or why these factors should be so vastly seperated in time.
  19. Daniel you'd need to do some ferreting on your own to develop confidence in the idea but the time disparity in response you note is likely down to the fact that sea level rise is due not only to addition of water from melting ice but also significantly to thermal expansion of the sea itself. The world ocean has been quite efficiently absorbing "excess" retained heat and thus expanding in a noticeable way during the entire period in question while up here in the air the temperature has only more recently risen sufficiently to begin carving into terrestrial ice in a significant way, this in part because the ocean is indeed such a capacious sponge for warmth. There's a helpful primer on thermally-induced sea level rise here. There is an up-to-date and truly excellent discussion of sea level rise here* with a cornucopia of background information including some treatment of the lag of ice response versus ocean expansion. *Global sea level linked to global temperature Martin Vermeera, Stefan Rahmstorf 2009
  20. I know this is a bit late in the day but considering the nature of this site I thought it would be worthwhile to make a comment. Scientists from Flinders University, Adelaide, certainly DID NOT abandon the project. The following statement comes from their financial statement for 2003. "In 2003 the University decided to cease the operations of the National Tidal Facility Australia (NTFA). The NTFA fulfils an important national role as it specialises in tidal predictions, sea level monitoring and contemporary marine science issues. However as it is not involved in the University’s core teaching and research activities, it was decided that it is more appropriate for the services to be provided by the Commonwealth Government. The operation was transferred to the Commonwealth Government effective from 1 January 2004." It is possible to access their latest results on the Australian Bureau of Meteorology website at the web page for the South Pacific Sea Level and Climate Monitoring Project. These results support the general rate of global sea level rise noted elsewhere.
  21. To doug-bostrom post # 19 Sorry it has taken me a month to get back to you doug. You're links were a little hard to follow to be honest and I will say that it is probably because they are lengthy wafflings about how we can test the outputs of a simple two term equation to a "simulated" millenial scale model and recent sea level observations. We all know that water expands when heated and although there may be some credibility issues with the global temperature record of the last 200 years we can safely assume that things have warmed a bit since the LIA and that the sea level may have responded. The question is, just like the temp record, is it unprecedented? Rather then spend time reading how the two term equation predicts future sea levels I decided to turn my attention instead to the papers cited by the above article. The article claims that skeptics are guilty of interpreting small recent trends from noisy data as significant. Here's a quote: "The lesson from this is to treat with skepticism anyone who concludes long term trends from several years of a noisy signal (after all, skepticism should cut both ways)" Yes indeed it does cut both ways. What the author of this article doesn't realise is that the two papers cited for paleo sea levels make the mistake of claiming an unprecedented rapid sea level rise from very noisy data. The Donnely paper, on the reconstruction of SLR at Barn Island Connecticut, on it's own is simply an utter joke. 10 or so paleo samples with quite large height and age uncertainties are used to construct a linear 1mm/year sea level trend over 1300-1850 A.D. There is more than enough slack in this data to periodically reproduce the apparently rapid sea level rise of 2.8mm/year in the NYC tide gauge data of the last ~150 years (cited and compared to by the authors). The Gehrels paper I would say is a much more commendable attempt at reconstructing sea levels off the west Icelandic coast. The low resolution issue is adressed but the uncertainty issue does not disappear. Height and age error estimates again provide more than enough slack to allow the reproducuction of the modern rates of sea level rise. The authors fail to discuss the suspicious nature of the sudden and relatively linear increase in sea level reconstruction at ~ 1800 A.D. which also marks the point at which the age of the reconstruction is measured by Pb and Cs isotopic ratios and paleo-magnetism rather than the seemingly much less certain C14 analysis. As I have mentioned elsewhere on this website (see "There is no concensus" argument page) the claim that "experts" of climate science have a more credible opinion on this issue is highly insulting to scientists from other fields. Scientists who after having found the time and inclination to review the data of climate scientists are utterly apalled at the conclusions drawn.
  22. Dan, rhetorical laughter is not a persuasive argument. You need to undo some statistics in sufficient detail to show how the measurement uncertainty reported by Donnelly is in error: This 700-year record from Barn Island provides a SLR estimate free of vertical displacement due to autocompaction of the peat column. A linear rate of rise of 1.0 ± 0.2 mm/year intersects all the 2s uncertainty boxes of the record from the 14th to the mid-19th century (Figure 2). Linear regression of the NYC tide-gauge data reveals an average rate of SLR of 2.8 mm/year from 1856–2001 A.D. Why don't you attack the Donnelly paper in detail? Until you do so your credibility does not seem equal to that of the authors you're critiquing.
  23. Doug, it's simple, look at the graph. A claim of a linear trend is made with 10 data points of clearly very high uncertainties. The recent trend which is of much shorter length in time but of higher resolution and certainty is then tacked on the end and the claim is made that a recent rapid rise in sea level is observed. Any bachelor degree graduate can see that it is not a valid conclusion from the data. The error estimates give us the level of uncertainty, the boundaries within which the true paleo-sea level may reside at a given level of statistical confidence. Do you belive it is valid to say that the sea level did not deviate significantly from the proposed linear trend during this period? It's not my credibility that's at stake here doug, look in the mirror.
  24. "Look in the mirror?" Calm down, Daniel, remember I'm neither the author of the paper nor the person doing a casual critique of methods without resort to quantitative treatment such as that done by the authors being critiqued. Do the work in detail necessary to show the paper's statistical treatment is undependable and don't imagine that sarcastic remarks are a useful substitute.
  25. neilperth at 14:02 PM on 7 October, 2009 Forgive the late entry here, not wishing to push my own efforts, but many of the sea level rise issues were also discussed here recently. I suggest you read the up to date references and review articles as I took some time assembling them (and have gained few more since). A lot has happened in the past ten years, for example routine precision vertical reference station values from GPS and greatly improved estimates of isostatic rebound and crustal movements, as well as better and more satellite data from several satellites. With reference to your comments about the IPCC, to see what the sea level measuring community is currently saying look at the GLOSS documents and please, read the references. daniel at 22:03 PM on 26 June, 2010 References to the any recent "downturn" in sea level rise are already out of date. The charts above have been updated with latest satellite data including JASON2 and Envisat, see link above.

1  2  3  4  5  6  7  8  9  10  11  12  13  Next

Post a Comment

Political, off-topic or ad hominem comments will be deleted. Comments Policy...

You need to be logged in to post a comment. Login via the left margin or if you're new, register here.

Link to this page


The Consensus Project Website

THE ESCALATOR

(free to republish)


© Copyright 2024 John Cook
Home | Translations | About Us | Privacy | Contact Us