Climate Science Glossary

Term Lookup

Enter a term in the search box to find its definition.

Settings

Use the controls in the far right panel to increase or decrease the number of terms automatically displayed (or to completely turn that feature off).

Term Lookup

Settings


All IPCC definitions taken from Climate Change 2007: The Physical Science Basis. Working Group I Contribution to the Fourth Assessment Report of the Intergovernmental Panel on Climate Change, Annex I, Glossary, pp. 941-954. Cambridge University Press.

Home Arguments Software Resources Comments The Consensus Project Translations About Support

Twitter Facebook YouTube Mastodon MeWe

RSS Posts RSS Comments Email Subscribe


Climate's changed before
It's the sun
It's not bad
There is no consensus
It's cooling
Models are unreliable
Temp record is unreliable
Animals and plants can adapt
It hasn't warmed since 1998
Antarctica is gaining ice
View All Arguments...


Username
Password
New? Register here
Forgot your password?

Latest Posts

Archives

Visual depictions of Sea Level Rise

Posted on 3 March 2010 by Peter Hogarth

Guest post by Peter Hogarth

Even many critics would agree that global sea levels are currently rising, regardless of recent scrutiny and revision of estimates of predicted sea level rise. As pointed out previously, predicting sea level rise is tough. The National Oceanic and Atmospheric Administration (NOAA) puts it neatly, “To make predictions, we need knowledge. To gain knowledge we need observations”. However a recent claim disputes that current sea levels are rising significantly. Is it possible to verify or falsify this statement by looking at observations and data from the scientific community concerned with measuring sea level?

The answer is yes. Measuring sea level is now a multidisciplinary effort involving integration of observations from several global networks of hundreds of tidal stations, calibrated with vertical reference data from nearby GPS (Global Positioning System, which now use the American GPS, Russian GLONASS and European Galileo constellations of satellites) or DORIS (Doppler Orbitography Integrated by Satellite) stations, and data from several independent satellite based radar altimeters (recently Jason I, Jason II, and Envisat) which give complete global coverage, data on sea temperature and pressure from the ARGO floating sensors (which give information on temperature and salinity related variations in Oceanic volume), and most recently data from the satellite based gravity sensor GRACE (Gravity Recovery And Climate Experiment), which can give direct measurements of changes in mass of oceanic and land based water.

A 2009 review by Merrifield et al of the GLOSS (Global Sea Level Observing System) gives some indication of the large number and variety of organizations and workers involved. These measurements are complementary as well as providing independent cross validation checks on any individual data set, and many teams independently process raw observations to derive sea level data. This has enormously improved our knowledge of estimated sea level rise at global and regional level over the past 20 years, with continual refinements of estimates, as well as reductions in uncertainties from the centimetric level to sub mm level.

What are the conclusions from these efforts? Recent reviews (Cazenave et al 2009, Cazenave and Llovel 2010) show that the most up to date estimates of mean rate of sea level rise for the 20th century are converging on around 1.7 to 1.8mm/year, with uncertainties of around 0.2 to 0.3mm. (Ablain 2009, Church 2008, Engelhart 2009, Jevrejeva 2008, Leulette 2009, Merrifield 2009, Woppelmann 2009). The small differences between reported figures are mainly due to the different Glacial-Isostatic Adjustment (GIA) model or GPS based corrections that are used for the tidal stations, and extrapolating current knowledge of these vertical velocity corrections backwards to before the absolute GPS corrected data was available.


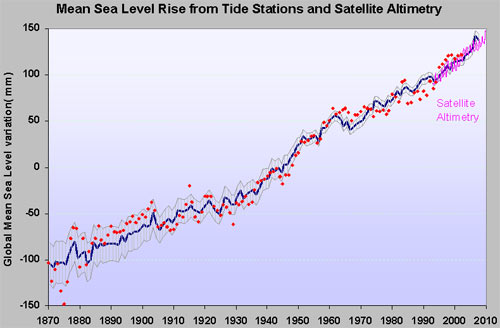
Figure 1: Global corrected tidal station data (Church 2006 updated to 2009-dark blue, and Jevrejeva 2008- red)

Most recently, corrected tidal station data from the satellite altimeter period of 1993 to 2010 is in good agreement (within the error budget) with the satellite altimeter data, which gives 3.3mm/year ±0.4mm once GIA corrections are added. These values are considered “robust”. The overall message is clear. Sea levels are rising.


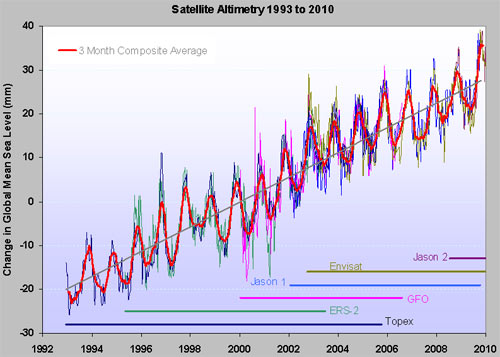
Figure 2: Data from all satellite altimeters and 3 month composite average. The seasonal variations have been retained (trend 2.83mm/year, GIA correction would add another 0.2 to 0.5mm/yr)

Both tidal station data and altimeter data show decadal and shorter term variations in the rate of rise, but there is a significant weight of evidence of a recent acceleration in rate of sea level rise towards the end of the last century (Jevrejeva 2008, Merrifield 2009, Vermeer 2009), whilst the “slowing down” reported by some observers (around 2008) has proved short lived (judging from 2009/2010 data).

It has also now become possible to attempt to “close” the sea level budget, which has components of reported thermal expansion of the volume of water due to increase in accumulated heat energy, and also an increased component from melting ice from land based sources. Again refinements and corrections of recent datasets from GRACE (with GPS) and ARGO resolve previous and relatively recent difficulties, so that the sum of these climate-related contributions (2.85 ± 0.35 mm per year) is now comparable with the altimetry-based sea level rise (3.3 ± 0.4 mm per year) over the 1993 to 2007 period (Cazenave 2010, reporting a consensus of the Ocean Observing Community).

Using these datasets it is estimated that around 30% of the observed rate of rise over the satellite altimeter time period is due to ocean thermal expansion and 55% results from accumulated melting land ice. There is evidence that the land ice melt contribution has increased significantly over the past five years.

The Satellite altimetry data is also truly global in extent, allowing estimates of recent sea level rise to be made for open ocean or areas not served by calibrated tide gauges. The distribution of higher than average historical rises (up to 10mm/year) in sea level reported from many tidal stations, whilst other tidal stations consistently reported reductions in sea level, is verified by the altimetry data, but a much more complete and complex picture emerges, of dynamic changes of sea level and local regions of high and low average sea level rise.


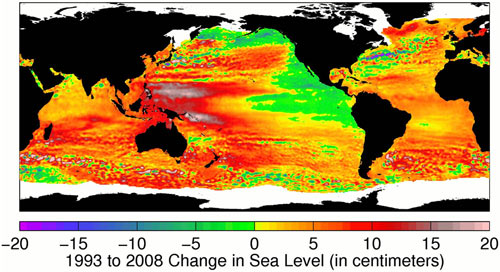
Figure 3: Sea level changes between 1993 and 2008 from TOPEX/Poseidon, Jason-1 and Jason-2 satellite altimeters. The oceans are colour coded for changes in mean sea level. Yellow and red regions show rising sea level, while green and blue regions show falling sea level. White regions are missing data during parts of the year. On average the global sea level is rising, but complex regional variations are superimposed on this. Credit: Data products from Ssalto/Duacs, distributed by Aviso, with support from CNES.

The correlation with variations in Sea Surface Temperature and also with PDO, NAO, El Nino and La Nina events is marked, and the influence of Westerly equatorial ocean currents and other currents and prevailing wind systems is also apparent. At a glance this confirms and explains for example the discrepancy between data from tidal stations on the Western and Eastern Coast of the United States and the fact that even GIA corrected data from Alaska shows local reductions in sea level over much of the record. This answers a point many observers make such as "why has my local sea level not shown an increase?"

The dynamic nature of sea level variations can be best visualised by time sequence animations of the Topex, Jason I and Jason II global data sets (NOAA Laboratory for Satellite Altimetry).

The following shows 3-D sea level variations with colours representing sea surface temperatures during the El Nino over 1997 to 1998 (NASA/Goddard Space Flight Center Scientific Visualization Studio).

These yearly rates of sea level rise may appear small compared with daily tidal variations of up to 8m (eg - Bay of Fundy) or even the average wave height in open waters(!). However, while the steady and gradually accelerating increase since pre-industrial times of around 30cm or a foot may appear manageable, if the recent trend of accelerating mass loss from Greenland and Antarctic Ice caps, as well as the world's glaciers continues, then the potential sea level rises will have significant impact on humanity. The weight of peer-reviewed evidence for this acceleration in sea level rise is robust.

0 0

Printable Version  |  Link to this page

Comments

1  2  Next

Comments 1 to 50 out of 93:

  1. Another excellent article, thank you to Dr Hogarth and John Cook. I particularly appreciate the explanation of how data is collected, as well as the charts and videos. The NASA 3D view of sea level with El Nino is great (last video). I have read recently how it is likely that the ice in Antarctica and Greenland will add considerably to the sea levels over coming decades, but can't recall the extent to which this is dependent on the rate of continued CO2 emissions. This article has prompted me to go back and check the literature.
    0 0
  2. It's interesting to note that AGW started roughly in 1975-1980, since prior to 1980, AGW CO2 emissions were nearly offset by AGW sulfates. [I always like Hansen's Mode E to illustrate that, but it's a common feature of all of the climate models.] Secondly, there is a significant delay between increase in forcing and sea level rise (certainly that from thermal expansion of the oceans), it could be as much as 30 years, perhaps even more before we see the full impact of AGW climate change from the last 30 years. ... so really little of the sea level rise shown in Figure 1 is attributable to anthropogenic warming (only that part of the ice melt from the anthropogenic component of global warming). Speaking of dowsing, Isaac Newton spent most of his life studying alchemy. I guess we can through away that quack's work too. 8D Regarding the "acceleration in sea level rise", I would dispute how robust GRACE is, given how most of the measurement is from a systematic adjustment to the data. "Robust" is usually reserved for multiple measurements and/or theoretical predictions using different methodologies that still agree. Last I checked the sign of recent the ice-loss/gain in Greenland was in dispute, and as is the long-term effect of climate change on Greenland's ice mass That's not a "robust" result in my vocabulary.
    0 0
  3. Carrick - One recent study shows by way of satellite laser altimetry that Greenland is losing mass, although due to limitations on the accuracy of the satellite laser altimeter, the study's authors couldn't saw with confidence just how much was being lost, only that the southern parts of Greenland and the lower elevations are thinning significantly (source: Extensive dynamic thinning on the margins of the Greenland and Antarctic ice sheets", doi: 10.1038/nature08471) The same study also looked at Antarctica and found something interesting - the mass loss from Antarctica is great enough that it does exceed the inherent noise of the laser altimeter, and the loss isn't just from the WAIS - there are parts of the EAIS that are also thinning, even though the EAIS as a whole is stable (not thickening or thinning). These results agree qualitative with a recent GRACE study of Antarctica that found that the same areas of thinning on the WAIS and EAIS that were detected by the laser altimetry study were also shown to be losing significant mass in the GRACE study. (Source: "Accelerated Antarctic ice loss from satellite gravity measurements", doi: 10.1038/ngeo694;) I have a more comprehensive writeup of these two papers here, as well as the two images that show that, eyeballed anyway, the GRACE areas of mass loss correspond to the altimeter areas of significant thinning: http://www.scholarsandrogues.com/2009/12/16/antarctic-ice-sea-level-rise/
    0 0
  4. If you look at the original denier article it's kind of interesting. It's just a one page site with a bunch of ads. I did a whois search and found that www.iceagenow.com is from Domains by Proxy. Not that the article is false but I think the site is just a scam to make money on a hot topic issue with google ads.
    0 0
  5. Whoops. Sorry. There actually are other pages to the site. It's just has poor navigation.
    0 0
  6. Peter: Great post. I have noticed that the University of Colorado - Bolder site has not updated their seal level data since September, 2009. http://sealevel.colorado.edu/results.php Do you happen to know why? I can't seem to find any current data set on mean sea level.
    0 0
  7. Excellent post! #2 Carrick, where did you get the idea that an acceleration in sea level rise "towards the end of the last century" depends in any way on GRACE? The reported change pre-dates the 2002 launch of GRACE, and GRACE has nothing to do with it. Also, the sign has not been in dispute for Greenland and Antarctica for a few years now, and mass loss has clearly accelerated over the last decade. The late 20th century mass loss rate for Greenland and Antarctica was close to zero, but the present rate is very clearly not zero. Yes, that means that something has changed -- glaciers in both places have sped up and are dumping a LOT of ice into the ocean (the sort of glacier dynamics not accounted for in the IPCC projections of sea level rise). To learn more about the mass trends, and how they don't just depend on one satellite system, you might start at http://www.skepticalscience.com/Why-is-Greenlands-ice-loss-accelerating.html
    0 0
  8. Carrick, additional anthropogenic forcing started (albeit very gently), around 200 years ago. If you have a look at the latest references, (or just skim the abstracts) for example Jevrejeva 2009 "Anthropogenic forcing dominates sea level rise since 1850" (linked above) this may give pause for thought. There is nothing wrong with your definition of "robust". The authors of the summary papers listed above used it (and I used it) to describe sea level rise and recent acceleration rather than the GRACE results. You are correct to suggest that the uncertainties associated with GRACE data are significant, but there has been much recent work to verify or correct the GRACE data, for example using vertical offset data from GPS or altimetry data. This really is a case of "multiple measurements and/or theoretical predictions using different methodologies that still agree". Have a look at the number of different leading organisations involved in "GLOSS" and how measurements are collected and checked. On your last point, I am not aware of any mainstream "dispute" on the sign of mass loss across Greenland as a whole. Could you provide links to recent papers or independently verifiable work that suggests this? I will be open minded. I am aware that there are variations in reported results (as I hope we should both expect), but that's not a "dispute" in my vocabulary.
    0 0
  9. For a view that even less sea level change is going on , and more importantly , the perversion of the IPCC process , listen to the interview with Dr. Nils-Axel Mörner , http://itsrainmakingtime.com/2010/nilsaxelmorner/ . But it appears the obvious conclusion about sea level rise is that it's not a significant problem and Gore's 7m and more horror videos were as absurd exaggerations as the IPCC's glaciers at greater than 6000m melting in 25 years .
    0 0
  10. Visual inspection of the graph at Fig. 1 shows sea level rise essentially the same in the 1800's as in recent years. Much has been said to explain current sea level rise. What can explain sea level rise in the 1800's?
    0 0
  11. And it does not hurt to remind that these observations are worse than the IPCC "alarmist" projections.
    0 0
  12. Bob Armstrong says: "But it appears the obvious conclusion about sea level rise is that it's not a significant problem" Until, of course, comes a massive storm surge. I'm sure that the Dutch engineers are already studying carefully what just happened to France and Portugal: http://en.wikipedia.org/wiki/Xynthia_(storm) This used to be the one-in-a-century-type of storm, but Lothar, the previous one, was only in 1999. Not that any climatological conclusion could be inferred from that short interval though. As for the "absurd exaggeration thing," it brings us back to this post
    0 0
  13. Bob Armstrong at 04:34 AM on 4 March 2010 In order to dismiss sea level rise as an issue, from my amateur perspective you need either to show that net climatic C02 sensitivity estimates are substantially incorrect or that ice sheets are not in a rough equilibrium state with their environment in a fixed temperature regime or that a mechanism exists that will substitute for the present rough equilibrium state of ice sheets even as the temperature regime changes. Regarding ice sheets in particular, are they presently of a size that is inconsistent with their current environmental regime? Is there a means for them to maintain their present volume despite a change in their environment? What if the temperature fell? Would ice sheets remain static in size? Failing such a showing, it is prudent to anticipate a rise in sea level not indicated by the historical record. Dr. Mörner does not appear to consider dynamics in his perspective but instead concentrates on past recorded behavior of sea level as it reflects a relatively static environment for ice sheets compared to what predictions of climate change indicate.
    0 0
  14. D Kelly O'Day #6 The Colorado data is Topex/Jason 1. Judging from the Jason 1 website there could be temporary technical reasons for a delay in data release. Jason 1 data is also not fully updated on the NOAA site below. Anyway, there are various outlets for the altimeter data http://ibis.grdl.noaa.gov/SAT/SeaLevelRise/LSA_SLR_timeseries.php Gives a choice of all altimeters/most applied corrections, but be aware that GIA correction is not applied. I assume from your gallery of excellent charts that you can deal with netCDF data format? (most of the alternative sources use this). If not there's a free converter app for later versions of Excel (or whatever!). Daisym #12 Yes, Figure 1 is a little deceptive. The Jevrejeva 2008 data extends back to 1700 using best available (admittedly there aren't many, so uncertainty is higher) tidal stations with long records. This shows esentially "flat" long term average until around 1800, then a gently increasing rise up to current levels. I have a chart of this also if there is interest.
    0 0
    Response: Here's the Jevrejeva data with uncertainties. For the record, Peter emailed me this graph in his first draft of his article and I edited it out in order to keep the article from getting too long. Shows what I know:

  15. I have a question about Fig 2: What explains the intra-annual variation? It looks like sea level is greatest at the end of nothern hemisphere's autumn. I would guess that melt of snow and ice on land has something to do with it, or perhaps water storage and agriculture. I should google to see if water vapour varies enough to show up. But maybe somebody here can point to a good annual budget for sea level? Thanks.
    0 0
  16. It would be interesting to see how any rise in sea level was offset my shifts in the geoid resulting from mass movement. mass loss from Greenland and Antartica will surely operate faster than geostatic rebound can compensate, resulting in a subtle but measureable shift in the gravitational geoid. Will that have a sigificant effect on what areas are impacted by sea level rise?
    0 0
  17. Steve L at 07:32 AM on 4 March, 2010 From what I have read you are correct. It can be considered as seasonal exchange of water mass between Ocean and Land storage, which would be driven more by Northern Hemisphere processes as that is where most land is.
    0 0
  18. Thank you Peter. I ended up trying to calculate how much water would have to go into the atmosphere to reduce sea level by 1 mm, and I came up with 3.6x10e14 kg. This is about 3% of the amount in the atmosphere so, at least by my careless calculations, changes in water vapour would be pretty negligible compared to the >10 mm annual swings in sea level.
    0 0
  19. John Cook: This Telegraph news: "Rise of sea levels is 'the greatest lie ever told'" http://www.telegraph.co.uk/comment/columnists/christopherbooker/5067351/Rise-of-sea-levels-is-the-greatest-lie-ever-told.html merits a response (I found it following the links of the "recent claim" above). Here is claimed (full quote): "One of his most shocking discoveries was why the IPCC has been able to show sea levels rising by 2.3mm a year. Until 2003, even its own satellite-based evidence showed no upward trend. But suddenly the graph tilted upwards because the IPCC's favoured experts had drawn on the finding of a single tide-gauge in Hong Kong harbour showing a 2.3mm rise. The entire global sea-level projection was then adjusted upwards by a "corrective factor" of 2.3mm, because, as the IPCC scientists admitted, they "needed to show a trend". So TOPEX-POSEIDON, JASON 1, JASON 2 and ENVISAT are also adjusted for showing a rapid sea level rise, Mr. Nils-Axel Mörner ?! Are all this SATELLITES part of the Global Conspiracy?! Of course, Science and Deniers are both right that the IPCC need to be advised by sea level experts: it grossly UNDER-estimated sea level rise, now at 3.3 mm/yr.
    0 0
  20. John Cook: From where are this beautiful maps and time-series shown in this post?
    0 0
    Response: Peter Hogarth mentions that the first one comes from the NOAA Laboratory for Satellite Altimetry and the second from the NASA/Goddard Space Flight Center Scientific Visualization Studio. He has an amazing talent for tracking down sources so perhaps he'll post links...
  21. From Peru at 08:41 AM on 4 March, 2010 Links for data series and images: in same order as images...The charts are my basic Excel versions updated to 2010. http://www.pol.ac.uk/psmsl/author_archive/jevrejeva_etal_1700/ http://www.pol.ac.uk/psmsl/author_archive/church_white/ http://ibis.grdl.noaa.gov/SAT/SeaLevelRise/LSA_SLR_timeseries.php http://climate.nasa.gov/blogs/index.cfm?FuseAction=ShowBlog&NewsID=239 http://ibis.grdl.noaa.gov/SAT/SeaLevelRise/LSA_SLR_movies.php http://svs.gsfc.nasa.gov/vis/a000000/a000300/a000352/index.html I think the website that the third image was from has now updated and changed, but Josh Willis still has a copy on his NASA blog site, which I've linked to.
    0 0
  22. The satelite data goes through a correction process. This correction process involves comparison to tidal gauge levels. I wonder do you have a reference for this statement in your article "Most recently, corrected tidal station data from the satellite altimeter period of 1993 to 2010 is in good agreement ". What is the basis of this correction? Has the tidal gauge data been corrected on the basis of satelite data? If both sets of data are being corrected using the other data set isn't it obvious that both will begin to agree with each other? Is the statement throughout this article that both sets of data agree with each other just a product of the correction process? Is it true that uncorrected satelite data shows no trend? Shouldn't this article focus on the data correction process as it is this that is giving us a trend? Finally why put "slowing down" in speech marks, this suggests it didn't happen when in fact from 2004-2009 it did slow down. Also for the sake of balance it would be fair to actually show a link to the reference for this work as you do with others.
    0 0
  23. #16, P@J, "Will that [changes in the geoid] have a sigificant effect on what areas are impacted by sea level rise?" Yes, geoid changes do cause regional variations in sea level. These are most important close to where the ice is melting (for example, in Alaska we have estimated geoid changes as larger as 4-5 mm per year from the rapid melting). Geoid changes from possible future large-scale melting in Greenland and Antarctica would affect larger areas (because of the larger size of the ice loads). There are some additional factors that come into play when dealing with the big ice sheets -- global changes in the shape of the earth. Jerry Mitrovica had a recent paper in Science about a year ago that worked this out for West Antarctica. A summary was in Science Daily: http://www.sciencedaily.com/releases/2009/02/090205142132.htm
    0 0
  24. 30% thermal expansion plus 55% melting land ice equals 85%. What's the other 15%? Is there another source or is it just uncertainty in the figures?
    0 0
  25. Bob Armstrong @ 9 I wouldn't accept Morners' criticisms without checking them out first. He has made claims against the IPCC in the past that were easily verified as being baseless. I have commented on his claims made to the Telegraph (apparently clarified in the interview) http://www.telegraph.co.uk/comment/columnists/christopherbooker/5067351/Rise-of-sea-levels-is-the-greatest-lie-ever-told.html Morner says: "One of his most shocking discoveries was why the IPCC has been able to show sea levels rising by 2.3mm a year. Until 2003, even its own satellite-based evidence showed no upward trend. But suddenly the graph tilted upwards because the IPCC's favoured experts had drawn on the finding of a single tide-gauge in Hong Kong harbour showing a 2.3mm rise. The entire global sea-level projection was then adjusted upwards by a "corrective factor" of 2.3mm, because, as the IPCC scientists admitted, they "needed to show a trend"." This isn't actually true, Morner's paper on the satelite evidence makes no mention of the specific claim regarding the single tide gauge; however he does demonstrate a complete lack of understanding of the processing of satelite altimetry data (and a fair bit of Dunning-Kruger effect). For instance he doesn't reference the papers that quite clearly explain how the adjustments have been made to the raw data from the instrument. It appears that he is basing his claims on a figure without a verifiable source that is likely to be some sort of calibration plot (and not what he thinks it is). His paper is here: http://dx.doi.org/10.1016/S0921-8181(03)00097-3 and is debunked here: http://dx.doi.org/10.1016/j.gloplacha.2006.08.002 his response is here http://dx.doi.org/10.1016/j.gloplacha.2008.03.002 note Morner STILL doesn't explain the origin of his "raw data" or explain his methodology in a way that would allow his results to be reproduced (I did try and track down his references, but they no longer exist and the closest I could find were not what he claimed them to be). Morner also claims: "When asked to act as an "expert reviewer" on the IPCC's last two reports, he was "astonished to find that not one of their 22 contributing authors on sea levels was a sea level specialist: not one"." However one of those 22 is Any Cazenave, who is a sea level specialist (there may well be others), however Booker obviously could be bothered to verify Morner's claims before publishing them. Morner elsewhere claims: "I am a sea-level specialist. There are many good sea-level people in the world, but let's put it this way: There's no one who's beaten me. I took my thesis in 1969, devoted to a large extent to the sea-level problem. From then on, I have launched most of the new theories, in the '70s, '80s, and '90s." http://www.iceagenow.com/Claim_that_sea_Level_is_rising_is_a_total_fraud.htm However his work has received very little attention, his publications give him a Hirsch index of 9 (meaning he has nine publications with more than 9 citations), which is hardly consistent with his claim to be a top sea level specialist. My Hirsch index appears to be about 12 (according to Google Scholar), and I wouldn't claim to be a leading scientist in my own field. In short, one needs to be very skeptical when reading claims of fraud ("perversion"), they are easily made, and sometimes quite easily refuted.
    0 0
  26. Just gone and checked again with Google Scholar and there are a lot more of Morner's papers from the 70s there now than last time I looked, so his Hirsch index is now rather higher than the earlier estimate, I'd say it was in the high teens. However he has very few widely cited papers from the last decade or so.
    0 0
  27. Even with lags in mind, I don't see any trace of the relative stasis in global temperatures from 1940-1970 in the sea level rise figures. Is this surprising? Is this expected? Can somebody give an explanation?
    0 0
  28. carrot eater #27 That's an interesting question. We can see, on the other hand, a slight spike in 1998 - which would suggest a short lag (at least on the thermal expansion side).
    0 0
  29. HumanityRules at 11:10 AM on 4 March, 2010 You make a fair general point, but this is not a case of one data set correcting another which then validates the first! The tidal station data are relative (Land level-Sea Level) so to make them absolute we need land vertical offset corrections for individual samples, or vertical velocity estimation corrections for extended time series. As I briefly said, most recently this is done with nearby fixed stations which use GPS (see Woppelmann 2009 linked in post) or DORIS satellite systems that are ultimately referenced back to and integrated with other geodetic systems such as SLR (Satellite Laser Ranging) or VLBI (Very Long Baseline Interferometry). These systems are all used to generate a stable geocentric reference frame such as the International Terrestrial Reference Frame (ITRF). Once a sufficient number of vertically bench marked tidal stations are available (there are currently around 300) it is possible to “calibrate” (I’ll use this word rather than “correct”) the independent satellite altimeters (as their raw data are in a sense “orbit referenced”) to allow global coverage - which the tide stations obviously cannot give. It is also fair to suggest that the altimeters are not perfect and are subject to all sorts of error sources, however once calibrated, their output is independent of the tidal stations. Thus in turn they could then be used to estimate vertical offsets for tide station data where there is no nearby GPS station. This is not to say that all of the many sensors are not continually checked and calibrated, or that further corrections will not be made. Cross validation is certainly part of this process. However the possibility of a major error or drift having remained hidden over the past 17 years over several different satellite sensors is quoted as “unlikely”. On your point about recent acceleration, there are (of course) decadal changes in gradient throughout the historical tidal records, but the papers listed in the post give the rationale behind the reported recent increase being more significant than previous “decadal” changes. In general, it is obvious even by inspection that the shape of the long term average for the extended time series is an upwards curve, though of course this should not be substituted for careful analysis, and “long term” is relative! The “slowing down” comment was something I saw from commentators on blog sites, and was (I believe) based primarily on a couple of years worth of the then current Jason 1 data. There may well be references for this (or other previous accelerating or decelerating mini-trends in the data set), and if so I have not excluded these out of any deliberate bias, but simply because the mainstream consensus of expert opinion that I am exposed to (and have tried to communicate to a wider audience) has moved on. The best overview on the complete “system” is The Global Sea Level Observing System (GLOSS), Merrifield 2009, linked in the post. Also: OceanObs09 – Community White Paper. Observations of Sea Level Change: What have we learned and what are the remaining challenges?. Nerem 2009 https://abstracts.congrex.com/scripts/jmevent/abstracts/FCXNL-09A02a-1728088-1-OceanObs2009cwp_final.pdf
    0 0
  30. #24 suckfish asked, "30% thermal expansion plus 55% melting land ice equals 85%. What's the other 15%? Is there another source or is it just uncertainty in the figures?" I have not had time to read the new Cazenave paper yet, which is where the details of the answer lie, but I saw an earlier version of the work presented a couple of years ago. The answer is both. There are some other "lines" in the budget: terrestrial water storage (groundwater, lakes, rivers), and artificial reservoirs. (Changes in these are what matter for sea level rise or fall). But all of the terms of the budget are estimated independently of sea level rise, so the sum won't be 100% but if the estimates of the components are accurate the sum should agree with sea level rise given the error bounds.
    0 0
  31. Satellites provide us with great precision in the measurement of sea levels. Since the start of the satellite record the rate of rise has averaged 3.2 mm/year, in good agreement with other methods. Trying to put this in perspective, the 21st century sea level rise could be 0.3 meters or more. Is that a catastrophe? During the 20th century sea levels rose by ~0.2 meters so maybe we do have a problem as the rate appears to be rising. My understanding is that sea levels have risen by 110 meters in the last 9,000 years as the planet recovered from the last Ice Age. That works out at an average of 1.2 meters per century. Thus looking at the big picture, the current rate of rise is quite low and certainly not unprecedented. I live in Florida and at the current rate of rise my home will be at sea level in 1,000 years but by then we will probably be more worried about the glaciers covering most of Canada.
    0 0
    Response: A rise of 30 cm by 2100 is not what the peer-reviewed science is telling us. Sea levels will not continue to rise at a linear 3.2 mm per year but are accelerating, primarily due to accelerating ice loss from the Greenland and Antarctic ice sheets. Satellite gravity measurements are already observing accelerating ice loss from both ice sheets (Velicogna 2009).

    Once the contribution from ice sheets are taken into account, two entirely independent analyses (one using past sea level behaviour, the other using ice sheet dynamics) find the expected sea level rise by 2100 to be between 80 cm to 2 metres (Vermeer 2009, Pfeffer 2008). . This sea level rise will be more than inconvenient to many millions of people.

    You make a good point that sea level rise has changed dramatically in the past. In fact, the past tells us volumes about how sea level responds to temperature. What it tells us is that ice sheets are very sensitive to changes in temperature. Consider that our lower emission scenarios predict a warming of around 1 to 2°C. This is approximately the same as the temperatures during the last interglacial, around 125,000 years ago. At this same time, sea levels were at least 6 metres higher than current levels.

    In other words, while we expect sea levels to rise 80cm to 2 metres by 2100, sea level rise won't stop there. They will continue to rise and at our current emission trajectory, we expect sea level rise of at least 6 metres. There is uncertainty over how long this will take - likely centuries. I imagine future generations will not look kindly at the late 20th Century/early 21st Century generations who ignored these multiple lines of peer-reviewed evidence for dramatic sea level rise.
  32. Dear Camel: 1. The "or more" is important; 2 m is a lot. 2. Not much infrastructure was at risk 9000 years ago. 3. If glaciers covered Canada, sea level would be lower. 4. But that won't happen: ice-age postponed 5. It's not all about you and your house.
    0 0
  33. Camel: What Steve L said, plus: 6. Most of the sea level rise from the last glacial maximum was over by about 6000 years ago. So your average is meaningless, because the average rate of rise from about 6000 years ago to a few hundred years ago was very close to zero (much closer to 0 than 2-3 mm per year is). Advanced human civilzations rose AFTER sea level stabilized, which also would have stabilized shorelines, near-coastal river gradients, etc.
    0 0
  34. I can believe relative sea level changes measured by satellites, more or less. However, absolute rates are highly dubious. Earth's moment of inertia is 8x10^37 kgm^2. There is a continuous loss of rotational angular momentum due to tidal breaking (angular momentum lost goes into orbital angular momentum of Moon, Earth-Moon distance is measured to increase by 38 mm/year). It is supposed to slow down Earth's rotation, i.e. increase LoD (Length of Day) by 2.3 msec/century. On the other hand, historic record of solar eclipses for the last 2700 years indicate a 1.7 msec/century inrease in LoD. The difference is due to glacial rebound. Land formerly covered by ice sheets rises (Canada, Scandinavia), mantle material moves to the North, closer to axis to support it, moment of inertia decreases. A -0.6 msec/century change in LoD implies a 7x10^-9 relative decrease in moment of inertia per century (-5.6x10^29 kgm^2 in absolute numbers). A sea level rise of 3.3 mm/year increase measured by satellites increases Earth's moment of inertia. The mass of a 3.3x10^-3 m thick spherical shell of radius 6.37x10^6 m and having density 10^3 kg/m^3 is 1.7x10^15 kg. Moment of inertia for spherical shell is 2/3*M*R^2, i.e. 4.55x10^28 kg/m^2. In fact about 70% of Earth is covered by oceans, so actual increase in moment of inertia due to sea level rise is more like 3x10^28 kg/m^2/year. It is only an order-of-magnitude calculation, so latitudal distribution of ocean basins is considered uniform. It implies a 3.3 msec/century increase in LoD. As the secular increase is 1.7 msec/century, it would mean a 5 msec/century recent rate. Nothing like that is seen. We have data for the last three centuries (hail to astronomy). Earth's moment of inertia varies wildly, but there is not much trend in it. The 1.7 msec/century secular trend perhaps, nothing else. Sea level rise is undetectable. It can mean two things. Sea level is either not rising, at least not on a rate compatible with satellite data or haphazard changes in shape & internal mass distribution of Earth just mask it. The two things may even be connected. Satellite measurements show large regional differences in sea level change. It may be just the underlying mantle. The coordinate system used by satellites is not rigid (in fact rigid rotating coordinate system can not even exist). It is calibrated (and re-calibrated because of orbital drift) to a selected set of "fixed" points on Earth. But those points are not really fixed (relative to what?), they are just fixed to the surface. The question is far from being settled, slope of satellite altimetry is rather arbitrary. PNAS 2002 Twentieth century sea level: An enigma Walter Munk
    0 0
  35. The Munk paper referenced above is over 8 years old (sent of review in 2001). What are the follow ups?
    0 0
  36. John Cook, the high numbers for the IPCC's predictions on sea level rise are dependent on temperatures rising at unprecedented rates. If you believe in scary temperature rise scenarios then rapidly rising sea level predictions are plausible too. We need to revisit this in 2020; by then I may agree with you (or perhaps vice versa). Steve L, my apologies for making this "Camel Centric". Nah! Just kidding. Back in 1325 my ancestors were paying taxes to Edward III in Littleham-by-Bideford (Devon, UK). Historians tell us that they were mostly drinking wine that was inexpensive and of high quality rather than beer that people consume in modern Devon. I hope that the IPCC will be proven right so that temperatures will rise to the point that my many relatives will give up their beer/whisky habits in favor of wine and growing seasons will be extended in the higher latitudes.
    0 0
  37. Berenyi Peter, wow! Way above my pay grade!
    0 0
  38. Berenyi Peter, I haven't delved too deeply into your analysis, however one point occurs to me - I think your analysis would be absolutely correct if the water for sea-level rise were being added to the Earth, however it's not - it's a redistribution of existing mass. Some from Greenland, some from Antarctica. I wouldn't have thought the distribution was anything like being even, either, due to rotational oblateness effects (or whatever you call it). Does anyone know of a reference that looks into this aspect of SLR in detail, taking all the effects into account? It's a very complicated situation...
    0 0
  39. @Carrot Eater #27: It is hard to attribute particular increases in the sea level rate-of-rise to particular warming events. The Jenreva chart in comment #14 shows the acceleration in sea level rise starting in the late 1700's. AGW in 1800?? Church and White 2006 say "Another approach, given the clear change of slope at ~1930, is to do linear regressions on the two halves (1870–1935 and 1936–2001) of the record. The slopes are 0.71 ± 0.40 and 1.84 ± 0.19 mm/yr respectively, implying an acceleration of 0.017 ± 0.007 mm yr^-2 (95%). That simple analysis shows a greater than doubling in rate of rise taking place in the 1930s. Huge amount of AGW in 1930 ?? Church and White's 2006 paper, "A 20th century acceleration in global sea-level rise" only had data starting in 1870, but his best fit to the data was a quadratic with acceleration starting before the start of his 1870 data start. The paper, available as pdf has a graph plotting the sea level rate of rise with 10 year smoothing. The main post above references Jevrejeva 2008, but didn't list the title: "Recent global sea level acceleration started over 200 years ago?" The bottom half of figure three shows a graph similar to Church and Whites sea level rate-of-rise variation graph, except that it shows the roughly 60 year period on an upward trend going back to 1700. See http://www.pol.ac.uk/psmsl/author_archive/jevrejeva_etal_1700/2008GL033611.pdf Figure 3. So were we experiencing sea level rate of rise acceleration due to AGW back in 1700 ? If the sea level acceleration of today is an extension of the Jevrjava graph starting from 1700, why are we so certain that today's acceleration is anthropogenic?
    0 0
  40. #34 Berényi Péter, Bern (#38) is right, and your calculation is an overestimate. Most of the sea level rise is either thermal expansion (some change in moment of inertia as some mass is moved outward) or from melting land ice. In both cases, the change in the moment of inertia is definitely smaller than your calculation because the mass now in the ocean was already at about 1 earth radius. You have to take your value and subtract the effect of removing the mass of the water from where it WAS. You are only partially right about the coordinate system. All sites on the surface move due to plate tectonics, but the coordinate system itself does not deform due to plate tectonics. The relative positions of those sites are measured daily to weekly, with a precision at the few mm to centimeter level, by 4 independent global measuring systems. Orbits of the altimetry satellites (and others) are determined both through laser ranging and radiopositioning (GPS and sometimes DORIS). There are always technical concerns with any kind of work when you aim for the highest precision, but the error bars on the altimetry estimate already include the best error estimates available for these uncertainties.
    0 0
  41. #38 Bern, for the effects on sea level of geoid change and changes in shape due to changes in the rotation axis with post-glacial rebound, you could start with the Science Daily article on the Feb 2009 paper by Jerry Mitrovica (link above in comment #23). As for the effects on earth rotation, I did some searching around. For effects on length of day, check out Landerer et al. (2007) in Geophysical Research Letters (http://www.agu.org/journals/gl/gl0706/2006GL029106/). You can download a non-formatted preprint for free at http://www.mpimet.mpg.de/fileadmin/staff/landererfelix/landerer_07_GRL.pdf. They say the effect has been -0.12 milliseconds over the last 200 years. The effect on the position of the earth's rotation axis is covered in a 2009 paper from Landerer et al. in the same journal. Probably available in preprint form on the same website, if you can't get the journal.
    0 0
  42. #39, Charlie A. asks about 19th century sea level rise. I estimate about 70 mm of sea level rise, 1800-1900, from the graph -- just eyeballing. Close to 30% of that 19th century sea level rise came from Alaska and coastal British Columbia. About 10% came from the collapse of the glacier/icefield system in Glacier Bay, Alaska (3000 cubic km of ice lost, equivalent to 8 mm global sea level rise), and about 20% from the rest of the surrounding area. Whatever the global extent of the Little Ice Age, it was certainly significant in Alaska, and the glaciers and icefields have been shedding mass rapidly since 1750-1800. The main cause for the rapid response is probably not melting but rather tidewater glacier dynamics leading to very rapid retreat and dumping ice into the ocean, where it melts. This is not a purely temperature-driven effect, but an amplified response to warming caused by positive feedbacks. Reference for the last paragraph is Larsen et al. (2005), in Earth and Planetary Science Letters (I'm a co-author).
    0 0
  43. Darn it. I read my own graph wrong. Glacier Bay collapse was ~8 mm of global sea level rise, and most of that from 1800-1900 (about 10% of global rise over that time). The regional component mentioned above was ~15 mm but over about 1850-2000, so about another 5 mm within 1800-1900, leading to 15-20% of the total, not 30%. I didn't deal with Charlie A's anthropogenic or not question. Sea level rise tells you it is warming, whether anthropogenic or not. To get at the anthropogenic component, you need to explain the various contributions to sea level rise -- see the Cazenave presentation and paper referenced in the main post -- and see what component of those are due to anthropogenic warming.
    0 0
  44. Peter Hogarth #14: Thanks for the expanded scale for the graph at Fig 1. This graph is wonderful in its simplicity and ability to help visualize sea level rise. I see three distint sections on the graph. One, is for the essentially flat plot from 1700 to 1800; then two, an increasing rate of rise from 1800 to 1900; then three, a steady rate of rise from 1900 through 2010. A couple of questions come to mind as I see this. Given that sea level rise occurs slowly over time, something must have happened between 1700 and 1800 to cause sea levels to rise as shown beginning at about 1800. Whatever was the cause ameliorated after 1800 to the steady rise that began at about 1900 and continues, today. This begs the question, is the sea level rise shown on the graph of manmade or natural origin? And if manmade, it seems that sea levels should be rising at an increasing rate, as we see fron 1800 to 1900 due to the development of industry and transportation, but that doesn't seem to be the case. How certain are we that we know what causes sea levels to rise?
    0 0
  45. Hi John, do you have a webpage for the English vineyards skeptic talking point (I won't call it an argument)? To respond to Camel I have to go to one of your competitors: RealClimate Jul2006 RealClimate Nov2006
    0 0
  46. Steve L at 17:51 PM on 5 March, 2010 Duly added to Links page. Your trophy is here: Links for 'Wine grew in England in Roman times'
    0 0
  47. daisym -- I think over short time scales only warming (and therefore thermal expansion of water and melting of land ice) causes global sea level to rise globally. There are some positive feedbacks too, if you like a less simple answer. What causes the warming is a topic covered on other pages on this site (hint: greenhouse gases and black carbon very likely play a role). Also, there's this fun thing.
    0 0
  48. HumanityRules at 11:10 AM on 4 March, 2010 You make a fair general point, but this is not a case of one data set correcting another which then validates the first! The tidal station data are relative (Land level-Sea Level) so to make them absolute we need land vertical offset corrections for individual samples, or vertical velocity estimation corrections for extended time series. As I briefly said, most recently this is done with nearby fixed stations which use GPS (see Woppelmann 2009 linked in post) or DORIS satellite systems that are ultimately referenced back to and integrated with other geodetic systems using SLR (Satellite Laser Ranging) or VLBI (Very Long Baseline Interferometry). These systems are all used to generate a stable geocentric reference frame such as the International Terrestrial Reference Frame (ITRF). Once a sufficient number of vertically bench marked tidal stations are available (there are currently around 300) it is possible to “calibrate” (I’ll use this word rather than “correct”) the independent satellite altimeters as their raw data are in a sense “orbit referenced” to allow global coverage - which the tide stations obviously cannot give. It is also fair to suggest that the altimeters are not perfect and are subject to all sorts of error sources, however once calibrated, their output is independent of the tidal stations and not subject to ongoing trend correction using tidal station increases as you might be suggesting. Thus in turn they could then be used to estimate vertical offsets for tide station data where there is no nearby GPS station. Cross validation is certainly part of the process. This is not to say that all of the many sensors are not continually checked and calibrated, or that further corrections will not be made. However the possibility of a major error or drift having remained hidden over the past 17 years over several different satellite sensors is quoted as “unlikely”. On your point about recent acceleration, there are (of course) decadal changes in gradient throughout the historical tidal records, but the papers listed in the post give the rationale behind the reported recent increase being more significant than previous “decadal” changes. In general, it is obvious even by inspection that the shape of the long term average for the extended time series is an upwards curve, though of course this should not be substituted for careful analysis, and “long term” is relative! The “slowing down” was something I saw from commentators on blog sites, and was (I believe) based primarily on a couple of years worth of the then current Jason 1 data (from University of Colorado, the standard ASCII data outlet). There may well be references for this (or other previous accelerating or decelerating mini-trends in the data set), and if so I have not excluded these out of any deliberate bias, but simply because the mainstream consensus of expert opinion that I am exposed to (and have tried to communicate to a wider audience) has moved on. The best overview on the complete “system” is The Global Sea Level Observing System (GLOSS), Merrifield 2009, linked in the post. Also: OceanObs09 – Community White Paper. Observations of Sea Level Change: What have we learned and what are the remaining challenges?. Nerem 2009
    0 0
  49. Berényi Péter at 13:23 PM on 5 March, 2010 I admire the working and effort (and charts), but your "spherical shell" argument as it stands is fundamentally flawed. Much of the estimated 3.3 mm/yr rise is "steric", ie due to processes that cause an increase in ocean volume without a change in mass, mainly through changes in temperature (thermal expansion) and salinity. The remaining "eustatic" rise, does refer to mass increase (at least in the oceanographic community). This is changes in land runoff, including glaciers and ice sheets but as has been pointed out above, this is a re-distribution of mass, and only a proportion of this will effectively move in latitude. There is recent work on this (I'll look), some references submitted by others above (thanks Jeff). Again, look at the GLOSS summary linked in the post. The Geodetic guys are well represented. The ITRF reference frame is a virtual co-rotating frame, not referenced to the Earths surface as such, but to its "centre" (or very close). For full fetails see http://itrf.ensg.ign.fr/general.php
    0 0
  50. Steve L at 07:32 AM on 4 March, 2010 I have been looking for a good visual of the North/South Seasonal variation. CSIRO has something on their fine website. http://www.cmar.csiro.au/sealevel/sl_drives_seas_dec.html
    0 0

1  2  Next

You need to be logged in to post a comment. Login via the left margin or if you're new, register here.


The Consensus Project Website

THE ESCALATOR

(free to republish)


© Copyright 2024 John Cook
Home | Translations | About Us | Privacy | Contact Us