


 Arguments


Saharan dust cloud was most intense in decades, and more, though milder, are coming
Posted on 7 July 2020 by Guest Author
This is a re-post from Yale Climate Connections by Jeff Masters
The massive dust storm that formed over the Sahara Desert in mid-June invaded the southeastern U.S. June 25-28, bringing dangerous levels of air pollution, low visibility, and colorful sunsets.
The air pollution event over parts of Texas and the Gulf Coast, composed of fine particulate pollution (PM2.5, particles less than 2.5 microns or 0.0001 inch in diameter) and PM10 (particles less than 10 microns in diameter) was one of the most widespread and intense observed in recent decades.
According to FEMA meteorologist Michael Lowry, the intensity of the dust outbreak over the tropical Atlantic was by far the most extreme since the most detailed, continuous record of global dust began in 2002, when the MODIS instruments on NASA’s Aqua and Terra satellites began taking measurements. The Aerosol Optical Depth (AOD) measured on June 20, 2020, was 1.66, shattering the previous daily record of 1.13 set on July 31, 2013.
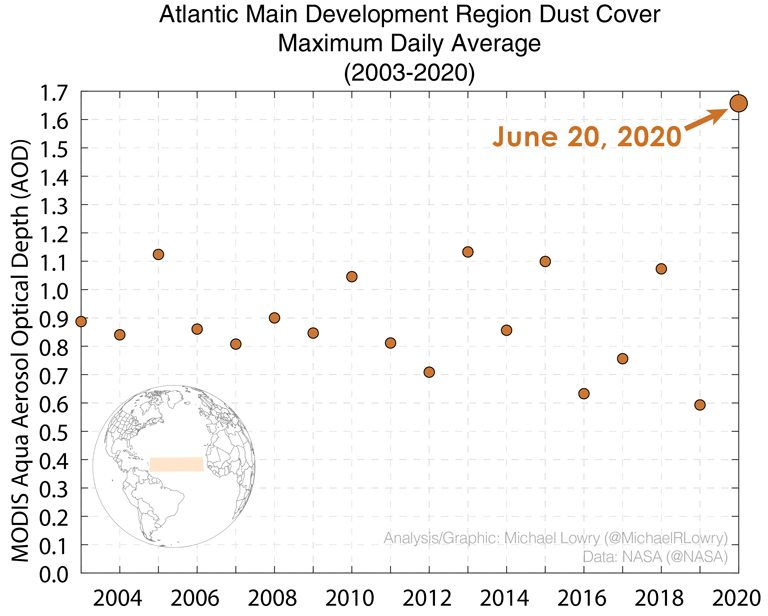 Figure 1. The African dust cloud over the tropical Atlantic’s main development region (MDR) for hurricanes was at a record high thickness on June 20, 2020. (Photo credit: Michael Lowry)
Experts say more dust storms are likely in coming weeks and months, but not all will affect the U.S., and few will likely reach the intensity of the June 2020 event.
Dangerous air pollution during COVID-19 pandemic
The African dust cloud brought unhealthy levels of PM2.5 to much of the southeastern U.S. beginning on Thursday, June 25, when the air quality index (AQI) exceeded the 24-hour U.S. EPA standard for PM2.5 over the Florida Panhandle region. The AQI was in the orange (unhealthy for sensitive groups) range on that day, and reached the red (unhealthy) range on June 26 and 27 over the Florida Panhandle, much of Texas, and a small portion of Oklahoma. By June 28, the dust had thinned so only a few areas in the Midwest, primarily in Kansas, experienced PM2.5 levels in the orange category.
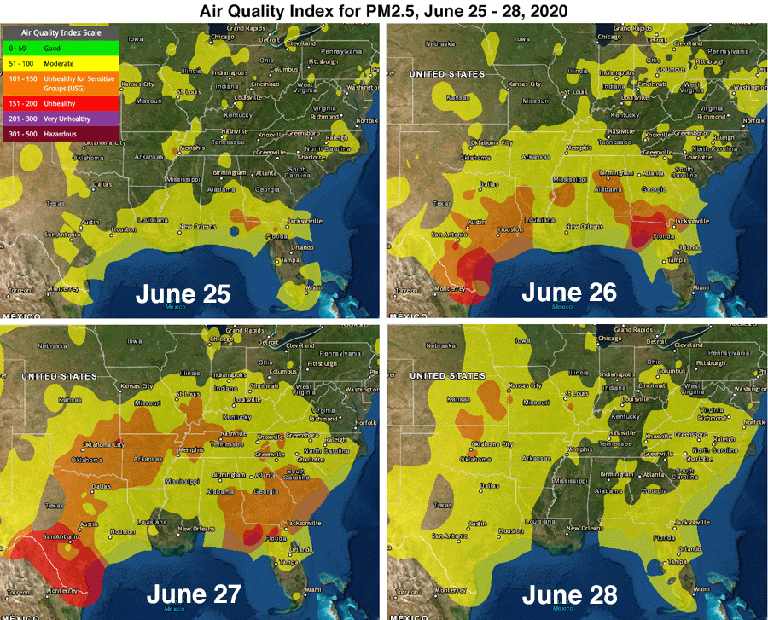 Figure 2. Daily Air Quality Index (AQI) for June 25-28, 2020, when a cloud of African dust brought dangerous levels of PM2.5 pollution to much of the southeastern U.S. (Image credit: U.S. EPA)
Air pollution aggravates COVID-19 symptoms, and likely led to increases in hospital admissions from the disease in regions where dust concentrations spiked. A PM2.5 episode as widespread and severe as this – even without the COVID-19 pandemic raging – could cause hundreds of premature deaths. A 2019 study, Effects of fossil fuel and total anthropogenic emission removal on public health and climate, found that the health burden of fine particulate matter (PM2.5) air pollution is much higher than had been previously understood.
That study concluded that outdoor air pollution from PM2.5 and ozone causes 8.79 million premature deaths globally each year. Of that total, natural sources of outdoor air pollution accounted for 3.24 million deaths per year, and human-caused sources 5.55 million deaths per year. A premature air pollution-related death typically occurs about 12 years earlier than it otherwise might have, according to Caiazzo et al., 2013.
According to a 2018 study done by the Health Effects Institute (a U.S. nonprofit corporation funded by EPA and the auto industry), PM2.5 pollution in the U.S. caused approximately 87,000 premature deaths per year between 2010 and 2016. Air pollution deaths are calculated using epidemiological studies, which correlate death rates with air pollution levels. Air pollution has been proven to increase the incidence of deaths caused by strokes, heart attacks, and lung disease. As these causes of death result also from other factors – such as lifestyle and family history – they are usually referred to as premature deaths.
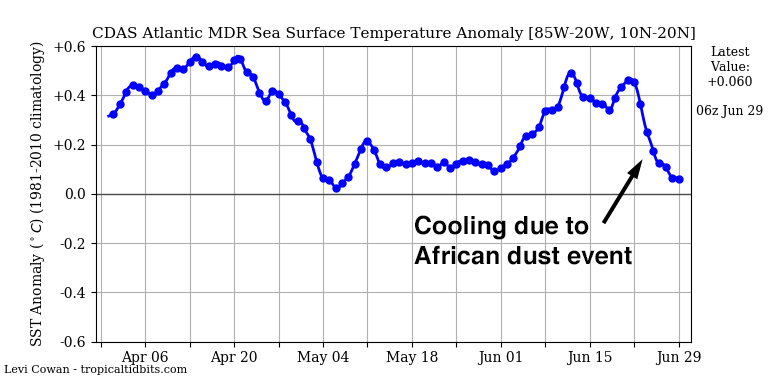 Figure 3. Sea surface temperatures for the hurricane main development region (MDR) of the tropical Atlantic, from the coast of Africa to the Caribbean. (Image credit: tropicaltidbits.com)
Dust cloud cooled sea, reducing energy available to power hurricanes
Dust acts as a shield, keeping sunlight from reaching Earth’s surface. Last week’s dust event helped depress sea surface temperatures by 0.4 degrees Celsius in the hurricane main development region of the tropical Atlantic, from the coast of Africa to the Caribbean. This is a major reduction in the heat energy available to power hurricanes – a very encouraging development, since ocean temperatures there were 0.6 degrees Celsius above average during the first 25 days of June. Those temperatures ranked as the fourth-highest on record for the region.
The cooling may be relatively short-lived, however. Recent forecasts from European and GFS models predict that by the second week of July, surface trade winds in the tropical Atlantic will ease, the result of the Azores-Bermuda High drifting northward and weakening. Slower surface winds allow the ocean surface to warm by reducing the amount of cool waters from the depths that are stirred up to the surface, caused by reduced evaporative cooling. It is likely, though, that more African dust outbreaks will counteract this effect in the coming month, since African dust events typically are at their peak in July. Recent satellite imagery shows another strong Saharan Air Layer incursion is underway over the tropical Atlantic, accompanied again by a thick cloud of African dust.


There were several things that were notable from my vantage point in Kansas:
1) The dust cloud was also accompanied by a very humid tropical air mass, making it almost intolerably uncomfortable to be outside because of the accompanying humidity. In fact I wasn't sure for a while whether the haziness was due to the dust or the extreme humidity. I suppose it was a combination of both. So I don't know which part of the situation contributed the most to the situation: the dust or the humidity. I guess it doesn't really matter as both can make breathing more difficult.
2) What made it unmistakebly certain that it was the dust was, well, the dust. It laid down a very fine layer that coated everything, very noticeably on cars. I've seen it happen in dry years when March winds can bring dust in from the western parts of the state, but to come all the way over from the Sahara is pretty impressive.