


 Arguments


Sea ice falls to record lows in both the Arctic and Antarctic | @RozPidcock http://j.mp/2nUI62R
Sea ice falls to record lows in both the Arctic and Antarctic
Posted on 5 April 2017 by Guest Author
This is a re-post from Carbon Brief by Roz Pidcock
The Arctic and Antarctic have experienced record lows in sea ice extent so far in 2017, according to the latest data from the US National Snow and Ice Data Centre (NSIDC).
At about this time each year, the Antarctic reaches its lowest extent for the year while the Arctic reaches its highest. The new satellite data, released today, confirms that there is less sea ice globally than at any time in the entire 38-year satellite record.
The NSIDC doesn’t usually release data for both poles simultaneously, but has done so this time because of what scientists have dubbed an “exceptional” year in 2017.
The news comes as the World Meteorological Organisation confirmed this week that 2016 “made history” with record high global temperatures and low sea ice. Many of last year’s extreme conditions have continued into 2017, the report notes.
Arctic low
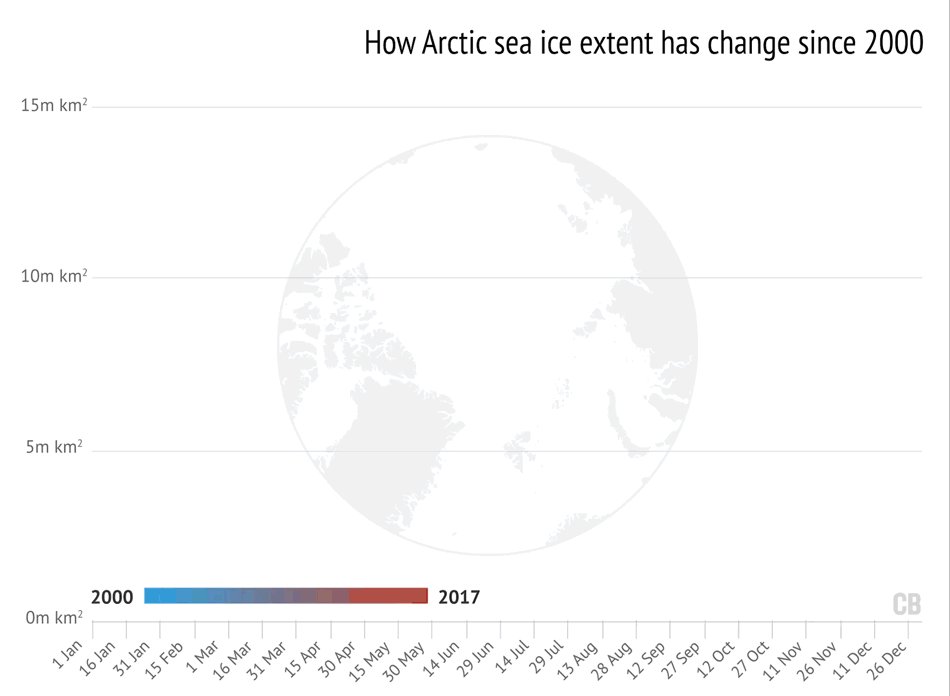
With just 14.42m square kilometres on the 7 March, this year’s winter maximum in the Arctic ranks as the smallest in the satellite record, for the third year in a row.
This year’s maximum extent is 1.22 million square kilometres below the 1981 to 2010 average maximum of 15.64 million square kilometres, NSIDC confirmed today.
Record low sea ice extent in February continued a string of records over the winter months, from October through to February. A “heatwave” in mid-November caused some parts of the Arctic to be 15C warmer than usual, for example.
Click on the different years in our interactive graph below, to see how sea ice extent compares with 2017.
The Arctic winter maximum has been shrinking by about 3% per decade. The decline is much faster for the summer minimum in September, at more like 13% per decade. Recent research shows up to two-thirds of the drop is a direct result of human activity.
Ice lost from the Arctic can have consequences much further afield, as a new WMO report explains:
“Scientific research indicates that changes in the Arctic and melting sea ice is leading to a shift in wider oceanic and atmospheric circulation patterns. This is affecting weather in other parts of the world because of waves in the jet stream – the fast-moving band of air which helps regulate temperatures.”
As we enter 2017’s summer melt season, Arctic sea ice looks vulnerable. This is especially so, given that the latest sea ice thickness observations from the CryoSat-2 satellite show very thin ice in a number of regions, says Zack Labe, a PhD student studying sea ice at the University of California. That said, it’s too soon to tell if we’ll see a record low minimum come September, he tells Carbon Brief:
“Weather has a big role in the summer melt season, so speculations are challenging as to whether 2017 will be a new record minimum.”
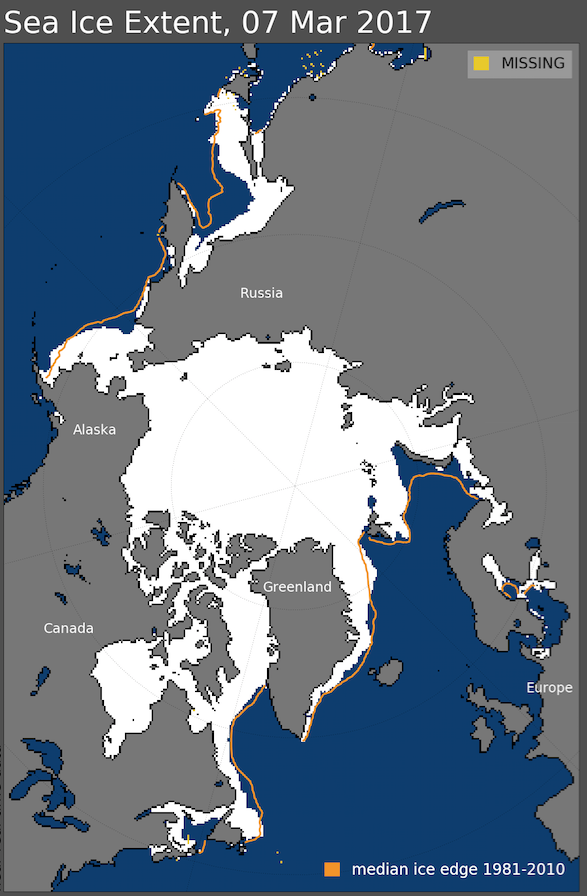
Arctic sea ice extent for March 7, 2017 was 14.42 million square kilometres. The orange line shows the 1981 to 2010 median extent for that day. Source: NSIDC
Greenland
While the behaviour of Arctic sea ice tends to attract the biggest headlines, the continent of Greenland has been experiencing unusual weather this winter, too.
Despite some periods of extreme cold, this winter has been much warmer than average, according to Polar Portal, a website run by Danish researchers. A succession of heavy storms since October dumped more snow than usual on the eastern and southern parts of ice sheet, the scientists explain:
“The accumulation season got off to a flying start in October, when a series of large storms hit the east coast of Greenland dropping 264mm of rain in the main town of Tasiilaq in 25 days, compared to the average for October of 83mm for the whole of October.”
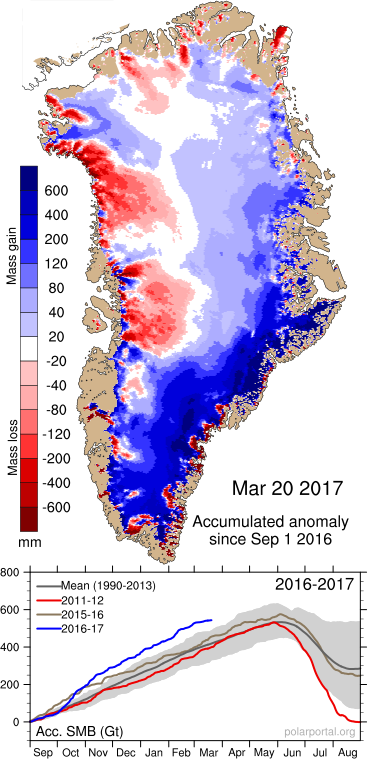
Top: Map of ice mass lost (red) and gained (blue) from the surface of Greenland through snowfall between 1 September 2016 and 20 March 2017 (in mm water equivalent) Bottom: Change in surface ice mass during winter 2016/17 compared to previous years. Source: Danish Meteorological Institute
But while some claim this extra snowfall over winter means Greenland ice is at “record high” levels, this ignores a much bigger part of the picture. Icebergs “calving” off the ice sheet and into the ocean account for much bigger losses, explains Dr Ruth Mottram, a researcher at the Danish Meteorological Institute. She tells Carbon Brief:
“Over the last decade, Greenland has lost around 200-300bn tonnes (gigatonnes, Gt) of ice each year, the extra snowfall we estimate from our models is about 150Gt. So it’s not at all balancing what is lost by melting and calving in a typical year.”
The summer months – June, July and August – are the most important for the ice sheet, so it’s important not to read too much into heavy snowfall over the winter season, Mottram adds.
‘Exceptional year’ in the Antarctic
Meanwhile, at the other end of the planet, Antarctic sea ice has been experiencing its minimum extent for the year.
With 2.11m square kilometres of ice, this year’s low marks an all-time record low for the satellite era. Reached on 3 March, the summer minimum caps off an unusually vigorous melt season, with new records set in every month since November.
How does 2017 compare to previous years? Natural fluctuations play a big role in Antarctic climate, causing swings in sea ice extent from year to year. Dr Mark Brandon, a polar oceanographer at the Open University, tells Carbon Brief:
“Just a few years ago the Antarctic sea ice extent was breaking records as being relatively high, but this year it has shown record-breaking lows for several months.”
The Antarctic’s “exceptional year” in 2017 could even be a hangover from the powerful El Niño the world recently experienced, says Brandon:
“A pattern of air pressure that determines the wind circulation in the high southern latitudes called the Southern Annular Mode switched from positive to negative in late 2016 and this may be linked to the large El Nino of 2014-16.”
This switch made the ice “more mobile and likely led to the relatively early Antarctic spring”, explains Brandon.
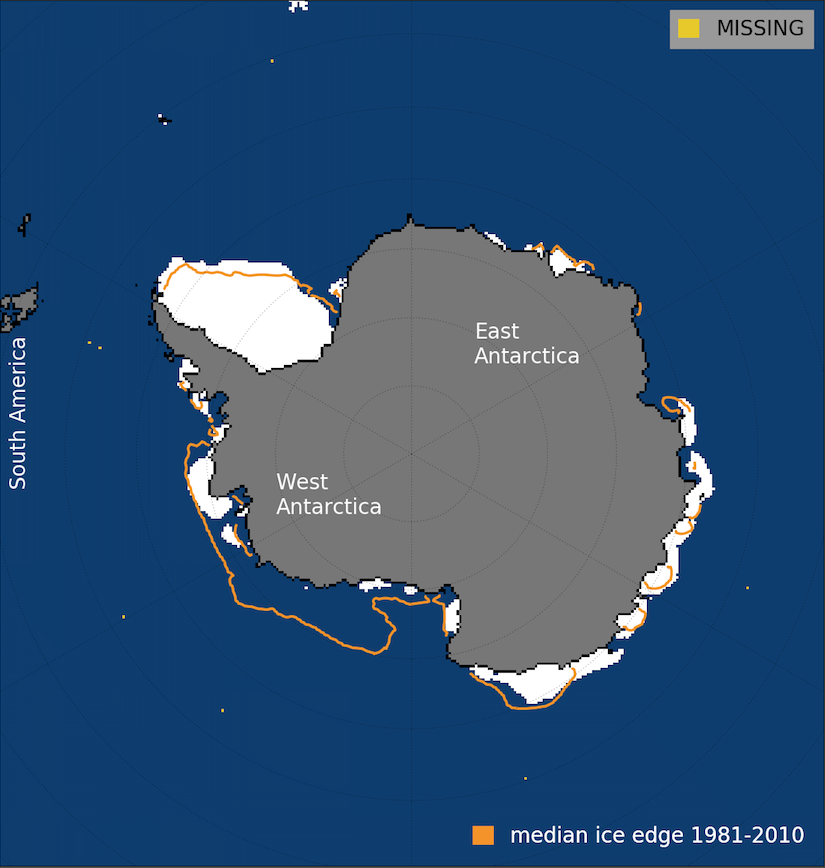
Antarctic sea ice extent for March 3, 2017 was 2.11 million square kilometres. The orange line shows the 1981 to 2010 median extent for that day. Source: NSIDC
Having passed the summer minimum, sea ice has started growing again. But scientists will be keeping a close eye in coming months to see how the ice fares over the winter freeze up season, explains Prof John Turner, a climatologist at the British Antarctic Survey. He tells Carbon Brief:
“The rate of recovery after 1 March has been a little slow, but not too far off what we see normally. It’s just that the amount of ice is about 400,000 square kilometres less than the previous minimum.”
Bucking the trend
Such low ice cover at this time of year is unusual for recent times. Satellites have, in fact, measured a slight increase in Antarctic sea ice over the past 20 years or so, despite rising global temperature. You can see this in the graph below from NSIDC.
A number of factors could be behind this somewhat counter-intuitive trend, says Dr Jonathan Day, an expert in sea-ice prediction at the University of Reading. He tells Carbon Brief:
“[The upward trend in Antarctic sea ice] could be a response to human-caused climate changes, such as ozone depletion or freshening of the ocean surface due to melting of land ice, both of which may cause the ice cover to expand.”
Evidence also suggests a change in winds driven by a natural cycle in the tropical Pacific Ocean could be behind recent Antarctic sea ice growth, says Day. Prof Jerry Meehl, a scientist from the National Centre for Atmospheric Research and lead author on that research, tells Carbon Brief:
“The connection from the tropical Pacific to the Antarctic involves a chain reaction of linked physical processes that ends up with the winds around Antarctica affecting sea ice extent.”
If natural variability has been masking the signal of human-caused climate change in the Antarctic over the satellite period, this pattern will reverse at some stage. In fact, it may already have, says Meehl. He tells Carbon Brief there is evidence the Pacific cycle “switched” in 2015, which could mean we’re seeing the start of a declining trend in Antarctic sea ice.
But the message from scientists is that while Antarctic sea ice appears to be bucking the trend this year, they need more than a single year before they can tell if a long-term change is afoot.
Conclusion
Overall, it has been an exceptional year for the world’s ice cover. While Antarctic sea ice has thrown up a few interesting questions for polar scientists, record low levels in the Arctic for this time of year continues the persistent downward trend that characterises the last three decades.


In addition the PIOMAS Arctic sea ice volume numbers for March 2017 have just been released:
http://GreatWhiteCon.info/2017/04/facts-about-the-arctic-in-april-2017/#Apr-4
As expected Arctic sea ice volume is still by far the lowest in the PIOMAS record, and seems certain to result in another "minimum maximum" this year.
Volume on March 31st 2017 was 20.398 thousand km³. The previous lowest volume for the date was 22.129 thousand km³ in 2011.
On those PIOMAS numbers... it looks like the yearly max volume now is roughly equivalent to where the yearly min volume was in 1980. Meanwhile the minimum has dropped ~80% and is now approaching zero.
Which would mean that a continuing linear trend, let alone the accelerating decline which has actually been going on, would result in the Arctic being nearly ice free year round by ~2060.
Yes the arctic is likely to be ice free within many peoples lifetimes. However Russia, America and Canada and some smaller nations may see this as an economic opportunity. It's no coincidence the USA and Russia in particular are sceptical of causes of climate change, and another reason for Trump and Putin are so friendly.
There are multiple business agendas going on here, and personal interests and beliefs being promoted. They don't see that the planet could get wrecked in the process. Some people are short term thinkers and huge risk takers, and will gamble anything to the detriment of everyone else.
www.cfr.org/arctic/thawing-arctic-risks-opportunities/p32082
CBDunkerson@2,
Not quite. First, you're exagerating. I read the min in 1979 (grey line) was 14k km3, while Jim quotes today's max at 20. So max has still awhile to drop to reach 14.
Second, remember we're talking about volume reconstruction, rather than area. Volume may drop to near zero but area may stay large if ice becomes simply thinner. So, arctic will not be simply ice-free.
Third, even if summer minimum drops to zero for an extended period of time (likely by mid-century) it does not take much of winter cold to freeze over large part of arctic. Irt's enough that the temps drop below 0C which will be happening for many years ahead, certainly the whole century.
Finally, if you look at IPCC sea ice projections, the downward trajectory will deflect and flatten in the second half of the century, so the exponential/linear process of ice loss will reverse, I think for the reasons I noted in third.
But the message from scientists is that while Antarctic sea ice appears to be bucking the trend this year, they need more than a single year before they can tell if a long-term change is afoot.
True, but the fact that the total increase over the last 38 years has been totally reversed is an indication of just how small that increase has been. Imagine the uproar in the denialsphere if minimum arctic sea ice extent was to reach a maximum for the sattelite era. Moreover using linear regression the rate of increase in average March extent in the Antarctic over the sattelite era is no longer statistically significant.
Chris @2 - Although Arctic sea ice extent has passed it's maximum for this year, volume is still increasing. The situation is bad, but not as bad as you're suggesting!
The September average volume in 1980 was just over 16 thousand km³.
Volume always keeps increasing for a while after the extent peak. Yet volume has never been so low at this point in the cycle. Why do you argue that increasing volume in April means there is nothing to worry about re. overall volume?
The article title "Sea ice falls to record lows in both the Arctic and Antarctic" has been misinterpreted by some deniers in UK. They probably have not read the article, but they take 'record' to be a verb, not an adjective, and so are claiming that the sea ice levels haven't fallen as low as predicted. I suppose it's the law of unintended consequences, and the article itself couldn't be plainer in its explanation, but please, take a little more care!
jgnfld @7 - Was your remark addressed to me? If so, that's not what I'm arguing.
I was merely pointing out that CBD seemed to have misread a PIOMAS graph, and the suggestion that "the yearly max volume now is roughly equivalent to where the yearly min volume was in 1980" is not correct:

The physical validity of those exponential extrapolations is of course open to question!
My bad.
Extrapolation is _always_ suspect, true. but at least interpolation in this case can likely be attributed to observable temp/weather changes.