Climate Science Glossary

Term Lookup

Enter a term in the search box to find its definition.

Settings

Use the controls in the far right panel to increase or decrease the number of terms automatically displayed (or to completely turn that feature off).

Term Lookup

Settings


All IPCC definitions taken from Climate Change 2007: The Physical Science Basis. Working Group I Contribution to the Fourth Assessment Report of the Intergovernmental Panel on Climate Change, Annex I, Glossary, pp. 941-954. Cambridge University Press.

Home Arguments Software Resources Comments The Consensus Project Translations About Support

Twitter Facebook YouTube Mastodon MeWe

RSS Posts RSS Comments Email Subscribe


Climate's changed before
It's the sun
It's not bad
There is no consensus
It's cooling
Models are unreliable
Temp record is unreliable
Animals and plants can adapt
It hasn't warmed since 1998
Antarctica is gaining ice
View All Arguments...


Username
Password
New? Register here
Forgot your password?

Latest Posts

Archives

Understanding the significance of the tropospheric hot spot

What the science says...

Select a level... Intermediate Advanced

Satellite measurements match model results apart from in the tropics. There is uncertainty with the tropic data due to how various teams correct for satellite drift. The U.S. Climate Change Science Program conclude the discrepancy is most likely due to data errors.

Climate Myth...

There's no tropospheric hot spot

The IPCC confirms that computer modeling predicts the existence of a tropical, mid-troposphere “hot spot” about 10km above the Earth’s surface. Yet in the observed record of the Hadley Centre’s radiosondes, the predicted “hot-spot” signature of anthropogenic greenhouse warming is entirely absent (source: Christopher Monckton)

The tropospheric hot spot is due to changes in the lapse rate (Bengtsson & Hodges 2009, Trenberth & Smith 2006, Ramaswamy 2006). As you get higher into the atmosphere, it gets colder. The rate of cooling is called the lapse rate. When the air cools enough for water vapor to condense, latent heat is released. The more moisture in the air, the more heat is released. As it's more moist in the tropics, the air cools at a slower rate compared to the poles. For example, it cools at around 4°C per kilometre at the equator but a much larger 8 to 9°C per kilometre at the subtropics.

When the surface warms, there's more evaporation and more moisture in the air. This decreases the lapse rate - there's less cooling aloft. This means warming aloft is greater than warming at the surface. This amplified trend is the hot spot. It's all to do with changes in the lapse rate, regardless of what's causing the warming. If the warming was caused by a brightening sun or reduced sulphate pollution, you'd still see a hot spot.

There's a figure in the IPCC 4th Assessment report that shows the "temperature signature" expected from the various forcings that drive climate. This figure is frequently misinterpreted. Let's have a close look:   

ar4 hotspot
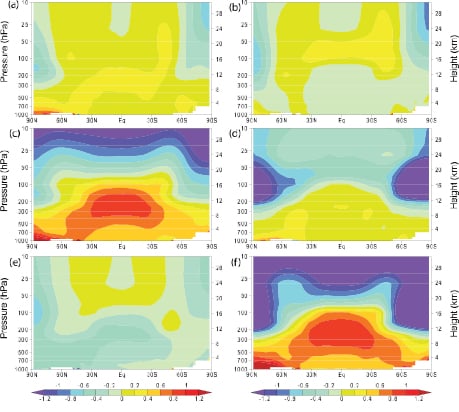
Figure 1: Atmospheric temperature change from 1890 to 1990 from (a) solar forcing, (b) volcanoes, (c) greenhouse gases, (d) ozone, (e) sulfate aerosols and (f) sum of all forcing (IPCC AR4).

The source of the confusion is box c, showing the modelled temperature change from greenhouse gases. Note the strong hot spot. Does this mean the greenhouse effect causes the hot spot? Not directly. Greenhouse gases cause surface warming which changes the lapse rate leading to the hot spot. The reason the hot spot in box c is so strong is because greenhouse warming is so strong compared to the other forcings.

The hot spot is not a unique greenhouse signature and finding the hot spot doesn't prove that humans are causing global warming. Observing the hot spot would tell us we have a good understanding of how the lapse rate changes. As the hot spot is well observed over short timescales (Trenberth & Smith 2006, Santer et al. 2005), this increases our confidence that we're on track. That leaves the question of the long-term trend.

What does the full body of evidence tell us? We have satellite data plus weather balloon measurements of temperature and wind strength. The three satellite records from UAH, RSS and UWA give varied results. UAH show tropospheric trends less than surface warming, RSS are roughly the same and UWA show a hot spot. The difference between the three is how they adjust for effects like decaying satellite orbits. The conclusion from the U.S. Climate Change Science Program (co-authored by UAH's John Christy) is the most likely explanation for the discrepancy between model and satellite observations is measurement uncertainty.

Weather balloon measurements are influenced by effects like the daytime heating of the balloons. When these effects are adjusted for, the weather balloon data is broadly consistent with models  (Titchner et al. 2009, Sherwood et al. 2008, Haimberger et al. 2008). Lastly, there is measurements of wind strength from weather balloons. The direct relationship between temperature and wind shear allows us to empirically obtain a temperature profile of the atmosphere. This method finds a hot spot (Allen & Sherwood 2008).

Looking at all this evidence, the conclusion is, well, a little unsatisfying - there is still much uncertainty in the long-term trend. It's hard when the short-term variability is nearly an order of magnitude greater than the long-term trend. Weather balloons and satellites do a good job of measuring short-term changes and indeed find a hot spot over monthly timescales. There is some evidence of a hot spot over timeframes of decades but there's still much work to be done in this department. Conversely, the data isn't conclusive enough to unequivocally say there is no hot spot.

The take-home message is that you first need to understand what's causing the hot spot. "Changes in the lapse rate" is not as sexy or intuitive as a greenhouse signature but that's the physical reality. Once you properly understand the cause, you can put the whole issue in proper context. As the hot spot is due to changes in the lapse rate, we expect to see a short-term hot spot. We do.

What about a long-term hot spot? With short-term observations confirming our understanding of the lapse rate, that leaves spurious long-term biases as the most likely culprit. However, as observations improve, if it turns out the long-term hot spot is not as strong as expected, the main question will be why do we see a short-term hot spot but not a long-term hot spot?

Intermediate rebuttal written by John Cook


Update July 2015:

Here is a related lecture-video from Denial101x - Making Sense of Climate Science Denial


Last updated on 13 November 2016 by pattimer. View Archives

Printable Version  |  Offline PDF Version  |  Link to this page

Argument Feedback

Please use this form to let us know about suggested updates to this rebuttal.

Comments

1  2  Next

Comments 1 to 25 out of 36:

  1. It is also worth noting that the claims that "hot spot" is a signature of AGW is not correct, at least in the sense of it being a distinguishing characteristic for that particular warming mechanism. As Gavin Schmidt has shown here, the same sort of signature would be expected if the warming were due to an increase in solar irradiance: http://www.realclimate.org/index.php/archives/2007/12/tropical-troposphere-trends/ [Where the two mechanisms (greenhouse gases vs solar) are distinguishable is in the stratosphere where solar should cause warming and greenhouse gases should cause cooling. There, the satellite and radiosonde data unambiguously show cooling.] In fact, this amplification of trends as you go up in the tropical troposphere is predicated on a very basic piece of physics, what is called "moist adiabatic lapse rate theory"...And, it is expected to hold not only for the multidecadal trends but also for the temperature fluctuations over shorter intervals (say on the order of months to a year or so) due to things like El Nino oscillations. And, the satellite and radiosonde data confirm this amplification for the fluctuations (see Santer et al., 2005: http://www.sciencemag.org/cgi/content/abstract/sci;309/5740/1551 ). Where the satellite data and radiosonde data do not necessarily confirm the amplification is for the multidecadal trends...but both the satellite data and radiosondes are known to have problems that can easily produce spurious secular trends over these long time periods. So, in other words, the data only deviates from the theoretical expectations where the data is least reliable (and whether it deviates significantly depends on whose satellite analysis or radiosonde analysis or re-analysis you believe). This whole thing reminds me of the "God of the Gaps" argument. Originally, the UAH analysis of the satellite data showed the troposphere to be cooling globally...in contradiction to the surface record...and this was a major "skeptic" talking point. Then, a longer record and corrections for problems in the analysis (like the neglect of orbital decay of the satellites) turned the global cooling trend into a global warming trend, but it wasn't as strong as at the surface...and this was still a major "skeptic" talking point. Now that a still longer record and further corrections (along with a completely independent analysis of the satellite record by the RSS group) show that the trend found by satellites matches the trend found at the surface globally within error bars, the "skeptic" talking point has become the trend in the tropics. And, no doubt, when that is resolved, they will find something else to point to! No matter how little the "gaps" are, there is always room to say, "The evidence disproves AGW!"
  2. That's amazing: a year later and you are so right. Now it's the ratio of the surface and tropospheric trends. http://www.mdpi.com/2072-4292/2/9/2148/pdf
  3. What else could cause stratospheric cooling other than the enhanced greenhouse effect? Also, can you point me to an image showing what the actual temperature change profile looks like? TIA
  4. Hi Mango @3, You must have changed your spots, posting at a real science web site like SkS ;) This thread is about temperatures in the upper tropical troposphere, not the stratosphere. Your questions are on the wrong thread. Try here. The search engine on the top LHS of the page is very useful for finding the relevant thread, as I just did. I would help answer your questions, I have a paper in mind, but I do not wish to embark on a fool's errand by engaging you given your history at BBC and WUWT.
  5. apologies albatross but the article does talk about cooling in the stratosphere - i'll try the other thread didn't know i was being watched so carefully! what nake do you post under at the BBC and WUWT? just goes to prove that i do read the opposite view and links that people suggest, and i really am open to other views. A little shame that others on the BBC website are less prepared to look at both sides of the argument
  6. Mango @6, This is not WUWT or BH. So no need to be paranoid, and please stop alluding to nefarious conduct by me. I have seen your posts at WUWT and on Richard Black's "skeptic" riddled blog, simple as that. So pardon my prudence.
  7. Hello Mango @5, Re "stratospheric cooling". My apologies, I was looking at the "intermediate" page, not the "advanced page and reference is made to stratospheric cooling in the latter. Your questions about the stratosphere are more suited and more likely to be answered on the other page though, and I see you have posted there. Thanks.
  8. @6 it was meant as a joke, so apologies if you took it the wrong way
  9. MangoChutney, I would be interested to know if you have read the 'Advanced' tab of this post. If you have, are you prepared to accept that your past assertions on Richard Black's blog, and I'm sure in many other places, tht the tropical tropospheric hotspot is an 'AGW signature that hasn't been found', is incorrect? Actually your assertions at the BBC on this thread have been almost a carbon copy of Monckton's quote above. So, will you do what few skeptics have the strength of character to do, and accept that you were wrong on this point?
  10. @9 Can't win, can I? If I ignore links to SkS I'm condemned as a "denier" for not listening to both sides and if I engage with readers of SkS I'm immediately pounced upon to confess my sins. In answer, yes I have read the advanced tab and no I am not convinced, hence the questions
  11. Is there such a thing as a graph showing the actual observed data - not prepared by Monckton that both sides can agree on?
  12. #10 Mango, you like taking the emotive line, but I am after a scientific reasoning as to why you believe that the tropospheric hotspot is specifically an AGW signature. The 'advanced' tab clearly shows that it is by no means unique to AGW, so where do you think this is wrong, and upon what scientific basis? You have, elsewhere, insinuated that data has then been massaged to fit the models (much like Lindzen suggested as discussed above), yet clearly this is not the case. This area of the science is one that has significant uncertainties (as the Thorne graph above shows), yet is not fundamental to the validity of our understanding of the climate system. Lindzen, Monckton and others love to portray otherwise, and I'd hate to see you be taken in by their misinformation. Forget the emotion, or feeling hurt that you've been called out on these statements you've made, as you now have a great chance to present the science for your case.
  13. Mango, Nobody has asked you to confess your sins, can you please tone down the rhetoric and stop arguing strawmen. IIRC, Skywatcher was asking if you accept that you are wrong about the so-called hot spot in the upper tropical troposphere being purely an anthropogenic signal/signature/fingerprint. So what are you not convinced about in this regard? 1) That the hot spot is not purely an anthropogenic "signal"? It is not a fingerprint of AGW, it is a fingerprint of a warming planet regardless of the cause of the warming. 2) That the "hot spot" upper tropical troposphere not discernible in the observations? Please state your position clearly. This is exactly why I asked you on another thread to list your top three or so primary concerns, to avoid what is happening now. Now concerning the validation of the model simulations of the "hot spot". I suggest that you read the very latest literature on this by Thorne et al. (2011). They conclude that: "It is concluded that there is no reasonable evidence of a fundamental disagreement between tropospheric temperature trends from models and observations when uncertainties in both are treated comprehensively." If that paper in addition to the other excellent papers cited in the main post do not convince you then nothing will I'm afraid. We can provide you with facts, but the rest is up to you. "thing as a graph showing the actual observed data" What is wrong with the data presented by Thorne et al. (2008)? Are you suggesting that the data from multiple agencies and data observation platforms are not trustworthy? And why do both "sides" have to agree on hard, cold facts? You have a very troubling idea of how science works Mango.
  14. I think the argument is not that the tropospheric hot spot is unique to co2 forcing. Instead, I believe what is at question is climate sensitivity. As I understand it, the tropospheric hot spot would reflect the amplification of the co2 forcing by the positive feedback from water vapor that is assumed in the global climate models, through its effect on moist lapse rate. Regardless of how the data may be tortured, as in the "wind shear" argument cited above, all of the radiosonde data shows no evidence for a tropospheric hot spot. And without this tropospheric hot spot, the theory of water vapor multiplying the effect of higher c02 is disproven. Without higher climate sensitivity, the effects of increasing co2 on global temperatures are much more limited. Isn't this the real problem that the lack of evidence for a tropical hotspot presents for the anthropogenic global warming theory, ie. that the theorized high climate sensitivity to co2 increases will have positive feedback with large and catastrophic effects?
  15. tompinlb @14: 1) The lack of a tropospheric hotspot shows the absence of the lapse rate feedback - a negative feedback. The absence of a negative feedback does not show that there are no significant positive feedbacks. 2) The Water Vapour feedback depends primarily on water vapour concentrations in the lower troposphere which are known by direct observation to have increased. The situation where you have a significant increase in WV in the lower troposphere but not in the mid and upper troposphere would result in a strong WV feedback and a weak lapse rate feedback, thus resulting in an overall stronger net positive feedback from the effects of WV. 3) The total effect depends critically on the actual change in the WV concentration profile, which is not well established so the net final effect cannot be absolutely nailed down. 4) Paleoclimate based estimates of climate sensitivity make no assumptions about the relative contribution of different feedbacks, and still cluster around the 3-4 degree C range per doubling of CO2. It may well be that the net feedback of WV (WV feedback - lapse rate feedback) is weaker than predicted by the models, by the net ice and snow albedo feedback is much stronger (which is almost certain). Focusing on just one part of the equation is no basis for ignoring the paleo evidence on climate sensitivity.
  16. Also note, that climate sensitivity isnt about CO2 forcing necessarily, but the sensitivity to any radiative forcing change. As TC notes, the water vapour feedback is established directly - some pretty fundamental physics would have to be wrong if not present. Your comments about "torturing data" are misplaced. The question is whether such measurements are able to show the model effect. Finally, "large and catastrophic effects" is rhetoric. Since this is a science site, perhaps its better to confine discussion to effects actually predicted by the science? (ie AR4 WG2). "Catastrophic" means different things to different people. ie for some it would be forced-migration from large deltas because of salt-invasion; while for others it appears to be higher taxes or fuel costs. The argument is that evidence to date suggests its cheaper to mitigate emissions now, rather than pay cost of adaption later.
  17. Responding to this post by tompinlb. In addition to the discussion in the Advanced tab of this article, issues over errors and biases in radiosonde data are discussed here with references to the relevant papers.
  18. Like scaddenp, my response to tompinlib would be to point out that there is plenty of reason to think that the problem may lie with the radiosonde observations as well as the models ("all models are wrong, but some are useful" - GEP Box). They were designed for use in weather forecasting, not climate modelling, and so while the data may have a resolution of 0.1K, they have many potential sources of bias which means that they are unlikely to be well calibrated. A lot of computer modelling work has to be done to homogenise the data to remove these sources of bias and it is ongoing work. The fact that there is a high degree of uncertainty in the radiosonde observations is well illustrated by the differences between radiosonde products from different research groups. See the advanced tab of the article.
  19. First of all, hi again to everyone, I've been silent for several years but reading you almost on a daily basis :)

    Just bumped into this blog post - is it me or Spencer cherry picks exactly the tropical hot spot region where observational data is doubtful to prove the "epic failure" of GCMs??

    http://www.drroyspencer.com/2013/06/still-epic-fail-73-climate-models-vs-measurements-running-5-year-means/

    Thx again

  20. Wouldn't the fact that the warming is in fact concentrated at the poles this past decade or so,  and the low latitude ocean surface temps being dominated by a quiet ENSO so having not had a lot of warming lately (owing to the heat being carried into the deep ocean), make it reasonable that an effect that is ascribed to warming of the area SHOULD weaken when the area is not warming that much?  


    Just sayin...  If one is looking for this in the tropical troposphere as something that is happening ALL the time one may be ignoring what is actually happening SOME of the time. 

  21. What is the significance of the hot spot signal? The hot spot is predicted by GCMs which predict strong net positive feedbacks in the climate response. This is why a doubling of Co2, which would all things being equal, cause 1.2C warming, can, via positive feedbacks purportedly lead to much more warming. Where is the hot spot? "Conversely, the data isn't conclusive enough to unequivocally say there is no hot spot." The burden of proof lies with those looking for the hot spot, not with the null hypothesis. 

    "Does this mean the greenhouse effect causes the hot spot? Not directly". If the climate system is highly sensitive to increases in Co2 radiative forcing, it must be fairly sensitivite to all forcing. The feedbacks are enacted more or less the same no matter what causes the warming right?


    There does not seem to be strong evidence that the (long term?) hot spot exists. This is a problem for climate models which predict it. Of course more observations might reveal it, or they might not. For now, the evidence is not there. 

  22. This is kind of getting a bit old. There are numerous other predictions from climate models where the observer system isn't to validation; I wonder why this one was picked on.

    Anyway, observation systems are improving and it would appear hot spot does exist. eg here or here.

  23. Could use an update with a link to more recent data...  

    http://www.theguardian.com/environment/climate-consensus-97-per-cent/2015/mar/25/one-satellite-data-set-is-underestimating-global-warming

    "They also discovered that the results from RSS, NOAA, and the new study all show tropical amplification and are in agreement with the expected amplification from climate models. They state, “There is no significant discrepancy between observations and models for lapse rate change between the surface and the full troposphere.”

    http://iopscience.iop.org/article/10.1088/1748-9326/10/5/054007;jsessionid=336015B648DF0E7B22B949A919FAD2E3.ip-10-40-2-81

    http://blog.hotwhopper.com/2015/05/about-that-tropical-hot-spot.html

    Response:

    [JH] Links activated. 

    Please take the time to learn how to use the eiditing function to embed a link into text.

  24. The first two images are broken. They should be:

    2% increase in solar forcing (via RealClimate)

    Doubling of CO2 (via RealClimate)

  25. Figure 1 from Sherwood and Nishant (2015) from iUK2 is clear enough in showing the reduced lapse rate in the equatorial troposphere caused by increased evaporation.  It seems balloons just hadn't captured good enough data before.  I'm still seeing naive claims there is 'no hotspot'.

    Fig 1 from Sherwood and Nishant 2015, showing equatorial tropospheric warming


1  2  Next

Post a Comment

Political, off-topic or ad hominem comments will be deleted. Comments Policy...

You need to be logged in to post a comment. Login via the left margin or if you're new, register here.

Link to this page


The Consensus Project Website

THE ESCALATOR

(free to republish)


© Copyright 2024 John Cook
Home | Translations | About Us | Privacy | Contact Us